Last updated: March 13, 2026
Docker Monitoring with cAdvisor: The Definitive Guide
Every container you run consumes CPU cycles, memory pages, network bandwidth, and disk I/O. The tricky part is that containers share a host kernel and fight over those finite resources in ways that are invisible unless you instrument the right layer.
cAdvisor (Container Advisor) is an
open-source daemon built by Google that sits at exactly that layer, reading
Linux cgroup accounting data and translating it into metrics you can actually
use.
In this guide, we'll start with what cAdvisor actually does under the hood, then deploy it alongside the OpenTelemetry Astronomy Shop demo so you have a realistic multi-service workload to observe.
From there, we'll wire up Prometheus for long-term storage and Grafana for production-grade dashboards and alerting. By the end, you will understand not just the "how" of cAdvisor, but the "why" behind every metric it exposes, and how to avoid the common pitfalls that trip up even experienced operators.
What is cAdvisor and why does it exist?
cAdvisor is a daemon that runs on a host and automatically discovers every container running on that machine. Once it detects a container, it immediately begins collecting resource usage statistics without requiring any configuration inside the container itself.
You do not instrument application code, install monitoring agents in containers, or rebuild images. Instead, cAdvisor integrates directly with the container runtime such as Docker, containerd, or CRI-O. It reads the Linux kernel interfaces that already track CPU, memory, network, and filesystem activity for each control group (cgroup), which is the kernel mechanism used to isolate container resources.
Google originally built cAdvisor for internal use and open sourced it in 2014.
The project quickly became foundational to the container ecosystem and was later
embedded directly into Kubernetes through the kubelet.
Today it still powers the resource metrics used by features such as Horizontal
Pod Autoscaling, Vertical Pod Autoscaling, and the kubectl top command. In
practice, this means that even if you've never deployed cAdvisor yourself,
you're already relying on it whenever you run workloads on Kubernetes.
How cAdvisor works under the hood
cAdvisor works by reading the same kernel data structures that the container runtime itself relies on to enforce resource limits.
Every container runs inside a Linux control group (cgroup). When the container
starts, the runtime places its processes into a dedicated cgroup, and the kernel
begins accounting for CPU time, memory usage, network traffic, and disk I/O for
that process group. These statistics are exposed through pseudo-files under
/sys/fs/cgroup.
cAdvisor periodically reads those files and converts the raw counters into
metrics. For example, CPU usage comes from counters such as cpuacct.usage in
cgroups v1 or cpu.stat in cgroups v2, while memory statistics come from files
like memory.stat and memory.current. Because these values are maintained by
the kernel itself, they represent the exact resource consumption of the
container rather than sampled estimates.
Internally, cAdvisor runs a housekeeping loop that refreshes these statistics on
a regular interval. The default interval is one second, though it can be changed
with the --housekeeping_interval flag. The collected metrics are stored only
briefly in memory, typically for about a minute, which is why cAdvisor must be
paired with a time-series system such as Prometheus if you want historical data.
When cAdvisor starts, it also detects the container runtime and watches for container lifecycle events. New containers are discovered automatically and begin emitting metrics immediately, without any configuration or instrumentation inside the container itself. This automatic discovery is one of the reasons cAdvisor is so widely used for container monitoring.
Prerequisites
To follow along with the examples in this guide, you need Docker installed on your machine. All commands were tested using Docker 29.x on Ubuntu 24.04, but any reasonably recent Docker installation on Linux should behave the same way.
Before starting, pull the cAdvisor container image that will be used in the examples. At the time of writing, the latest release is v0.56.1:
1docker pull ghcr.io/google/cadvisor:0.56.1
This downloads the official cAdvisor container image from the GitHub Container Registry so that it can be started locally in the next section.
Setting up cAdvisor with Docker Compose
If you already have containers running on your machine, adding cAdvisor is simply a matter of starting one additional container with access to the host's container runtime data.
Once it starts, cAdvisor automatically discovers every container on the host and begins collecting CPU, memory, network, and filesystem metrics without requiring any changes to the workloads themselves.
The easiest way to run it alongside an existing environment is through Docker
Compose. Add the following service definition to your docker-compose.yml file:
123456789101112131415161718192021services:cadvisor:image: ghcr.io/google/cadvisor:0.56.1container_name: cadvisorprivileged: truedevices:- /dev/kmsg:/dev/kmsgvolumes:- /:/rootfs:ro- /var/run:/var/run:ro- /sys:/sys:ro- /var/lib/docker/:/var/lib/docker:ro- /dev/disk/:/dev/disk:roports:- "8081:8080"deploy:resources:limits:memory: 256Mcpus: "0.5"restart: unless-stopped
This configuration launches cAdvisor as a regular container while granting it read access to the host resources it needs to inspect container activity.
Several parts of this configuration are worth highlighting.
The privileged: true flag and the mounted volumes allow cAdvisor to read the
kernel and container runtime state on the host. In particular, access to /sys,
/var/run, and /var/lib/docker allows it to inspect the Linux cgroup
hierarchy and discover running containers. These mounts are read-only so that
cAdvisor cannot modify host state.
The /dev/kmsg device exposes the kernel message buffer to the container, which
cAdvisor uses for certain low-level diagnostics and logging.
The web interface is published on port 8081 to avoids colliding with other
services that may already use port 8080 in your environment.
Finally, the resource limits restrict how much CPU and memory the monitoring agent itself can consume. In production environments it is good practice to place limits on observability components so that monitoring cannot compete with the workloads it is supposed to observe.
Once the configuration is in place, start the environment with:
1docker compose up --force-recreate --remove-orphans -d
After a short time, Docker Compose should report that all containers are running. You can verify this with:
1docker compose ps
You should see cadvisor listed alongside your existing services with a status
of Up, indicating that it's actively monitoring the containers running on the
host:
12NAME IMAGE COMMAND SERVICE CREATED STATUS PORTScadvisor ghcr.io/google/cadvisor:0.56.1 "/usr/bin/entrypoint…" cadvisor 13 hours ago Up 13 hours (healthy) 0.0.0.0:8081->8080/tcp, [::]:8081->8080/tcp
Exploring the cAdvisor web UI and metrics endpoint
cAdvisor ships with a built in web interface that immediately displays information about the host and all discovered containers. No additional configuration is required because cAdvisor automatically inspects the container runtime and begins collecting metrics as soon as it starts.
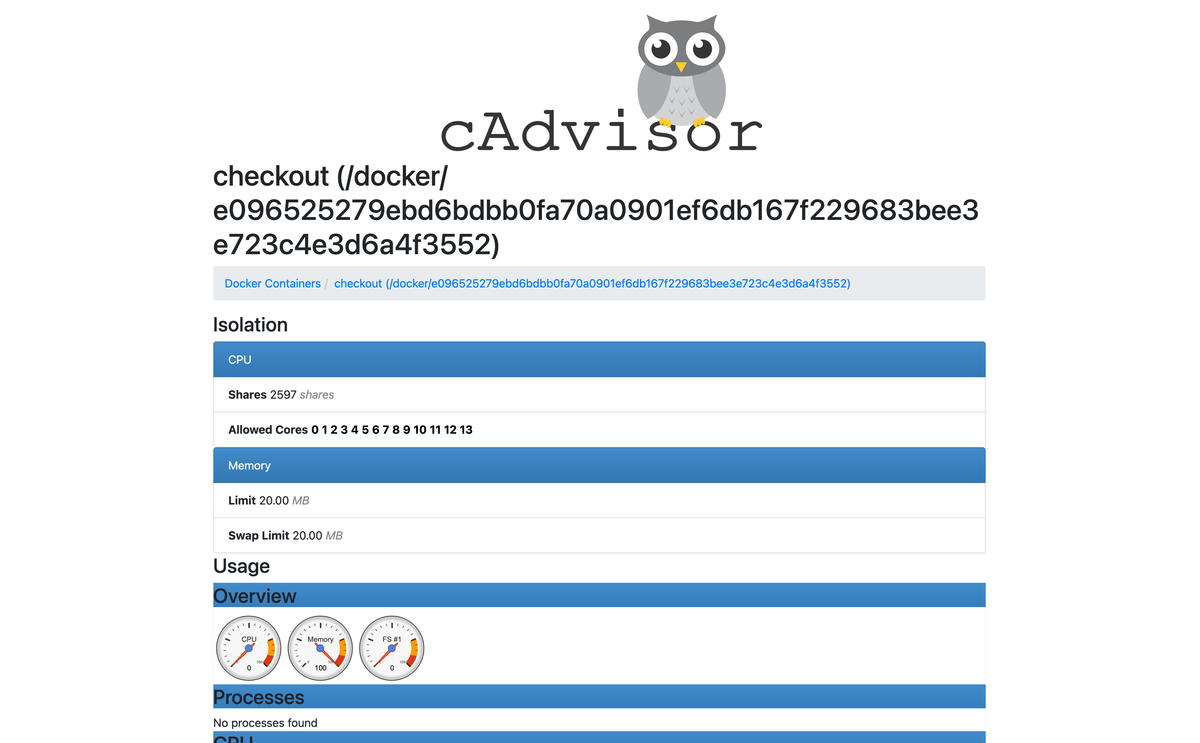
Go ahead and open http://localhost:8081 in your browser to see it in action:
The landing page shows machine level information about the host, including the number of CPU cores, total memory capacity, operating system version, and filesystem usage. This gives you a quick overview of the environment that your containers are running in.
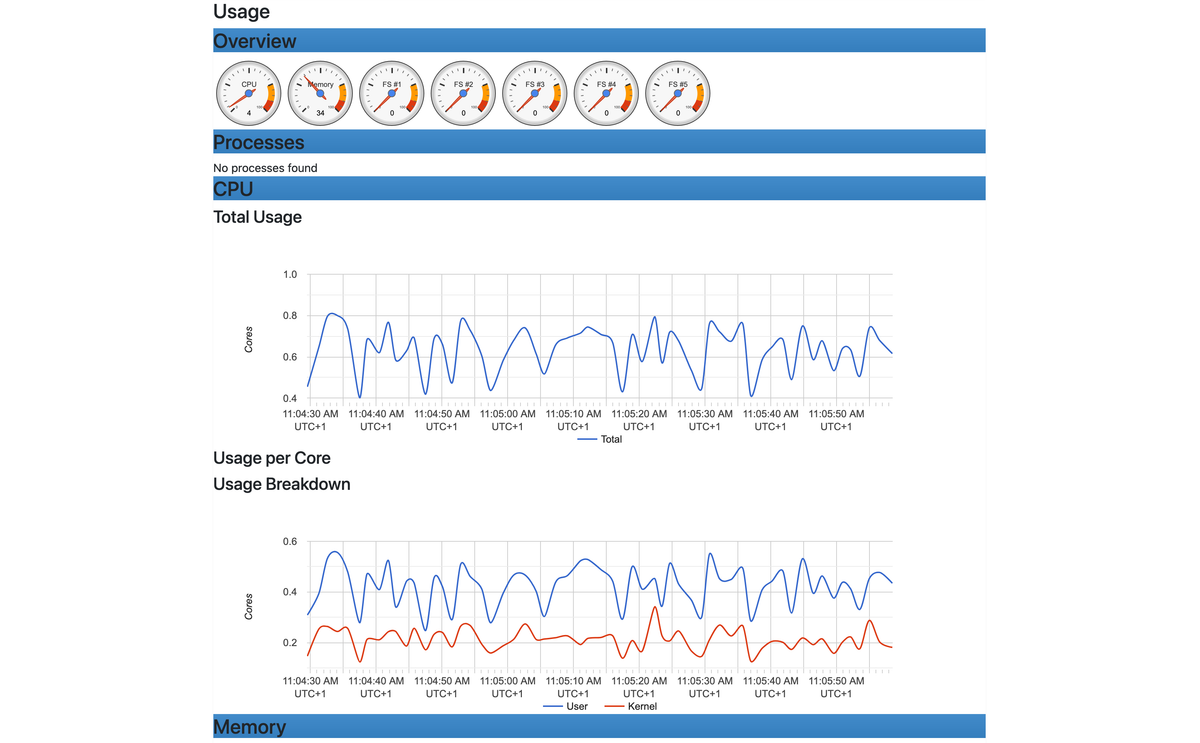
From there, click Docker Containers to view the list of detected containers. Selecting any container opens a dashboard with live gauges and graphs for CPU usage, memory consumption, network throughput, and filesystem I/O.
These graphs are generated from the most recent metrics that cAdvisor keeps in memory, which typically covers roughly the last 60 seconds of activity. Even without any external monitoring system, this view is already useful for quick diagnostics because it lets you immediately see which containers are consuming the most resources.
While the web UI is helpful for visual exploration, the real value of cAdvisor
comes from its /metrics endpoint which exposes all collected metrics using the
Prometheus exposition format.
Open the following URL in your browser:
1http://localhost:8081/metrics
You'll see a large stream of text containing metric names, numeric values, and labels. Each metric represents a specific measurement about container behavior, such as CPU time, memory usage, filesystem operations, or network traffic.
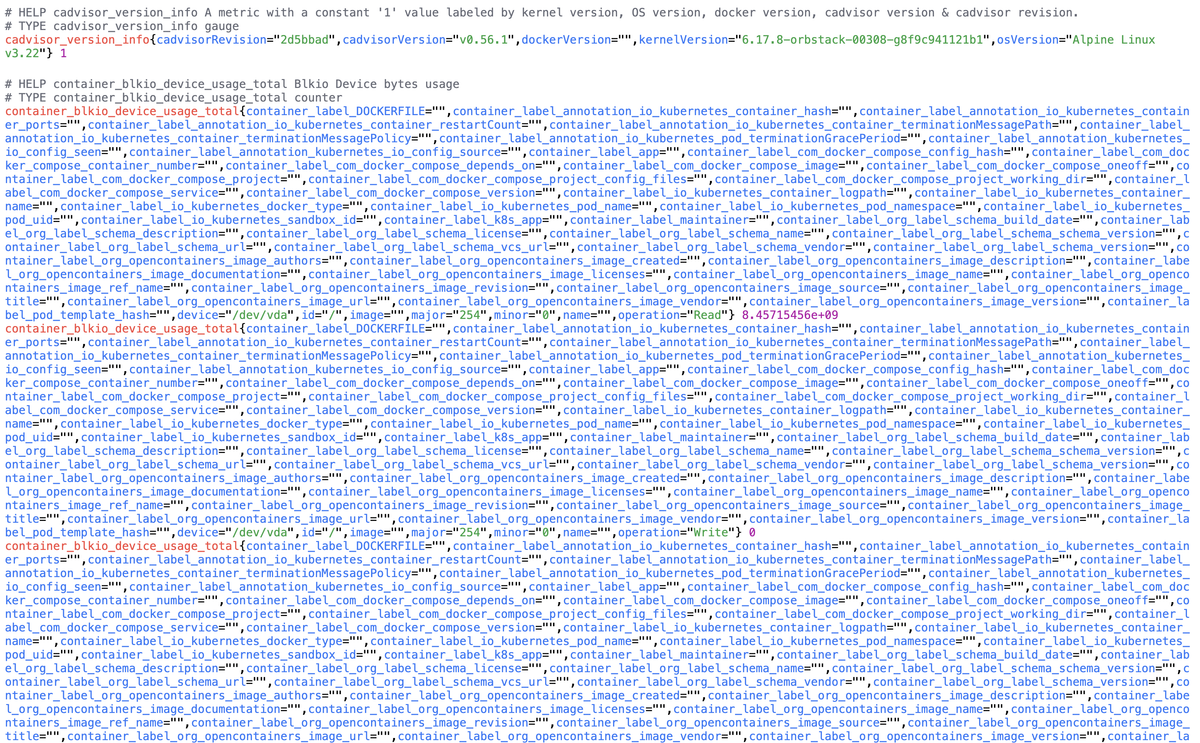
Every metric also includes labels that identify the container it belongs to, such as the Docker container ID, container name, and image. Monitoring systems like Prometheus use these labels to organize the data into time series that can be queried, aggregated, and visualized.
Exploring cAdvisor's REST API
In addition to the Prometheus format endpoint, cAdvisor exposes a versioned REST API that returns JSON. This interface can be useful for scripting or for tools that expect structured JSON instead of Prometheus text metrics.
For example, the following request returns summary statistics for all Docker containers:
1curl -s http://localhost:8081/api/v2.0/summary | jq
This outputs:
12345678910111213141516171819202122232425262728293031323334{"/": {"timestamp": "2026-03-13T09:58:13.710160581Z","latest_usage": {"cpu": 688,"memory": 5168095232},"minute_usage": {"percent_complete": 100,"cpu": {"present": true,"mean": 628,"std": 110,"max": 921,"fifty": 630,"ninety": 778,"ninetyfive": 820,"count": 41},"memory": {"present": true,"mean": 4866909915,"std": 212007427,"max": 5320638464,"fifty": 4818653184,"ninety": 5206475571,"ninetyfive": 5308032000,"count": 42}},"hour_usage": {...},"day_usage": {...}}}
You can also retrieve detailed statistics for a specific container:
12curl -s \http://localhost:8081/api/v1.3/docker/<container_name> | jq
The JSON API exposes the same underlying data that powers the Prometheus endpoint, but organized in a different structure. In practice, most monitoring systems consume the Prometheus format, which is why the remainder of this guide focuses on metrics collection and integration with monitoring pipelines.
At this point, you have a working environment where cAdvisor is collecting metrics from every running container in real time. You can inspect the web UI, browse the raw metrics endpoint, and start exploring what telemetry is available before wiring it into a full monitoring stack.
Exploring some common cAdvisor metrics
cAdvisor exposes many metrics, but in practice a relatively small subset covers most container monitoring needs. The table below summarizes the metrics you will use most often and what they represent.
| Metric | What it tells you |
|---|---|
container_cpu_usage_seconds_total | Total CPU time consumed by a container. Use rate() to calculate CPU usage per second. |
container_cpu_user_seconds_total | CPU time spent executing application code in user space. |
container_cpu_system_seconds_total | CPU time spent in kernel space handling syscalls, scheduling, or I/O operations. |
container_cpu_cfs_throttled_seconds_total | Time the container was throttled by the Linux CFS scheduler because it exceeded its configured CPU quota. Sustained throttling usually means the container needs more CPU. |
container_memory_usage_bytes | Total memory charged to the container's cgroup, including page cache and kernel memory. |
container_memory_working_set_bytes | Active memory usage excluding inactive file cache. Often used as the main indicator of memory pressure. |
container_memory_rss | Anonymous memory such as heap and stack that cannot be reclaimed by the kernel. High RSS indicates real memory pressure. |
container_spec_memory_limit_bytes | The memory limit configured for the container, useful for calculating memory utilization ratios. |
container_network_receive_bytes_total | Total bytes received by the container's network interfaces. Use rate() to calculate throughput. |
container_network_transmit_bytes_total | Total bytes transmitted by the container's network interfaces. |
container_network_receive_packets_dropped_total | Number of received packets dropped by the interface, often indicating congestion or resource limits. |
container_network_transmit_packets_dropped_total | Number of transmitted packets dropped by the interface. |
container_fs_usage_bytes | Disk space used by the container's writable filesystem layer. |
container_fs_limit_bytes | Total capacity of the filesystem available to the container. |
container_fs_reads_bytes_total | Total bytes read from disk by the container. Use rate() to calculate read throughput. |
container_fs_writes_bytes_total | Total bytes written to disk by the container. |
container_fs_io_time_seconds_total | Total time spent performing disk I/O operations. High values can indicate disk saturation. |
machine_cpu_cores | Number of CPU cores available on the host. Useful for calculating utilization ratios. |
machine_memory_bytes | Total memory capacity of the host system. |
Tuning cAdvisor's metric collection behavior
cAdvisor's default behavior is to collect as much information as possible about every container and cgroup it can see. This is convenient for development, but in large environments it can generate more metrics and labels than you actually need.
Several runtime flags help reduce the resource footprint and keep the exported metrics manageable:
-
--docker_only=truetells cAdvisor to monitor Docker containers only, skipping other system cgroups that are typically better covered by tools such as node-exporter. -
--disable_metricslets you disable entire categories of metrics. For example, if you do not need per-CPU breakdowns or specialized kernel metrics, you can reduce the metric volume significantly:text1--disable_metrics=percpu,sched,tcp,udp,disk,diskIO,hugetlb,referenced_memory -
--housekeeping_interval=15sslows the internal collection loop from the default one second interval. Increasing this interval reduces CPU overhead on busy hosts. -
--store_container_labels=falseprevents Docker labels from being exported as Prometheus labels. In container environments with many labels, especially Kubernetes clusters, this single setting can dramatically reduce memory usage and time series count. If you still need specific labels, use--whitelisted_container_labelsto keep only the ones that matter.
1234567891011121314151617181920services:cadvisor:image: ghcr.io/google/cadvisor:0.56.1container_name: cadvisorprivileged: truedevices:- /dev/kmsg:/dev/kmsgvolumes:- /:/rootfs:ro- /var/run:/var/run:ro- /sys:/sys:ro- /var/lib/docker/:/var/lib/docker:ro- /dev/disk/:/dev/disk:rocommand:- --docker_only=true- --housekeeping_interval=15s- --store_container_labels=false- --disable_metrics=percpu,sched,tcp,udp,diskIO,hugetlb,referenced_memoryports:- "8081:8080"
In practice, you'd usually combine this with Prometheus-side
metric_relabel_configs so that both ends of the pipeline work to keep time
series growth under control.
Configuring Prometheus to scrape cAdvisor metrics
The cAdvisor /metrics endpoint becomes far more useful once a monitoring
system begins scraping it continuously. Prometheus is the most common choice
since it natively understands the Prometheus exposition format that cAdvisor
produces.
In this section, you'll add Prometheus to the same Docker Compose environment and configure it to scrape metrics from the running cAdvisor instance.
Start by adding a prometheus service to your docker-compose.yml file:
1234567891011121314151617181920212223# docker-compose.ymlservices:# [...]prometheus:image: prom/prometheus:v3.10.0container_name: prometheusrestart: unless-stoppedvolumes:- ./prometheus.yml:/etc/prometheus/prometheus.yml- prometheus_data:/prometheuscommand:- --config.file=/etc/prometheus/prometheus.yml- --storage.tsdb.path=/prometheus- --storage.tsdb.retention.time=15d- --web.enable-lifecycleports:- 9090:9090depends_on:- cadvisorvolumes:prometheus_data:
This service launches Prometheus and mounts a configuration file from the local directory. It also creates a named volume so that Prometheus can persist its time series database across container restarts.
Next, create the configuration file that tells Prometheus which targets to scrape.
12345678# prometheus.ymlglobal:scrape_interval: 10sscrape_configs:- job_name: cadvisorstatic_configs:- targets: ["cadvisor:8080"]
This configuration instructs Prometheus to scrape metrics every ten seconds and
defines a single scrape job called cadvisor. Because both containers run on
the same Docker Compose network, Prometheus can reach cAdvisor using the service
name cadvisor on port 8080.
Once the configuration file is in place, start the Prometheus container:
1docker compose up prometheus -d
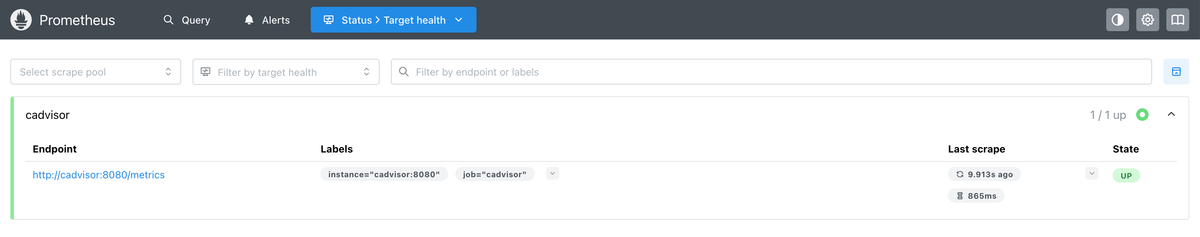
After a few seconds, open the Prometheus targets page in your browser:
1http://localhost:9090/targets
If everything is configured correctly, you should see a cadvisor job listed
with a status of UP. This indicates that Prometheus is successfully scraping
metrics from cAdvisor and storing them in its time series database.
Visualizing cAdvisor metrics in Grafana
Once Prometheus is collecting metrics from cAdvisor, the next step is to visualize them. Grafana provides a flexible dashboarding interface that can query Prometheus and render the data as graphs, gauges, and tables.
Rather than configuring Grafana manually through the web interface, you can provision the data source and dashboards through configuration files. This approach makes the setup reproducible and keeps your monitoring stack fully defined in code.
Start by adding a grafana service to your docker-compose.yml file:
1234567891011121314151617181920212223services:# [...]grafana:image: grafana/grafana-oss:12.4.1container_name: grafanaports:- 3000:3000environment:GF_SECURITY_DISABLE_INITIAL_ADMIN_CREATION: trueGF_AUTH_ANONYMOUS_ENABLED: trueGF_AUTH_ANONYMOUS_ORG_ROLE: AdminGF_AUTH_DISABLE_SIGNOUT_MENU: trueGF_AUTH_DISABLE_LOGIN_FORM: truevolumes:- grafana_data:/var/lib/grafana- ./grafana/provisioning:/etc/grafana/provisioningdepends_on:- prometheusvolumes:prometheus_data:grafana_data:
This service launches Grafana and mounts a local grafana/provisioning
directory where data sources and dashboards will be defined. Grafana
automatically reads these files on startup and applies the configuration.
The configured environment variables disable the default login system and
enable anonymous access with administrative permissions. This works well for a
local demo environment where authentication is unnecessary and the dashboard
should be immediately accessible.
Provisioning the Prometheus data source
Next, create a directory for Grafana provisioning:
1mkdir -p grafana/provisioning/datasources
Inside grafana/provisioning/datasources, create a file named prometheus.yml:
12345678910# grafana/provisioning/datasources/prometheus.ymlapiVersion: 1datasources:- name: Prometheustype: prometheusuid: prometheusaccess: proxyurl: http://prometheus:9090isDefault: true
This configuration instructs Grafana to automatically create a Prometheus data source pointing to the Prometheus container running in the same Docker Compose network.
When Grafana starts, it reads this file and registers the data source without requiring any manual configuration through the UI.
Provisioning a Docker monitoring dashboard
Grafana dashboards can also be provisioned from JSON files. This allows you to keep dashboards version controlled alongside the rest of your infrastructure.
Create a dashboards directory within grafana/provisioning:
1mkdir grafana/provisioning/dashboards
Inside it, create a file named dashboards.yml:
123456789# grafana/provisioning/dashboards/dashboards.ymlapiVersion: 1providers:- name: cadvisorfolder: Containerstype: fileoptions:path: /etc/grafana/provisioning/dashboards/json
Then create the directory that will hold dashboard definitions:
1mkdir grafana/provisioning/dashboards/json
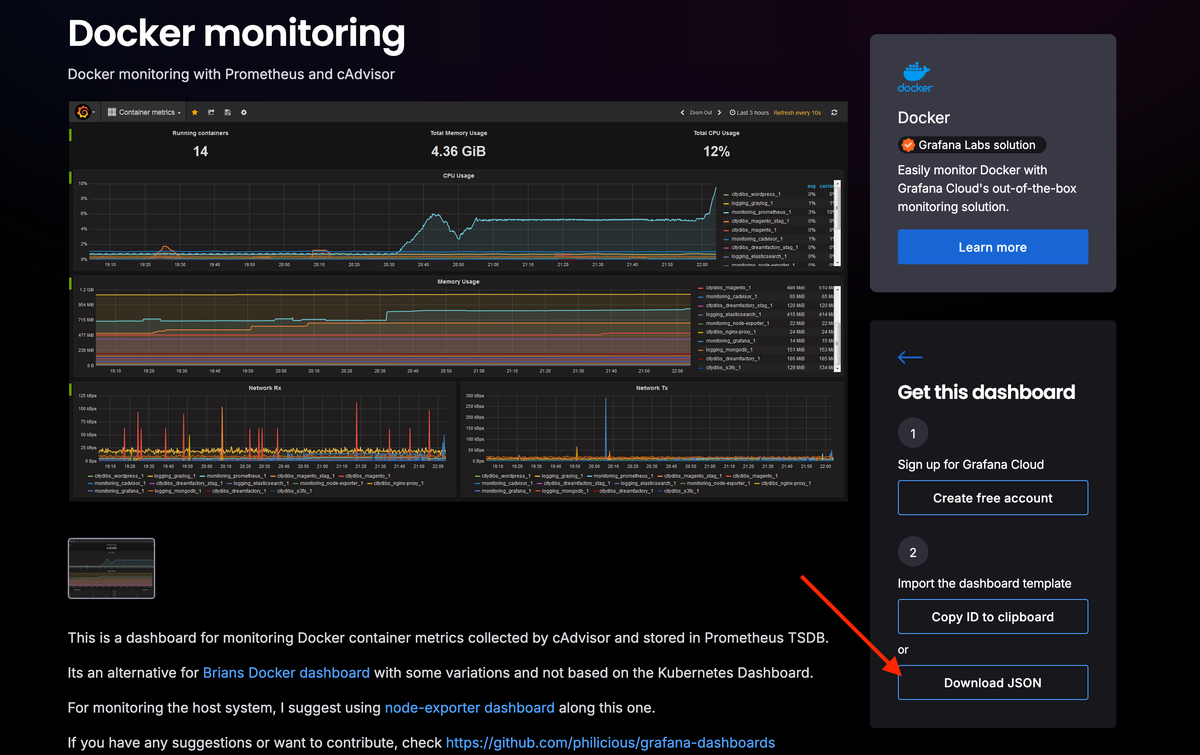
You can download a pre-built dashboard JSON file from the Grafana dashboard library, such as the Docker monitoring dashboard:
1https://grafana.com/grafana/dashboards/193-docker-monitoring/
Place the downloaded JSON file inside the json directory so that when Grafana
starts, it automatically loads the dashboard and makes it available under the
Containers folder.
To avoid a Datasource not found error, open the dashboard JSON file and
replace all ${DS_PROMETHEUS} variables:
1234"datasource": {"type": "prometheus","uid": "${DS_PROMETHEUS}"}
With a static uid that matches what you set up in your
grafana/provisioning/datasources/prometheus.yml file:
1234"datasource": {"type": "prometheus","uid": "prometheus"}
You can now launch the grafana service with:
1docker compose up grafana -d
Once the container is running, Grafana will be available at
http://localhost:3000.
Open the dashboard section in the web interface. You should now see container level CPU, memory, network, and filesystem metrics populated from the cAdvisor data stored in Prometheus.
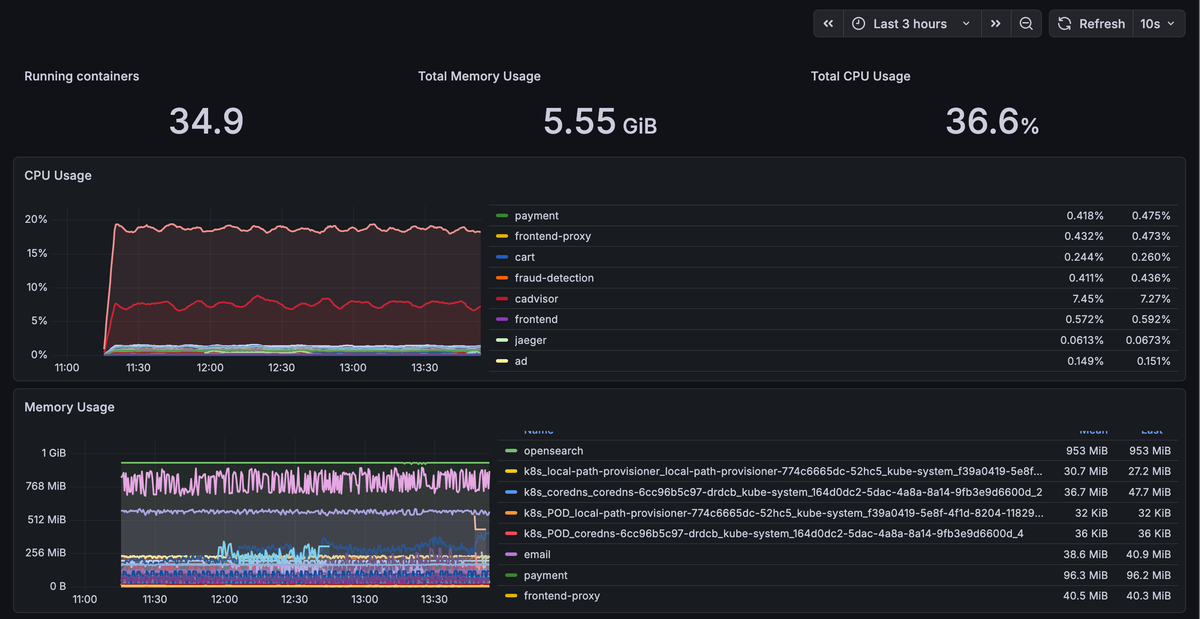
At this point you have a functioning container monitoring pipeline: cAdvisor collects resource metrics from every container on the host, Prometheus scrapes and stores those metrics as time series, and Grafana visualizes them through interactive dashboards.
Dashboards are useful for exploration, but production monitoring must also include alerting. Instead of waiting for someone to notice a problem on a graph, Prometheus can evaluate alert rules continuously and notify you when resource usage crosses defined thresholds.
Bringing cAdvisor metrics into an OpenTelemetry pipeline
The Prometheus and Grafana stack described above provides a solid starting point for container monitoring, but it addresses only one aspect of the broader observability problem.
Prometheus focuses exclusively on metrics, but your applications also produce traces and logs, and those signals often flow through entirely separate pipelines with different collectors, storage systems, and data models.
When a container suddenly consumes excessive memory, the metric itself rarely explains the root cause. To investigate further, you usually need to inspect application logs or traces, yet those signals live in different systems with no shared context. The result is a manual investigation process where you correlate timestamps across multiple tools.
This is the problem that OpenTelemetry was created to solve. OpenTelemetry provides a vendor neutral framework for instrumenting and collecting metrics, traces, and logs through a unified telemetry model and the OpenTelemetry Collector is the central component that ingests, processes, and exports those signals.
Instead of running Prometheus as a standalone metrics scraper, the Collector can ingest Prometheus metrics alongside application traces and logs, process all three signal types through a unified pipeline, and export them to any OTLP-compatible backend.
The trajectory of the ecosystem reflects this shift. Prometheus now supports native OTLP ingestion, and most observability backends accept OTLP as a primary ingestion protocol. Kubernetes is also closely aligned with OpenTelemetry through the OpenTelemetry Operator, which manages Collector deployments and can automatically instrument workloads.
What changes when cAdvisor metrics flow through the Collector
The Collector includes a
Prometheus receiver
that acts as a Prometheus compatible scraper. It accepts the same
scrape_configs syntax used by Prometheus, which makes the transition from a
standalone Prometheus setup straightforward.
When the receiver scrapes cAdvisor’s /metrics endpoint, each metric is
converted into the
OpenTelemetry data model.
From that point onward, container metrics become just another telemetry signal
flowing through the same pipeline as traces and logs.
A minimal Collector configuration for scraping cAdvisor and exporting metrics via OTLP might look like this:
12345678910111213141516171819# otelcol.yamlreceivers:prometheus:config:scrape_configs:- job_name: "cadvisor"scrape_interval: 10sstatic_configs:- targets: ["cadvisor:8080"]exporters:otlp:endpoint: "your-otlp-endpoint:4317"service:pipelines:metrics:receivers: [prometheus]exporters: [otlp]
This unlocks many capabilities that a standalone Prometheus scraper does not provide. For example, enriching each signal with consistent infrastructure metadata (Resources) ensures that they are inherently navigable instead if requiring manual investigation across multiple tools.
The Collector also provides pipeline level control over telemetry before it leaves your infrastructure. You can filter out unwanted metrics, drop high cardinality attributes, and apply safeguards such as memory limits to protect the pipeline.
And because the Collector operates on metrics, traces, and logs using the same configuration model, you'll only need to maintain a single telemetry collection layer instead of stitching together separate systems for each signal type.
How OpenTelemetry-native backends complete the picture
Routing cAdvisor metrics through the OpenTelemetry Collector brings metrics, traces, and logs into the same pipeline. But you'll only see the full benefit when the backend that stores and queries that telemetry is natively built upon the OpenTelemetry data model.
Many legacy platforms treat metrics, logs, and traces as separate "pillars". Even when those signals arrive through the same Collector, they're often converted from OTLP to a proprietary data model and stored in different databases. You gain a unified ingestion pipeline, but the analysis experience remains fragmented.
OpenTelemetry-native backends like Dash0 solve this by storing telemetry using the native OTLP model defined by OpenTelemetry itself. Metrics, traces, and logs retain the shared context that the instrumentation and Collector attaches to them, which makes cross-signal correlation a natural part of the investigation workflow.
For example, when a container's CPU usage spikes, the metric carries resource attributes that identify the host, container, and service producing the telemetry. In an OpenTelemetry-native system, those attributes become the bridge between signals. From that metric you can pivot directly to the traces and logs emitted by the same service during the same time window instantly.
This resource-centric approach is especially valuable for containerized environments. Container metrics from cAdvisor naturally align with application traces, service relationships, and infrastructure metadata, making it possible to move from a resource spike to the exact request path or log line responsible for it.
In practice, this means cAdvisor provides detailed container-level telemetry, the OpenTelemetry Collector unifies the ingestion and processing pipeline, and an OpenTelemetry-native backend turns that telemetry into a connected investigation workflow where metrics, logs, and traces reinforce each other instead of living in separate silos.
Final thoughts
cAdvisor remains one of the simplest and most effective ways to understand how containers consume system resources. With a single daemon, you'll gain visibility into the CPU usage, memory pressure, network throughput, and disk activity for every container running on a host.
For small environments, the Grafana dashboards and a few Prometheus alerts may be all you need. As your systems grow, however, you'll get way more value by integrating container metrics with the rest of your observability signals so that resource spikes, slow requests, and application errors can be investigated as a single story rather than separate events.
To see how container metrics, traces, and logs come together in a single OpenTelemetry-native workflow, sign up for a free Dash0 trial and start sending data today.
