Last updated: August 28, 2025
Contextual Logging Done Right in Node.js with AsyncLocalStorage
Chasing down issues in a production service by grepping through a sea of disconnected log lines is a nightmare.
Without a way to tie each log back to the request that produced it, you are left piecing things together manually, hoping you guess right. In the middle of a troubleshooting session, that is the last place you want to be.
The usual workaround is to manually pass a correlation ID through every function call, but that quickly turns into messy code that no one enjoys maintaining.
This article will show you the professional way forward. Using Express.js, Pino, and Node.js's modern AsyncLocalStorage API, we'll build a scalable solution you can confidently run in production.
Then we'll take it a step further with OpenTelemetry which automatically correlates your logs with traces across your entire infrastructure—not just within a single Node.js app.
Understanding the problem of missing context
As developers, we all know logs are critical for observing our applications. That's why we reach for tools like Pino for their speed and clean structured JSON output.
When something breaks, you want the logs to tell a clear story of what happened and why. That requires connecting the dots between log lines, so you can see how an error relates to the request that triggered it.
Let's start with a first attempt by creating a middleware that generates a
request.id, builds a child logger with that ID, and logs the start and end of
each request:
123456789101112131415161718192021222324252627282930313233343536373839404142434445464748495051525354555657585960616263646566676869707172737475767778798081828384// app.jsimport { randomUUID } from "node:crypto";import { performance } from "node:perf_hooks";import express from "express";import pino from "pino";const logger = pino();const app = express();app.use(express.json());app.use((req, res, next) => {const start = performance.now();const requestId = req.headers["x-request-id"] || randomUUID();const { method, url, ip, headers } = req;const userAgent = headers["user-agent"];const reqLogger = logger.child({"request.id": requestId,});reqLogger.info({"http.request.method": method,"url.path": url,"client.address": ip,"user_agent.original": userAgent,},`incoming ${method} request to ${url}`,);res.on("finish", () => {const { statusCode } = res;const logData = {duration_ms: performance.now() - start,status_code: statusCode,};if (statusCode >= 500) {reqLogger.error(logData, "server error");} else if (statusCode >= 400) {reqLogger.warn(logData, "client error");} else {reqLogger.info(logData, "request completed");}});next();});async function fetchUser(id) {const response = await fetch(`https://jsonplaceholder.typicode.com/users/${id}`,);if (!response.ok) {throw new Error(`Failed to fetch user: ${response.status} ${response.statusText}`,);}const user = await response.json();logger.info(`profile info for user ${user.id} retrieved successfully`);return user;}app.get("/fetch-user", async (req, res) => {const userID = Math.floor(Math.random() * 10) + 1;logger.info("fetching user data");const user = await fetchUser(userID);res.json(user);});app.listen(3000, () => {logger.info("Server listening on port 3000");});
Fire up the server and hit the /fetch-user endpoint. The logs roll in, and at
first glance, they look decent with a JSON-formatted structure:
1234{...,"request.id":"e96b0e3d-4812-4358-8bd1-f0f907156a45","http.request.method":"GET","url.path":"/fetch-user","client.address":"::1","user_agent.original":"curl/8.7.1","msg":"incoming GET request to /fetch-user"}{...,"msg":"fetching user data"}{...,"msg":"profile info for user 3 retrieved successfully"}{...,"request.id":"e96b0e3d-4812-4358-8bd1-f0f907156a45","duration_ms":3.5279169999998885,"status_code":200,"msg":"request completed"}
But then you look closer. Logs from inside the business logic have no
request.id. They are floating around without context, disconnected from the
request they came from. In a busy production environment, these orphaned logs
are useless for debugging.
A common fix is to attach the contextual logger directly to the request object. This way, your route handlers can log with the right context:
123456789101112131415161718192021app.use((req, res, next) => {[...]const reqLogger = logger.child({"request.id": requestId,});req.log = reqLogger;[...]});app.get("/fetch-user", async (req, res) => {const userID = Math.floor(Math.random() * 10) + 1;req.log.info("fetching user data");const user = await fetchUser(userID);res.json(user);});
And it works, but only at the top level. As soon as you call into another
function, the context is lost. To keep it alive, you would need to pass req or
req.log into every function down the call stack.
This is parameter drilling, and it's an architectural trap. It pollutes function signatures with parameters that have nothing to do with their core logic and tightly couples every part of your application to Express's request object.
So, how then can you make this contextual logger available everywhere, from the highest-level route handler to the deepest nested function, without passing it around like a hot potato?
Understanding the root of the problem
The question of how to maintain request context without endlessly passing it around cuts to the core of how Node.js works, and why it behaves differently from many other server environments.
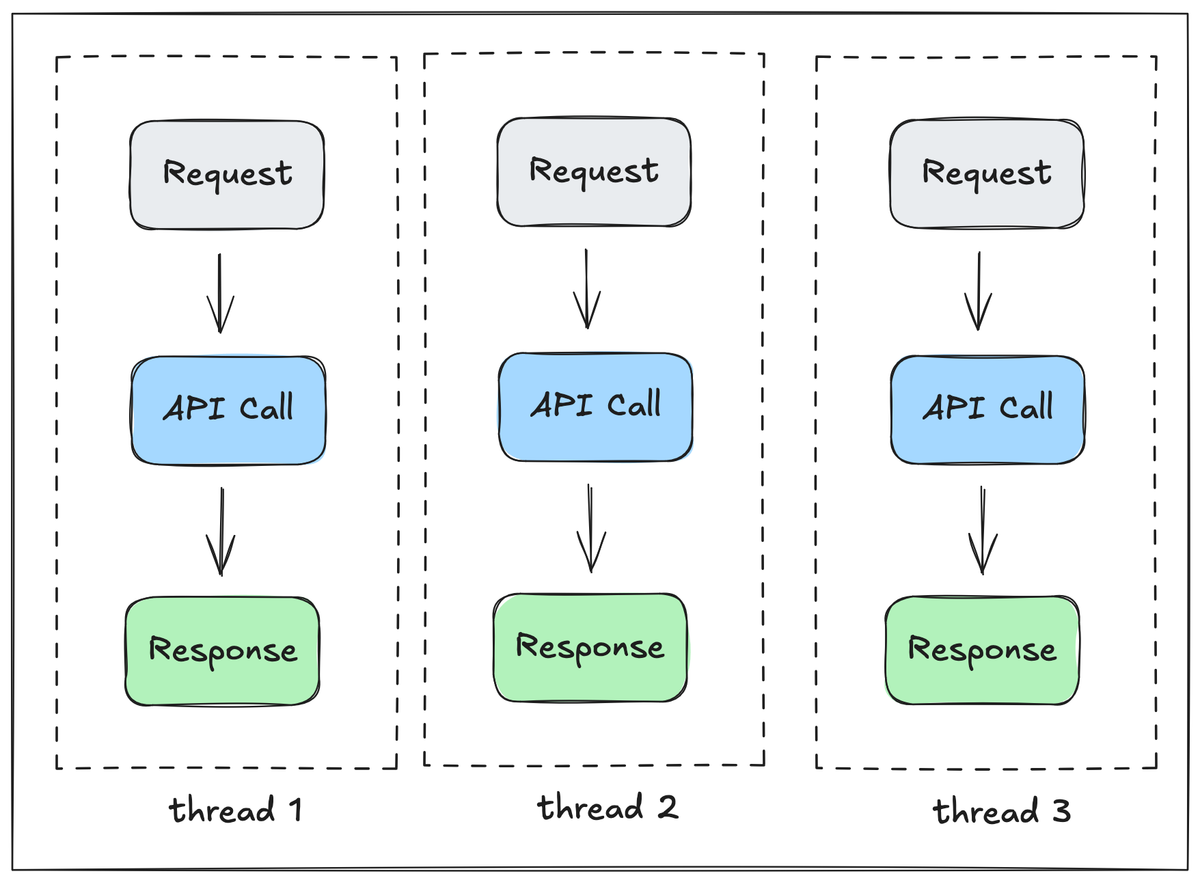
In traditional thread-per-request systems, each incoming request is handled by its own operating system thread. Request-specific data can then be stored in Thread-Local Storage (TLS) which guarantees that context from one request never leaks into another.
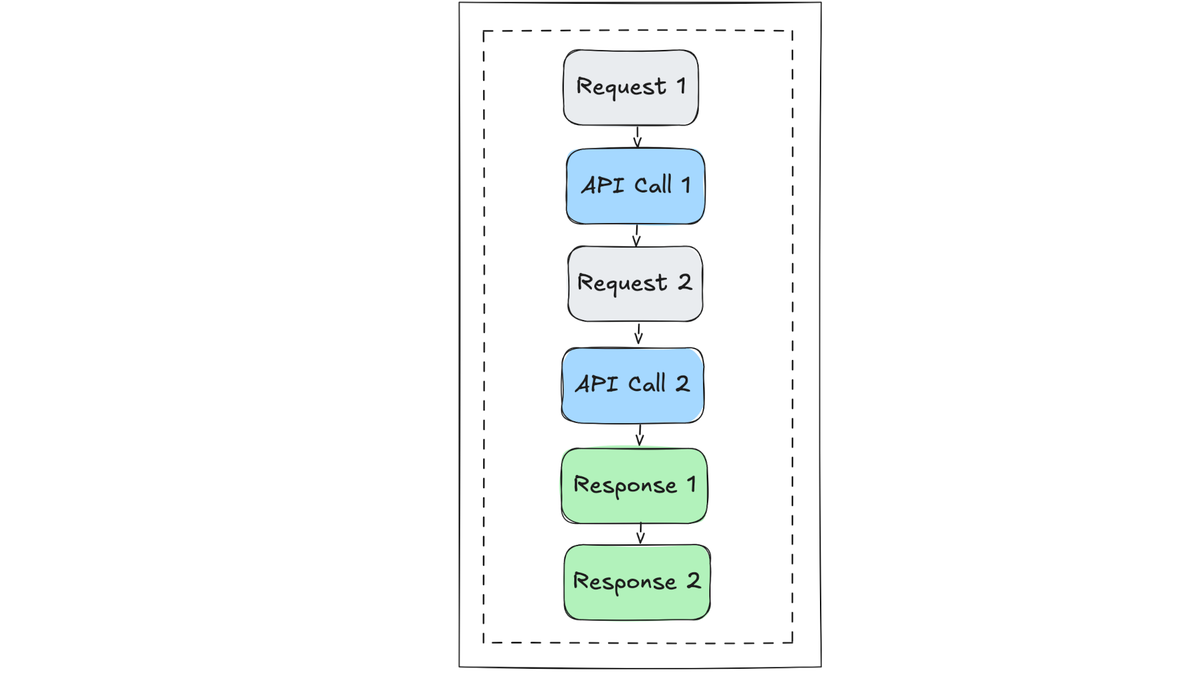
Node.js, on the other hand, takes a very different approach. It runs on a single-threaded event loop, where all requests share the same thread. When an asynchronous I/O operation starts, the runtime hands it off to the operating system and immediately moves on to other work. When that async operation finishes, its callback is pushed back onto the event loop's queue to be executed.
This design is powerful for scalability, but it introduces a subtle problem. In
our earlier example, the route handler produced orphaned logs because it only
had access to the global logger.
On a live server, while one request is waiting for fetchUser() to return, the
event loop is already handling other requests. A global context is useless here,
because it would be constantly overwritten by the next request in line.
Attaching the logger to the request object seems like a fix, but it only kicks the problem down the road. Once you leave the route handler, that context disappears unless you explicitly pass it into every downstream function, which leads straight to parameter drilling and all the downsides we covered earlier.
This is exactly the problem AsyncLocalStorage was designed to solve. You can
think of it as the Node.js counterpart to Thread-Local Storage, but built for an
asynchronous, event-driven world.
It lets you create a store that persists across an entire chain of asynchronous operations, following the logical flow of a request even as execution hops around the event loop.
The result is a stable, isolated context for each request inside a single-threaded environment. And with that foundation, we can finally build a contextual logger that is easily accessible anywhere in the call stack.
Let's see this in action creating a context-injecting middleware with
AsyncLocalStorage.
The solution is a context-injecting middleware
In this section, we'll use AsyncLocalStorage to create a context that sticks
with a request for its entire asynchronous journey, without ever colliding with
other requests running at the same time.
Let's refactor app.js to implement this pattern:
123456789101112131415161718192021import { AsyncLocalStorage } from "node:async_hooks";const asyncLocalStorage = new AsyncLocalStorage();app.use((req, res, next) => {. . .const store = new Map();asyncLocalStorage.run(store, () => {// Store the contextual logger in the async local storageasyncLocalStorage.getStore().set("logger", reqLogger);next();});});function getLogger() {// If we are in a request context, return the contextual logger, otherwise the base loggerreturn asyncLocalStorage.getStore()?.get("logger") || logger;}
By wrapping next() inside asyncLocalStorage.run(), you're creating a
contextual "bubble" that persists for the entire lifecycle of that request,
including through all the asynchronous await calls.
Inside this bubble, we stash the request-specific logger. Later, any part of the
code can call getLogger() to retrieve the right logger for the current
request.
This means route handlers and utility functions no longer need to care about
req.log or request.id. They simply ask for a logger, and asyncLocalStorage
takes care of returning the correct one.
Here's what it looks like in practice:
123456789101112131415161718192021222324252627async function fetchUser(id) {const response = await fetch(`https://jsonplaceholder.typicode.com/users/${id}`,);if (!response.ok) {throw new Error(`Failed to fetch user: ${response.status} ${response.statusText}`,);}const user = await response.json();getLogger().info(`profile info for user ${id} retrieved successfully`);return user;}app.get("/fetch-user", async (req, res) => {const userID = Math.floor(Math.random() * 10) + 1;getLogger().info("fetching user data");const user = await fetchUser(userID);res.json(user);});
Notice that neither the route handler nor fetchUser() knows anything about how
the logger is wired up. They just call getLogger() and get the correct
contextual logger automatically.
Now, when you run the server and hit the endpoint, every log line is tagged with
the same request.id, giving you a clear, filterable story of the request from
start to finish:
1234{...,"request.id":"e96b0e3d-4812-4358-8bd1-f0f907156a45","http.request.method":"GET","url.path":"/fetch-user","client.address":"::1","user_agent.original":"curl/8.7.1","msg":"incoming GET request to /fetch-user"}{...,"request.id":"e96b0e3d-4812-4358-8bd1-f0f907156a45","msg":"fetching user data"}{...,"request.id":"e96b0e3d-4812-4358-8bd1-f0f907156a45","msg":"profile info for user 3 retrieved successfully"}{...,"request.id":"e96b0e3d-4812-4358-8bd1-f0f907156a45","duration_ms":3.5279169999998885,"status_code":200,"msg":"request completed"}
Going further with a composable context helper
As your application grows, you'll want to add more context than just a
request.id to your logs. You may want to include user information, feature
flags, or trace data from other services. Manually retrieving, updating, and
replacing the logger in each middleware quickly becomes repetitive and
error-prone.
A cleaner approach is to introduce a reusable helper that composes context. This helper takes care of creating enriched child loggers and running code inside the right context, so you do not have to repeat that logic everywhere.
Let's call it withLogContext():
12345678910111213141516function withLogContext(data, callback) {const store = asyncLocalStorage.getStore();// Get the logger from the current context, or fall back to the base loggerconst parentLogger = store?.get("logger") || logger;// Create a new child logger with the new dataconst childLogger = parentLogger.child(data);// Create a new store that inherits from the parent contextconst newStore = new Map(store);// Replace the logger with our new, more specific child loggernewStore.set("logger", childLogger);// Run the callback within the new, enriched contextreturn asyncLocalStorage.run(newStore, callback);}
This helper is a thin but powerful wrapper around asyncLocalStorage.run(), and
it works whether you are creating the initial request context or layering in
more information later.
With the helper in place, the request logging middleware becomes much simpler:
12345app.use((req, res, next) => {// ... request logging logic remains the samewithLogContext({ "request.id": requestId }, next);});
The beauty of this pattern is how easily it scales. Each time you need more
context, you just wrap the next step of your application logic in a
withLogContext() call. That creates a progressively richer logger that's
automatically available to all downstream functions.
For example, adding the user.id attribute to all logs in the /fetch-user
route becomes trivial:
1234567891011app.get("/fetch-user", (req, res) => {const userID = Math.floor(Math.random() * 10) + 1;withLogContext({ "user.id": userID }, async () => {getLogger().info("fetching user data");const user = await fetchUser(userID);res.json(user);});});
The final log output for an authenticated request now contains all the composed context:
1234{...,"request.id":"d48ed676-ecd3-4a4b-8514-f494bcaa1ad2","http.request.method":"GET","url.path":"/fetch-user","client.address":"::1","user_agent.original":"curl/8.7.1","msg":"incoming GET request to /fetch-user"}{...,"request.id":"d48ed676-ecd3-4a4b-8514-f494bcaa1ad2","user.id":7,"msg":"fetching user data"}{...,"request.id":"d48ed676-ecd3-4a4b-8514-f494bcaa1ad2","user.id":7,"msg":"profile info for user 7 retrieved successfully"}{...,"request.id":"d48ed676-ecd3-4a4b-8514-f494bcaa1ad2","duration_ms":3.618416000000252,"status_code":200,"msg":"request completed"
Now your logs are not only consistent across requests, they are also enriched with the context that matters most to support the observability of your systems.
Enhanced contextual logging with OpenTelemetry
OpenTelemetry takes the principles of contextual logging that we've just established and elevates them into a standardized, vendor-agnostic observability framework that also encapsulates distributed tracing and metrics.
Instead of relying on a simple request ID, OpenTelemetry provides richer,
standardized identifiers such as trace_id and span_id. These make it
possible to follow a request not only within a single service but across
multiple services in a distributed system.
Under the hood, the OpenTelemetry SDK for Node.js also uses AsyncLocalStorage
to manage context on a per-request basis.
The goal here is to automatically add the active trace context to every log message generated during a request so that all your logs are born correlated with the trace itself.
That means when you are investigating an issue, you can jump seamlessly between logs and distributed traces, seeing not just what happened inside your service but how it fit into the larger journey across your entire system.
The beauty of OpenTelemetry is that you can use its zero-code instrumentation to automatically enable tracing and inject the trace context per-request into all relevant logs.
You only need to install the necessary packages first:
12npm install @opentelemetry/api \@opentelemetry/auto-instrumentations-node
When you start your app, require the auto-instrumentations register script:
1OTEL_SERVICE_NAME=mynodeapp node --require @opentelemetry/auto-instrumentations-node/register app.js
This initializes the OpenTelemetry Node.js SDK and automatically enables instrumentation for popular libraries, including Express and Pino.
Once enabled, your logs will be enriched with the active trace context:
123456789{[...],"trace_id": "6c01f40ea85a45fa34ecafe102e56b3c","span_id": "5239529039006e9c","trace_flags": "01","request.id": "00f2de3e-62b2-4296-979f-208151f5ccd2","user.id": 10,"msg": "fetching user data"}
At this point, the request.id is no longer necessary. Instead, OpenTelemetry's
trace identifiers give you consistent, standardized context across services.
Meanwhile, your withLogContext() helper remains useful for attaching
domain-specific attributes or feature flags.
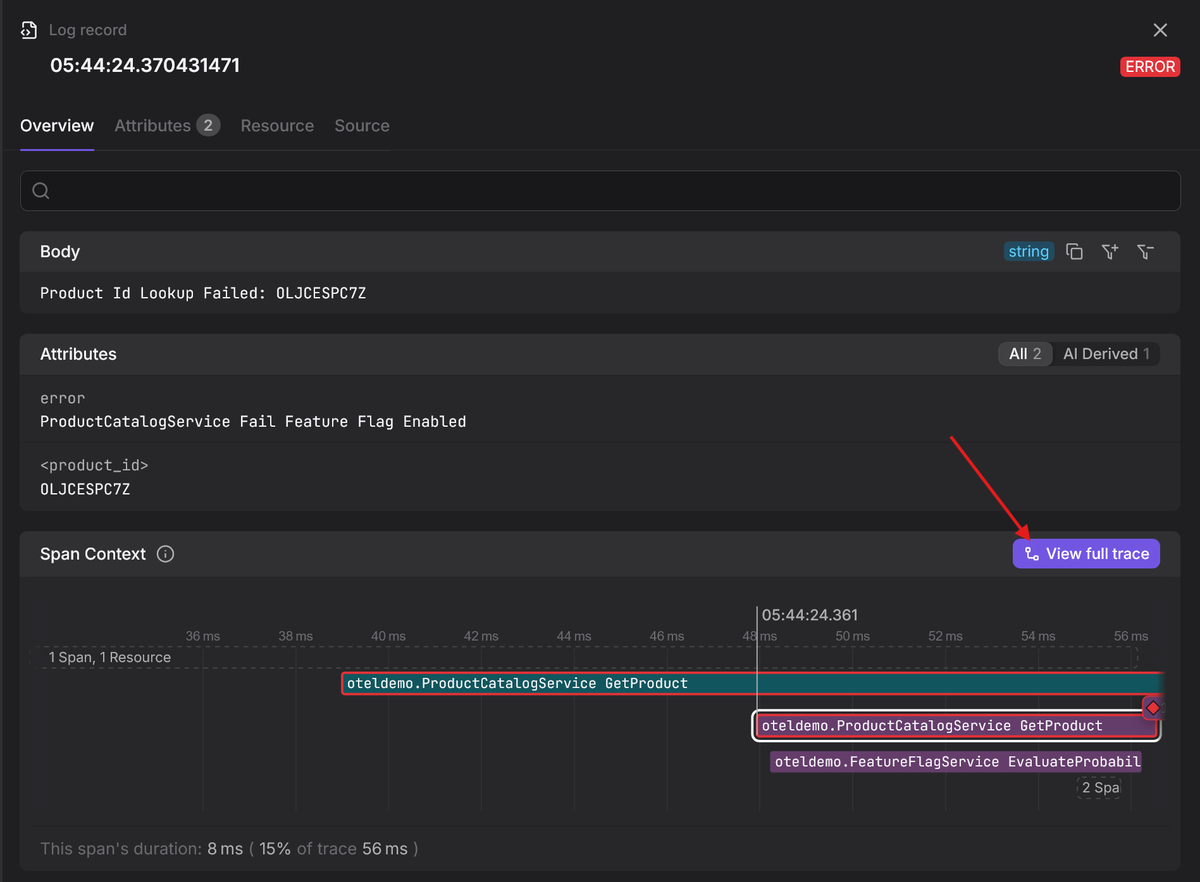
Now, when you send your logs (and spans) to an OpenTelemetry-native platform (like Dash0), you will see them automatically correlated. This lets you pivot from a single log line to the full distributed trace to understand not just what failed, but why it failed across the entire request path.
For a deeper dive, our guide on integrating Pino with OpenTelemetry.
Final thoughts
We started with a frustrating reality where orphaned log lines make debugging a guessing game, especially in Node.js where concurrent requests are all interleaved on a single event loop.
The first step forward was to use AsyncLocalStorage to create a stable,
request-scoped context. This gave us a foundation for contextual logging that
survives asynchronous boundaries without resorting to messy parameter drilling.
From there, we refined the pattern with a composable helper, withLogContext().
This made it simple to enrich logs with additional attributes without repeating
boilerplate.
Finally, we saw how OpenTelemetry takes this pattern to the next level. By adopting standardized trace identifiers, your logs are no longer tied only to a single Node.js service.
Instead, they connect seamlessly to distributed traces across your entire system, giving you end-to-end visibility in any OpenTelemetry-native observability platform.
The result is a logging setup that is not just functional, but scalable, and aligned with industry standards. With this pattern in place, your logs stop being noise and start becoming a reliable window into how your system really behaves.
Thanks for reading!
