Last updated: June 13, 2026
Mastering Docker Logs: A Comprehensive Tutorial
You've just deployed a new feature. It's not on fire, but it's not quite right either. An API response is missing a field, and performance seems a bit off. Where do you begin to unravel the mystery? You start with the logs.
In a containerized environment, however, logging isn't always straightforward. Logs are ephemeral, dispersed across multiple containers, and can grow unmanageable without the right strategy.
This guide covers everything you need to know about Docker logs. We'll start with the simplest commands to view logs in real-time and progress to designing a robust, production-grade logging strategy for your entire containerized infrastructure.
Let's get started!
Quick start: the docker logs command reference
For when you need answers now, here are the most common commands you'll reach for often:
| Action | Command |
|---|---|
| View all logs for a container | docker logs <container> |
| Follow logs in real-time (tail) | docker logs -f <container> |
| Tail the last 100 lines | docker logs --tail 100 <container> |
| View logs from the last 15 minutes | docker logs --since 15m <container> |
| Filter logs with grep | docker logs <container> | grep <filter> |
| View logs for a Docker Compose service | docker compose logs <service> |
| Follow logs for all Compose services | docker compose logs -f |
| Remove the service prefix in Docker Compose logs | docker compose logs --no-log-prefix <service> |
Understanding how Docker logging works
Docker is designed to capture the standard output (stdout) and standard
error (stderr) streams from the main process running inside a container.
This means that if you are containerizing your own services, you should ensure
that they're writing their logs to stdout or stderr so that Docker’s
built-in logging system can capture them.
A logging driver acts as the backend for these logs. It receives the log streams from the container and determines whether to store them in a file or forward them to an endpoint.
Where Docker stores container logs
By default, Docker uses the json-file logging driver to write the captured container logs to a file on the host machine.
Here's the typical Docker logs location for a container:
1/var/lib/docker/containers/<container-id>/<container-id>-json.log
You can find the log file path for a specific container with this command:
1docker inspect -f '{{.LogPath}}' <container_name_or_id>
This outputs:
1/var/lib/docker/containers/612646b55e41d73a3f1a24afa736ef173981ed753506097d1a888e7b9cb7d6ac/612646b55e41d73a3f1a24afa736ef173981ed753506097d1a888e7b9cb7d6ac-json.log
In most cases, you won't need to interact with these log files directly as it's
what docker logs reads from behind the scenes.
If you're unsure of what logging driver a container uses, you can confirm with:
1docker inspect -f '{{.HostConfig.LogConfig.Type}}' <container_name_or_id>
Viewing container logs with the docker logs command
The docker logs command is the primary way to inspect the logs of a running or
stopped container. It is a shorthand for the full docker container logs
command and can be used interchangeably.
Here's the built-in usage reference for quick context:
1234567891011121314Usage: docker logs [OPTIONS] CONTAINERFetch the logs of a containerAliases:docker container logs, docker logsOptions:--details Show extra details provided to logs-f, --follow Follow log output--since string Show logs since timestamp (e.g. "2013-01-02T13:23:37Z") or relative (e.g. "42m" for 42 minutes)-n, --tail string Number of lines to show from the end of the logs (default "all")-t, --timestamps Show timestamps--until string Show logs before a timestamp (e.g. "2013-01-02T13:23:37Z") or relative (e.g. "42m" for 42 minutes)
To view all available logs for a container, simply pass its name or ID:
1docker logs <container_name_or_id>
This dumps the entire log history of the specified container to your terminal, which is probably not what you're after.
For a container that's been running for a while, or one that's particularly noisy, this can mean scrolling through thousands of lines of output.
To isolate the specific information you need, you can use Docker's built-in filtering flags to narrow the output by time or by the number of lines.
Let's explore the most useful options next. Note that all options must come before the container name or ID:
1docker logs [<options>] <container_name_or_id>
Note: If docker logs isn't showing anything, you may be hitting one of the
common pitfalls. See the
troubleshooting section
to learn how to fix it.
Filtering logs by time (--since and --until)
To constrain docker logs output to a specific time window, you can use a
combination of the following options:
--since: Shows logs generated after a specified point in time.--until: Shows logs generated before a specified point in time.
With either flag, you can provide a relative time (like 10m for 10 minutes,
3h for 3 hours) or an absolute timestamp (such as 2025-06-13T10:30:00).
12# Show logs from the last 30 minutesdocker logs --since 30m <container_name_or_id>
12# Show logs from this morning, before 10 AMdocker logs --until 2025-06-13T10:00:00 <container_name_or_id>
You can also combine the two:
1docker logs --since 2025-06-13T18:00:00 --until 2025-06-13T18:15:00 <container_name_or_id>
Following and tailing Docker container logs
While filtering logs by time helps you understand historical events, the most common task while troubleshooting is to see what's happening right now.
This means continuously monitoring and displaying the end of a log file in real-time as new entries are added.
To follow Docker container logs, use the -f or --follow flag:
1docker logs -f <container_name_or_id>
However, this will print the container's entire log history before it starts streaming new entries, which isn't ideal.
The most effective pattern is to combine --follow with --tail (or its
shorthand -n). This gives you the best of both worlds: a small amount of
recent history for context, followed by the live stream:
1docker logs -f --tail 100 <container_name_or_id>
Here, only the last 100 lines are displayed for context, and then new log
messages stream in real time. When you want to stop streaming, press Ctrl+C.
Filtering Docker logs with grep
The docker logs command doesn't have a built-in grepping feature, but you can
easily pipe its output to standard shell utilities like grep to quickly search
for a specific string:
1docker logs <container_name_or_id> | grep -i "ERROR"
This helps you filter out noise and return only the log lines that match your search term.
Saving Docker logs to a file
If you need to store a subset of your logs for later analysis, you can redirect
the output of docker logs to a file:
12docker logs <container_name_or_id> > app.log # overwritedocker logs <container_name_or_id> >> app.log # append
You can also combine this with filters:
1docker logs --since 10m <container_name_or_id> > recent.log
This is the simplest way to capture Docker logs to a file without changing any logging configuration.
Managing logs in Docker Compose
Most Docker projects use Docker Compose, and managing logs there is just as
straightforward. The main difference is that you use docker compose logs
rather than docker logs.
The usage syntax is:
1docker compose logs [options] [service...]
Where [service...] is an optional list of service names. Since a single
service may be running across multiple containers, Docker Compose automatically
aggregates the logs from all containers that belong to that service.
Let's look at a few common usage patterns.
Viewing logs for a single service
To see logs from just one service defined in your Compose file, specify the service name:
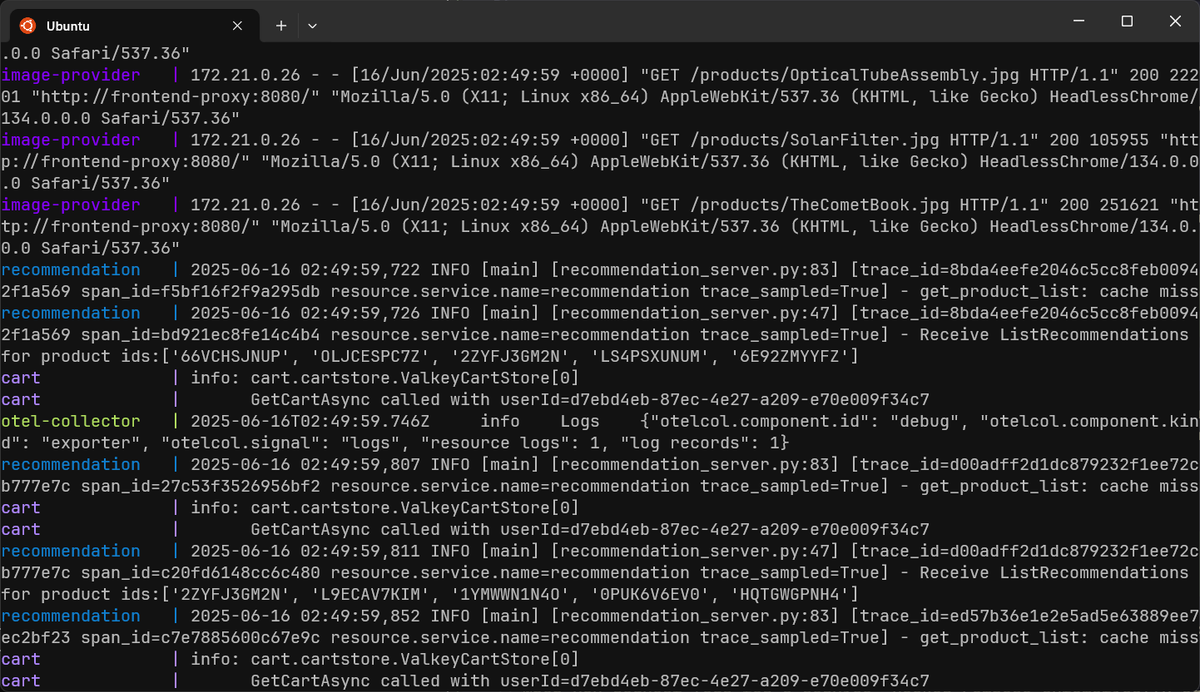
1docker compose logs image-provider
You can also specify multiple service names:
1docker compose logs image-provider shipping otel-collector
Docker Compose will color-code the output by service, making it easy to follow:
For ease of copying and pasting log lines, you'll want to include the
--no-log-prefix flag:
1docker compose logs --no-log-prefix <services>
Viewing logs for all services
To see an interleaved stream of logs from all services in your stack, run the command without a service name:
1docker compose logs
Tailing and filtering
All the flags you learned for docker logs for tailing and filtering work with
docker compose logs too:
1docker compose logs --follow --tail 10 image-provider cart
1docker compose logs --since '10m' db
Inspecting Docker container logs with a GUI
If you would rather inspect container logs visually, using a Docker log viewer can make it much easier to browse, filter, and search container logs without relying on the command line.
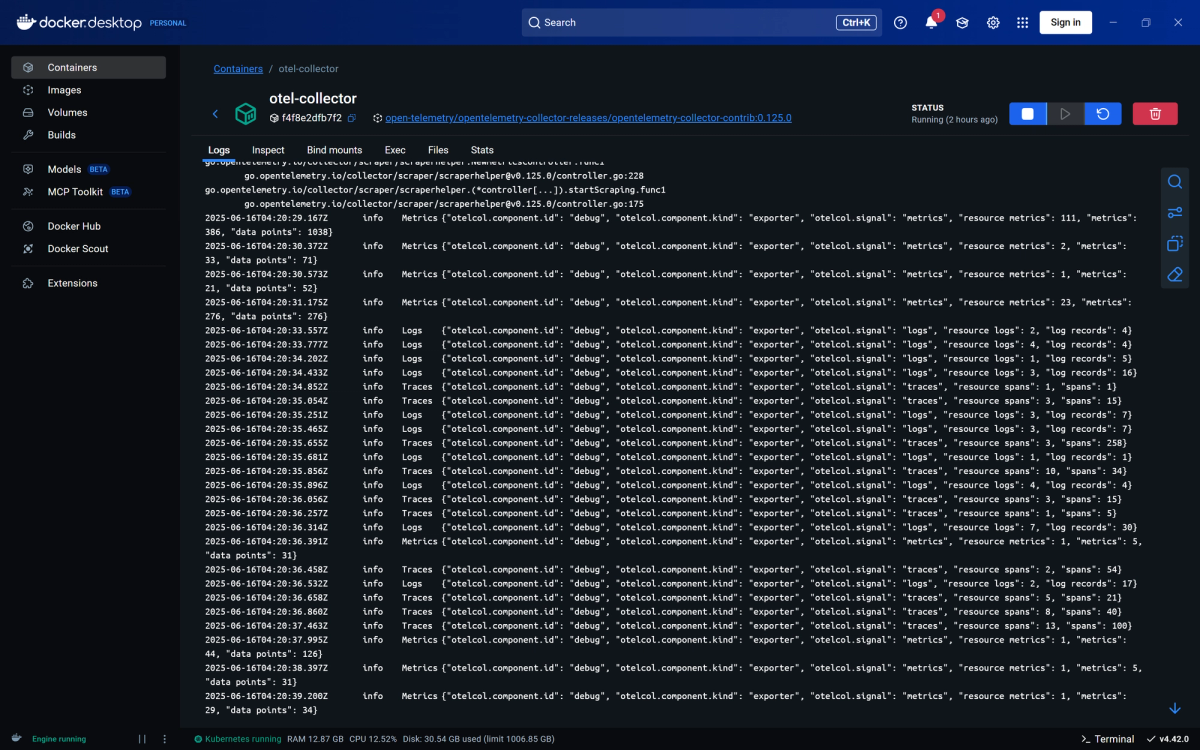
1. Docker Desktop logs
The built-in dashboard in Docker Desktop has a Logs tab for any running container. It provides a simple, real-time view with basic search functionality.
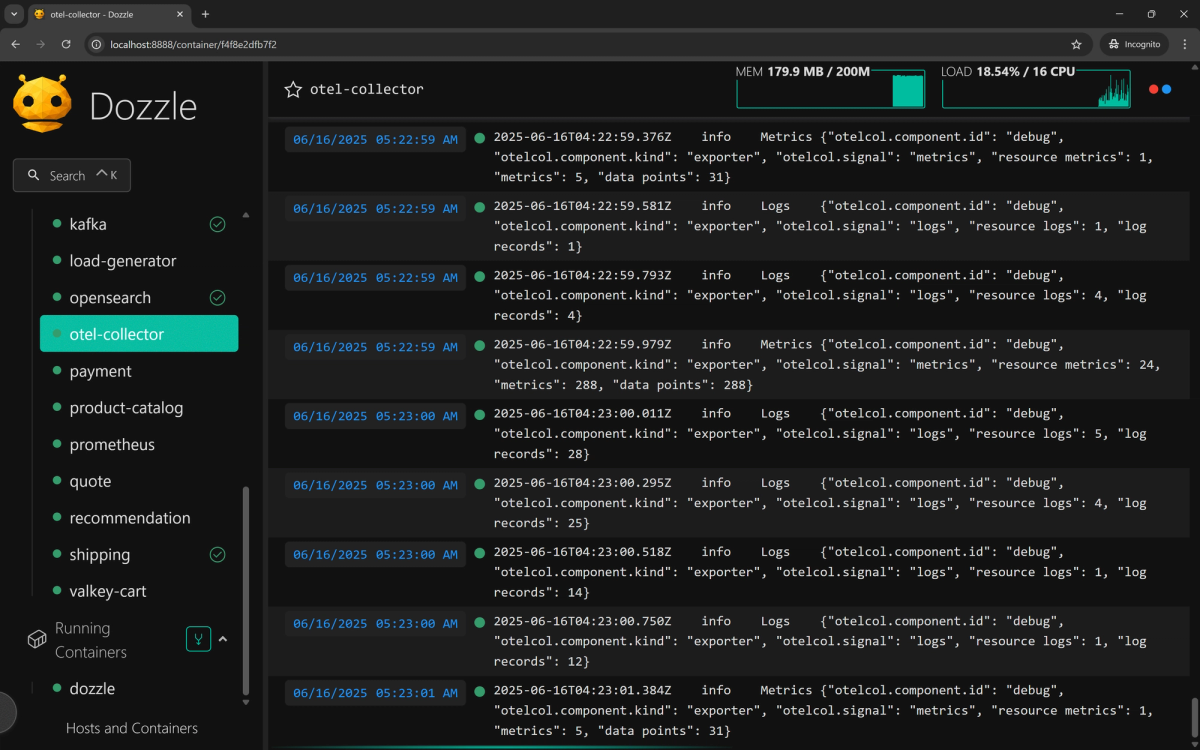
2. Dozzle
Dozzle is a lightweight, web-based log viewer with a slick interface. It's incredibly easy to run as a Docker container itself:
1234docker run -d --name dozzle \-p 8888:8080 \--volume /var/run/docker.sock:/var/run/docker.sock \amir20/dozzle:latest
Navigate to http://localhost:8888 in your browser to get a real-time view of
all your container logs.
Choosing a Docker logging driver
While json-file is the default, Docker supports a variety of other
logging drivers
to suit different needs:
-
none: Disables logging entirely which is useful when logs are unnecessary or handled externally. -
local: Recommended for most use cases. It offers better performance and more efficient disk usage thanjson-file. -
syslog: Sends logs to the system'ssyslogdaemon. -
journald: Write log output to thejournaldlogging system. -
fluentd,gelf,awslogs,gcplogs, etc.: Forward logs to external logging services or cloud platforms for centralized aggregation and analysis.
Setting a global logging driver
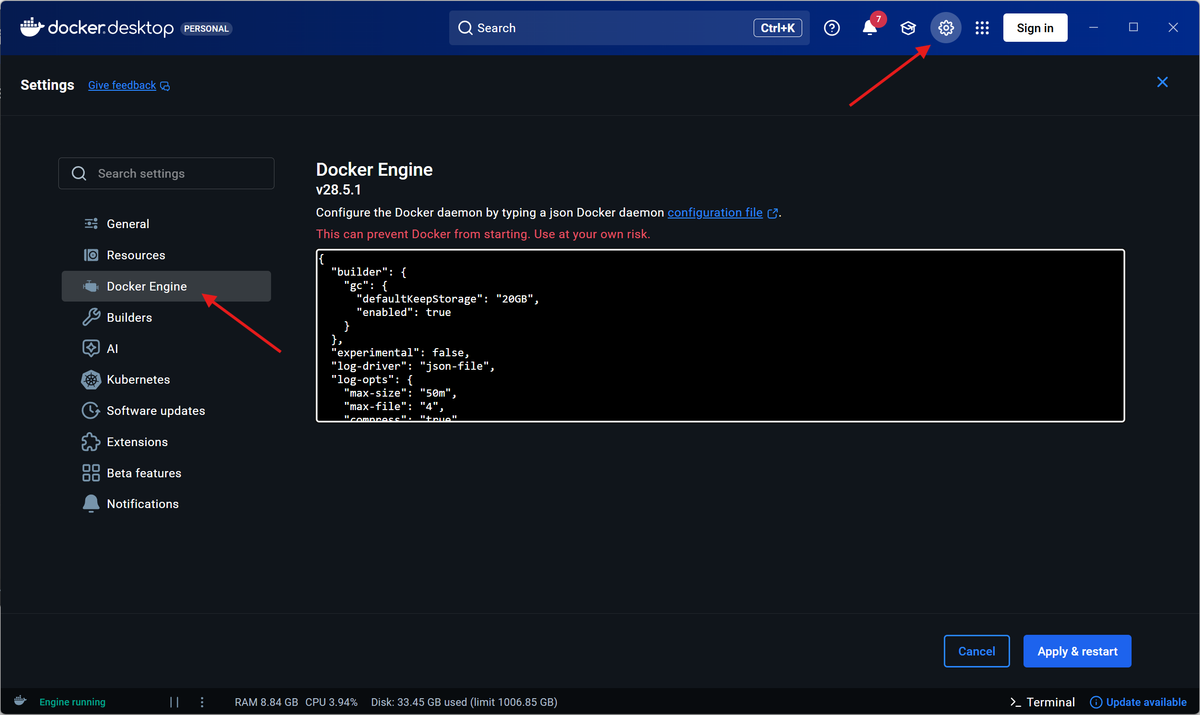
To set a global logging driver for all Docker containers, you must edit the
Docker daemon configuration file at /etc/docker/daemon.json. If the file
doesn't exist, create it first:
12345678{"log-driver": "json-file","log-opts": {"max-size": "50m","max-file": "4","compress": "true"}}
If you're using Docker Desktop, you can edit this file by opening the app’s Settings and selecting Docker Engine from the sidebar:
The json-file driver's most significant drawback is that it does not rotate
logs by default. Over time, these log files will grow indefinitely, which can
consume all available disk space and crash your server.
This configuration addresses this by telling Docker to:
- Rotate log files when they reach 50MB (
max-size). - Keep a maximum of four old log files (
max-file). - Compress the rotated log files to save space (
compress).
An alternative approach is using the local driver since it uses a more compact file format and includes log rotation out of the box:
123{"log-driver": "local"}
In production environments, where container logs must be shipped to an external observability platform, you can choose from other available logging drivers.
For example, this section below
demonstrates how to bring Docker logs into an
OpenTelemetry pipeline
through the fluentd driver.
Once you've edited your daemon.json file, you must restart the Docker daemon
for the changes to take effect for newly created containers. Existing
containers need to be recreated to adopt the updated configuration.
1sudo systemctl restart docker
Overriding the logging driver per container
You can override the global logging driver for individual containers when launching them. This is useful for containers that need different retention or delivery behavior:
12345docker run \--log-driver=local \--log-opt max-size=50m \--log-opt max-file=4 \<image_name>
If you're using Docker Compose, you can configure the logging driver in your
docker-compose.yml file:
123456789# docker-compose.yml<service_name>:image: <image_name>logging:driver: "local"options:max-file: "4"max-size: "50m"compress: "true"
To avoid repeating the same configuration across multiple services, define a YAML anchor and reuse it like this:
12345678910111213# docker-compose.ymlx-default-logging: &loggingdriver: "local"options:max-size: "50m"max-file: "4"services:<service_a>:logging: *logging<service_b>:logging: *logging
Understanding Docker's log delivery mode
When your application generates a log, it faces a fundamental choice: should it pause to ensure the log is safely delivered, or should it hand the log off quickly and continue its work?
This is the core trade-off managed by Docker's log delivery mode, a crucial setting that lets you tune your logging for either maximum reliability or maximum performance.
Docker supports two modes for delivering logs from your container to the configured logging driver.
1. Blocking mode
In the default blocking mode, log delivery is synchronous. When your application emits a log, it must wait for the Docker logging driver to process and accept that message before it can continue executing.
This approach is best for scenarios where every log message is critical and you
are using a fast, local logging driver like local or json-file.
With slower drivers (those that send logs over a network), blocking mode can introduce significant latency and even stall your application if the remote logging service is slow or unreachable.
2. Non-blocking mode
As an alternative, you can configure a non-blocking delivery mode. In this mode, log delivery is asynchronous. When your application emits a log, the message is immediately placed in an in-memory buffer, and your application continues running without any delay. The logs are then sent to the driver from this buffer in the background.
The trade-off for this mode is a risk of losing logs. If the in-memory buffer fills up faster than the driver can process logs, new incoming messages will be dropped.
To mitigate the risk of losing logs in non-blocking mode, you can increase the size of the in-memory buffer from its 1MB default:
1234567{"log-driver": "awslogs","log-opts": {"mode": "non-blocking","max-buffer-size": "50m"}}
Centralizing Docker logs with OpenTelemetry
While local tools work well during development, production systems need a unified logging pipeline that keeps container logs available even after the container is gone.
The OpenTelemetry Collector supports a few different approaches to ingesting Docker logs, and the right choice depends on how your containers are configured. You might reach for the filelog receiver to scrape container log files directly, but that's rarely the best fit for Docker environments.
Our dedicated guide on
collecting Docker container logs with OpenTelemetry
walks through the recommended approach in detail: using Docker's built-in
fluentd logging driver to stream logs directly to the Collector's
fluentforward receiver,
along with the full configuration you need to get logs flowing into an
observability backend like Dash0.
Troubleshooting common issues with Docker container logs
Docker logging is generally straightforward, but a few recurring issues can still cause confusion. Here’s how to recognize them and resolve them quickly.
1. docker logs shows no output
What's happening: Your application likely isn't writing to stdout or
stderr. It might be logging directly to a file inside the container instead.
Since Docker's logging drivers only capture standard output streams, it won't
pick up logs written to internal files.
How to fix it: Ideally, update your application's logging configuration to
write directly to stdout or stderr. If modifying the application isn't
feasible, you can redirect file-based logs by creating symbolic links to the
appropriate output streams in your Dockerfile.
123# Example for an Nginx imageRUN ln -sf /dev/stdout /var/log/nginx/access.log && \ln -sf /dev/stderr /var/log/nginx/error.log
This ensures that even file-based logs are routed through Docker's logging mechanism.
2. Logging driver does not support reading
1Error response from daemon: configured logging driver does not support reading
What's happening: Remote logging drivers such as awslogs, splunk, or
gelf forward logs directly to an external system without storing anything
locally. Normally, Docker caches the logs using its
dual logging
functionality. However, if this feature is disabled for the container, the
docker logs command can't retrieve any output.
How to fix it: You need to ensure cache-disabled is false in the logging
options. This tells Docker to send logs to the remote driver and keep a local
copy for docker logs to use.
123456{"log-driver": "awslogs","log-opts": {"cache-disabled": "false"}}
Some best practices for Docker container logging
Effective logging in a containerized environment is about more than running
docker logs. The following best practices help you keep logs reliable,
searchable, and production-ready.
1. Write application logs to stdout and stderr
Docker only captures what your application writes to stdout and stderr.
Avoid writing logs directly to files inside the container unless you redirect
them to these streams.
2. Use non-blocking mode for network-based logging drivers
Drivers that send logs over the network (such as fluentd, gelf, or
awslogs) can back-pressure the application in blocking mode. It's usually
better to enable non-blocking mode and tune max-buffer-size to avoid losing
logs during spikes.
3. Include container metadata in logs
Metadata such as container name, ID, service name, and image version are crucial for troubleshooting containerized workloads in production. In an OpenTelemetry pipeline, such metadata belongs in the resource attributes, so that it travels with every log record.
4. Use the local or json-file driver with log rotation
If you rely on host-level log storage (via local or json-file), always
enable rotation through the max-file and max-size options. Unrotated log
files are a common cause of disk pressure on production nodes.
Final thoughts
You've now journeyed from the basic docker logs command to understanding the
critical importance of logging drivers, log rotation, and centralized logging
strategies.
By mastering these tools and concepts, you're no longer just guessing when things go wrong. You have the visibility you need to build, debug, and run resilient, production-ready applications.
Whenever possible,
structure your application's logs as JSON.
A simple text line is hard to parse, but a JSON object with fields like level,
timestamp, and message is instantly machine-readable, making your logs
infinitely more powerful in any observability platform.
Thanks for reading!
