Last updated: June 8, 2026
Configuring OpenTelemetry SDK Environment Variables
Getting the most out of OpenTelemetry means controlling how your instrumentation behaves at runtime, not just wiring it up in the first place.
Environment variables give you that control. With a few well-chosen settings, you can direct where your telemetry goes, decide how much to collect, tune performance characteristics, and even shut the whole thing off if required.
This guide focuses on the OpenTelemetry SDK, the part of OTel that runs inside your application and generates telemetry data. It's separate from the OpenTelemetry Collector, which has its own configuration for receiving, processing, and exporting telemetry.
Here, we'll break down the most useful SDK environment variables, explain what each one does and why it matters in production, and show how to set them in different deployment environments.
Start with the four variables that matter most
If you remember nothing else about OpenTelemetry environment variables, remember these four. They form the foundation of any reliable telemetry setup, and getting them right from the start will save you hours of debugging later.
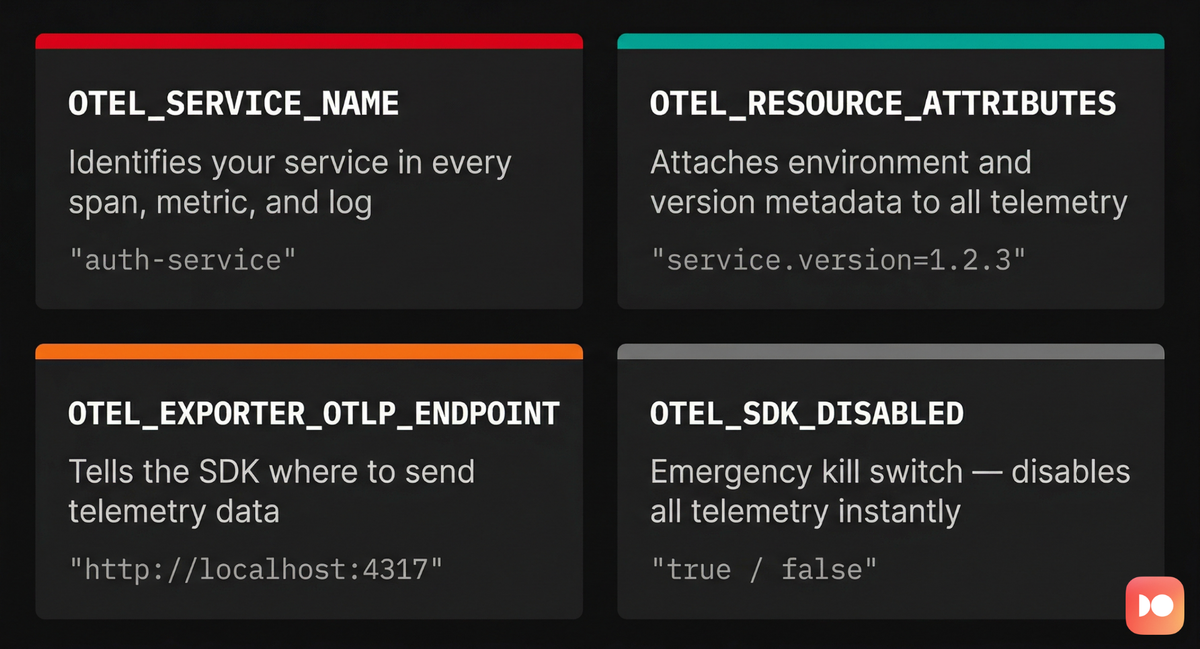
1. OTEL_SERVICE_NAME
This is the single most important variable you'll set. It defines the logical
name of your application or service, and every span, metric, and log emitted by
the SDK carries this name as the service.name resource attribute.
1export OTEL_SERVICE_NAME="authentication-service"
In your observability backend, it's the primary key for filtering, grouping, and
searching. It's how you answer questions like "what's the error rate for
authentication-service?" or "which service is generating the most spans?"
If you omit it, most SDKs will default to something like unknown_service or
unknown_service:<process_name>. This means your telemetry lands in an
anonymous bucket alongside every other service that also forgot to set a name.
When something breaks at 2 AM and you're trying to isolate the faulty service, that's the last situation you want to be in.
2. OTEL_RESOURCE_ATTRIBUTES
Resource attributes add contextual metadata to your telemetry by describing the environment where your code is running. They're key-value pairs that capture details such as the deployment environment, service version, cloud region, or any other dimension that helps you slice and filter your data.
1234export OTEL_RESOURCE_ATTRIBUTES="\deployment.environment.name=production,\service.version=1.2.0,\cloud.region=us-east-1"
With these attributes, you can quickly answer questions like:
- Is this issue happening in
productionor only instaging? - Is it affecting all regions, or just
eu-west-1? - Did the error start after we deployed version
1.3.0?
1export OTEL_RESOURCE_ATTRIBUTES="deployment.environment.name=production,service.version=1.2.0,cloud.region=us-east-1"
Attributes follow a key=value format, separated by commas. For consistency
across services and teams, you should follow the
OpenTelemetry semantic conventions
for well-known resource types, and add custom keys relevant to your business
domain where the conventions don't cover your needs.
OTEL_SERVICE_NAME is actually a shorthand for setting
OTEL_RESOURCE_ATTRIBUTES=service.name=my-service. If you define service.name
in both places, OTEL_SERVICE_NAME takes precedence. Also, resource attributes
set programmatically in your SDK initialization code take priority over those
defined via the environment variable, so keep that in mind if you're combining
both approaches.
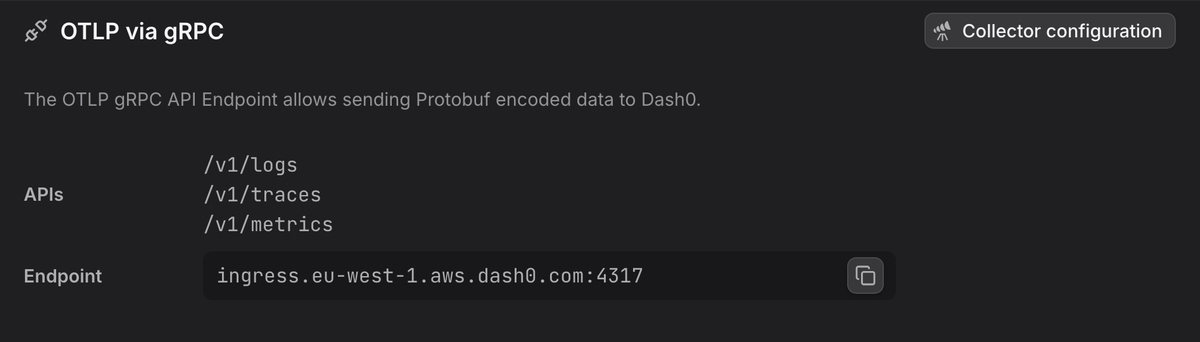
3. OTEL_EXPORTER_OTLP_ENDPOINT
This variable tells the OpenTelemetry SDK where to send telemetry data. The OpenTelemetry Protocol (OTLP) is the standard wire format, and it can be transmitted over either gRPC or HTTP.
123# Send data via gRPC to a local Collectorexport OTEL_EXPORTER_OTLP_ENDPOINT=\"http://localhost:4317"
The value should point to an
OpenTelemetry Collector
(the recommended pattern) or directly to an observability backend that accepts
OTLP. Default ports are 4317 for gRPC and 4318 for HTTP, but your deployment
may use different ones so adjust accordingly.
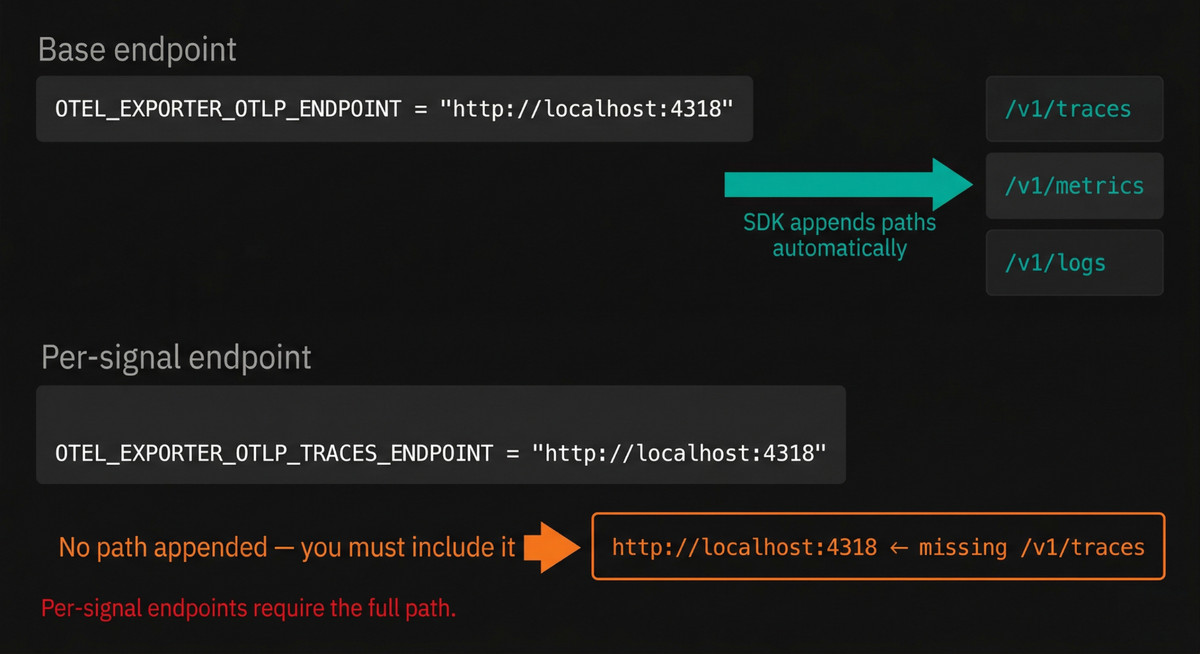
The HTTP path-appending behavior
When using HTTP transport, the SDK appends signal-specific paths to the base URL
you provide. If you set OTEL_EXPORTER_OTLP_ENDPOINT to
http://localhost:4318, the SDK will send traces to
http://localhost:4318/v1/traces, metrics to
http://localhost:4318/v1/metrics, and logs to http://localhost:4318/v1/logs.
This automatic path appending is a common source of confusion, because it only
applies to the base endpoint variable. When you use the per-signal overrides
(OTEL_EXPORTER_OTLP_TRACES_ENDPOINT, OTEL_EXPORTER_OTLP_METRICS_ENDPOINT,
OTEL_EXPORTER_OTLP_LOGS_ENDPOINT), the SDK sends data to the URL exactly as
you specify it, with no path appended. That means you need to include
/v1/traces (or the appropriate path) yourself:
12345# Per-signal endpoints: path is YOUR responsibilityexport OTEL_EXPORTER_OTLP_TRACES_ENDPOINT=\"https://jaeger.example.com:4317"export OTEL_EXPORTER_OTLP_METRICS_ENDPOINT=\"http://localhost:9090/api/v1/otlp/v1/metrics"
This is useful when different signals need to go to different systems. For
example, you might send traces to
Jaeger and metrics to
a
Prometheus-compatible store
as shown above. Any signal without a per-signal endpoint falls back to
OTEL_EXPORTER_OTLP_ENDPOINT.
4. OTEL_SDK_DISABLED
Setting this variable to true completely disables the OpenTelemetry SDK at
runtime. No telemetry is generated, no data is exported, and the performance
overhead drops to near zero because the SDK switches to no-op implementations
internally.
1export OTEL_SDK_DISABLED=true
In Kubernetes, you still need to update the pod spec and roll your pods to pick up the change since environment variables are baked in at pod creation time but that's significantly faster than a full build and deploy cycle.
Fine-tuning the delivery of your telemetry
Once you've told the SDK where to send data with OTEL_EXPORTER_OTLP_ENDPOINT
(and its per-signal variants), you can fine-tune how that data is sent with the
following variables.
OTEL_EXPORTER_OTLP_PROTOCOL
This variable sets the transport protocol for all telemetry signals, unless a per-signal override is provided. The valid values are:
grpcfor protobuf-encoded data using gRPC wire format over an HTTP/2 connection.http/protobuffor protobuf-encoded data over a standard HTTP connection.http/jsonfor JSON-encoded data over HTTP.
1export OTEL_EXPORTER_OTLP_PROTOCOL=grpc
You can also choose different protocols per signal:
1234export OTEL_EXPORTER_OTLP_TRACES_PROTOCOL=http/protobufexport OTEL_EXPORTER_OTLP_METRICS_PROTOCOL=grpcexport OTEL_EXPORTER_OTLP_LOGS_PROTOCOL=http/jsonexport OTEL_EXPORTER_OTLP_PROFILES_PROTOCOL=http/json
If no per-signal protocol is specified, the SDK falls back to
OTEL_EXPORTER_OTLP_PROTOCOL.
There are a couple of practical considerations worth knowing here. First,
http/json is significantly less efficient than the other two options because
JSON encoding produces larger payloads and requires more CPU to serialize. It's
useful for debugging (you can read the payloads in a proxy or network
inspector), but generally avoid it for high-volume production telemetry.
Second, the default protocol varies across SDK implementations.
The specification recommends http/protobuf as the default,
but some SDKs historically defaulted to grpc for backward compatibility. If
you're running a polyglot environment and want consistent behavior, set this
variable explicitly rather than relying on SDK defaults.
OTEL_EXPORTER_OTLP_HEADERS
This adds custom metadata headers to every OTLP request sent by the SDK, most commonly used for authentication. Multiple headers can be set by separating them with commas:
12export OTEL_EXPORTER_OTLP_HEADERS=\"api-key=YOUR_SECRET_TOKEN,tenant-id=acme"
If you're sending data to the OpenTelemetry Collector, these headers can be validated by authentication extensions. In multi-tenant environments, custom headers also help route telemetry to the correct account or storage bucket on the backend side.
Per-signal header variables are also available:
1234export OTEL_EXPORTER_OTLP_TRACES_HEADERS=""export OTEL_EXPORTER_OTLP_METRICS_HEADERS=""export OTEL_EXPORTER_OTLP_LOGS_HEADERS=""export OTEL_EXPORTER_OTLP_PROFILES_HEADERS=""
OTEL_EXPORTER_OTLP_COMPRESSION
This variable enables payload compression for OTLP exports. The only widely
supported value is gzip:
1export OTEL_EXPORTER_OTLP_COMPRESSION=gzip
Enabling compression is one of the easiest performance wins available, especially when your SDK is exporting telemetry across a network boundary (rather than to a local Collector sidecar). Telemetry payloads, particularly traces with many attributes, compress very well with gzip, and you can typically expect a 60-80% reduction in payload size. That translates directly to lower bandwidth usage and reduced egress costs.
By default, the specification defines no compression (payloads are sent uncompressed). Some SDK implementations deviate from this: for example, the Ruby SDK historically defaulted to gzip. If you want consistent behavior across a polyglot stack, set this variable explicitly.
Like most exporter variables, per-signal variants are available:
123export OTEL_EXPORTER_OTLP_TRACES_COMPRESSION=gzipexport OTEL_EXPORTER_OTLP_METRICS_COMPRESSION=gzipexport OTEL_EXPORTER_OTLP_LOGS_COMPRESSION=gzip
All spec-compliant OTLP receivers are required to support gzip decompression, so enabling it on the sender side should not cause compatibility issues.
OTEL_EXPORTER_OTLP_TIMEOUT
This variable controls how long the exporter waits for each batch export to complete before timing out. The default, according to the specification, is 10,000 milliseconds (10 seconds):
12# Value in millisecondsexport OTEL_EXPORTER_OTLP_TIMEOUT=10000
When the exporter encounters a transient error (such as a temporary network issue or a receiver returning a retryable status code), it'll retry the export with exponential backoff rather than immediately dropping the data. This retry behavior is built into the OTLP exporter specification, and it gives your pipeline resilience against short-lived disruptions.
However, there is a well-documented inconsistency across SDK implementations that you should be aware of. While the specification defines timeout values in milliseconds, some SDK implementations have historically interpreted the value in seconds.
If you're running a polyglot environment, test the actual timeout behavior for each language SDK locally before relying on it in production.
Per-signal timeout variables are also available:
1234export OTEL_EXPORTER_OTLP_TRACES_TIMEOUT=15000export OTEL_EXPORTER_OTLP_METRICS_TIMEOUT=30000export OTEL_EXPORTER_OTLP_LOGS_TIMEOUT=10000export OTEL_EXPORTER_OTLP_PROFILES_TIMEOUT=10000
TLS and mutual TLS configuration
If you're exporting telemetry over the network (rather than to a local Collector sidecar), you'll typically want to secure the connection with TLS. The SDK provides several environment variables for this:
OTEL_EXPORTER_OTLP_CERTIFICATE specifies the path to a trusted CA certificate
file (in PEM format) that the SDK uses to verify the server's identity:
12export OTEL_EXPORTER_OTLP_CERTIFICATE=\"/etc/ssl/certs/ca-bundle.crt"
For mutual TLS (mTLS), where the server also needs to verify the client, you additionally set:
1234export OTEL_EXPORTER_OTLP_CLIENT_CERTIFICATE=\"/etc/ssl/certs/client.crt"export OTEL_EXPORTER_OTLP_CLIENT_KEY=\"/etc/ssl/private/client.key"
If you need to disable TLS entirely for development or testing (for example,
when exporting to a Collector on localhost), some SDKs respect
OTEL_EXPORTER_OTLP_INSECURE set to true, though this variable is not
universally supported. A safer and more portable approach is to simply use an
http:// scheme in your endpoint URL, as most SDKs infer TLS settings from the
URL scheme.
All of these variables support per-signal variants (for example,
OTEL_EXPORTER_OTLP_TRACES_CERTIFICATE), which is useful if different signal
backends require different certificates.
Choosing exporters and propagation formats
By default, the OpenTelemetry SDK uses the OTLP exporter for all signal types. You can override this with environment variables to choose a different exporter, disable a signal entirely, or even send the same signal to multiple destinations.
123export OTEL_TRACES_EXPORTER="otlp,zipkin"export OTEL_METRICS_EXPORTER="prometheus"export OTEL_LOGS_EXPORTER="console"
Each variable accepts a single value or a comma-separated list to enable multiple exporters for the same signal (if supported by the SDK). Some of the most common values are listed below:
| Value | Description | Applies to |
|---|---|---|
otlp | Sends data using the OpenTelemetry Protocol. | Traces, Metrics, Logs |
zipkin | Sends trace data to Zipkin (protobuf format by default). | Traces only |
prometheus | Exposes metrics in Prometheus scrape format. | Metrics only |
console | Writes data to standard output (mainly for debugging). | Traces, Metrics, Logs |
none | Disables automatic exporting for that signal. | Traces, Metrics, Logs |
The console exporter is particularly handy during local development. Setting
OTEL_LOGS_EXPORTER=console prints logs directly to your terminal as they
complete, giving you immediate visibility into what the SDK is generating
without needing any additional infrastructure.
In production, the recommended pattern is to export all signals via OTLP to a Collector. The Collector can then fan out to multiple destinations and handle any required transformations, filtering, or sampling.
OTEL_PROPAGATORS
Context propagation is how trace context flows between services in a distributed
system. The OTEL_PROPAGATORS variable lets you control which propagation
formats the SDK uses to inject and extract context from request headers:
1export OTEL_PROPAGATORS="tracecontext,baggage"
The default value in most SDKs is tracecontext,baggage, which uses the
W3C Trace Context
and Baggage standards. If you're integrating with systems that use other
propagation formats, you can add them here. For example, b3multi or b3 for
Zipkin-style propagation, or xray for AWS X-Ray. Multiple values are
comma-separated, and the SDK will attempt to extract context using each format
in order.
Managing trace sampling
Sampling determines which traces are recorded and exported, and which are discarded. In a high-traffic production environment, recording every single trace is rarely necessary or cost-effective. You typically need only a representative subset to understand patterns and diagnose problems.
OTEL_TRACES_SAMPLER
This variable sets the sampling strategy. The basic options are straightforward:
always_on records everything (the default), and always_off drops all traces.
For production, you'll almost certainly want something in between always_on
and always_off.
The traceidratio sampler keeps a fixed percentage of traces based on a
deterministic hash of the trace ID. Setting it to sample 10% means roughly one
in ten traces is recorded.
This sounds simple enough, but it has a serious problem in distributed systems: if each service makes its own independent sampling decision, you end up with broken traces. Service A might decide to sample a particular trace, but Service B (which handles a downstream call in the same trace) might independently decide to drop it.
The result is a partial trace that shows some spans but not others, which is worse than useless for debugging because it gives you an incomplete picture that can be actively misleading.
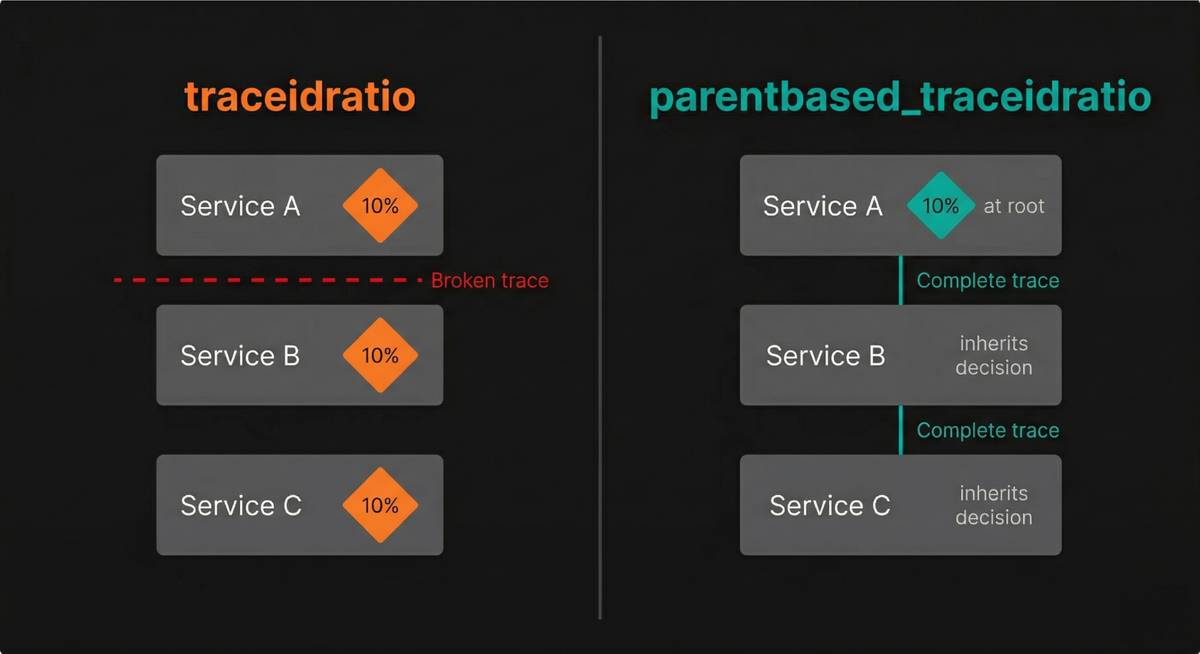
This is exactly why parentbased_traceidratio exists. A parent-based sampler
checks whether the incoming request already carries a sampling decision from an
upstream service.
1export OTEL_TRACES_SAMPLER="parentbased_traceidratio"
If it does, the current service respects that decision: sampled parents produce sampled children, and dropped parents produce dropped children. Only for root spans (requests that start a new trace with no parent) does the ratio-based decision apply.
In practice, parentbased_traceidratio is the right choice for almost every
production deployment. It gives you control over your overall sampling rate
while keeping traces complete across service boundaries.
OTEL_TRACES_SAMPLER_ARG
This provides the argument to the chosen sampler. For ratio-based samplers, it's
a number between 0.0 (sample nothing) and 1.0 (sample everything):
12# Sample 10% of root tracesexport OTEL_TRACES_SAMPLER_ARG="0.1"
If OTEL_TRACES_SAMPLER_ARG is omitted, the SDK defaults to 1.0 (100%), which
effectively means all traces are sampled. Be deliberate about this value. In a
service handling thousands of requests per second, even 10% sampling can produce
a substantial volume of trace data.
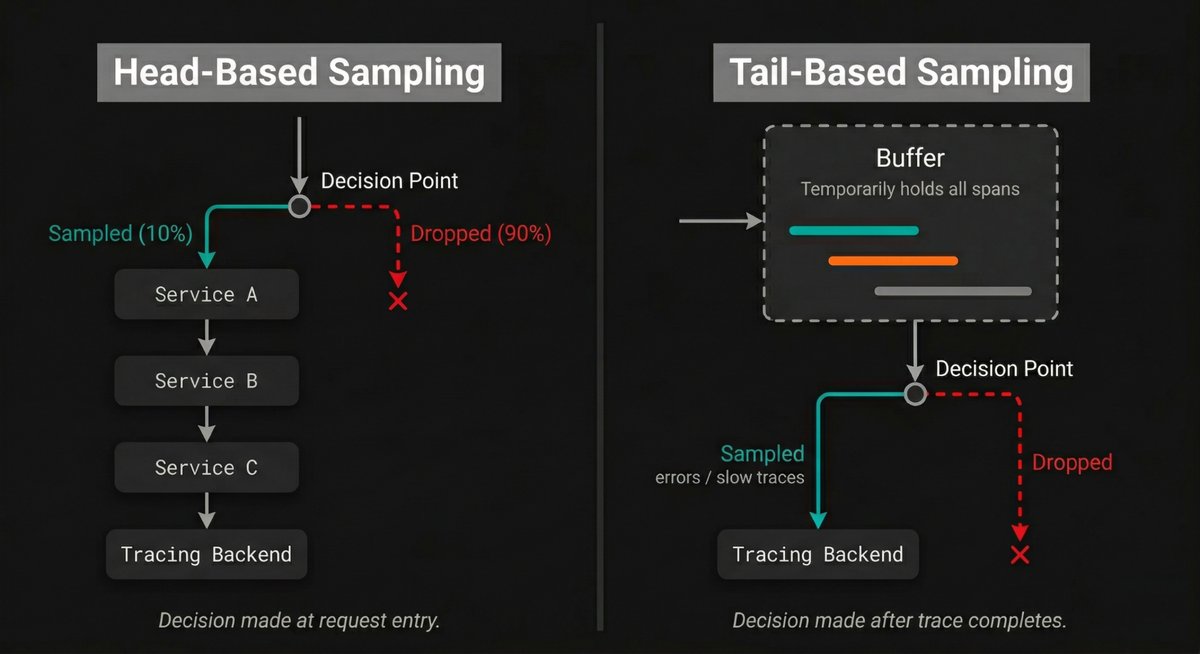
For more sophisticated sampling logic (such as sampling 100% of error traces while only keeping 1% of successful ones), you'll need to move to tail-based sampling in the OpenTelemetry Collector, which can make decisions based on the complete trace rather than just the trace ID.
Configuring metrics export
Alongside traces and logs, the SDK also exports metrics on a periodic schedule. Two variables control this behavior, and getting them right matters more than you might expect.
OTEL_EXPORTER_OTLP_METRICS_TEMPORALITY_PREFERENCE
The SDK default is cumulative
per the OTel spec,
but individual implementations don't always follow it.
If your SDK's default doesn't match what your backend expects, metrics get rejected or silently misinterpreted, and there's often no obvious error pointing you there.
1export OTEL_EXPORTER_OTLP_METRICS_TEMPORALITY_PREFERENCE=cumulative
The three recognized values are:
cumulative: all instruments report accumulated totals.delta: Counters, Asynchronous Counters, and Histograms report the value since the last export. UpDownCounters stay cumulative, since delta doesn't make semantic sense for instruments that can decrease.lowmemory: Synchronous Counters and Histograms use delta; everything else uses cumulative. The SDK spec describes this as lower-memory because it avoids certain internal state conversions.
Prometheus's OTLP write endpoint, for instance, requires cumulative for
Counter types and will reject delta counters with an "invalid temporality and
type combination" error.
1time=2026-06-05T11:14:14.200Z level=WARN source=write_handler.go:614 msg="Error translating OTLP metrics to Prometheus write request" component=web err="the following errors occurred:\n - invalid temporality and type combination for metric \"claude_code.session.count\"\n - invalid temporality and type combination for metric \"claude_code.cost.usage\"\n - invalid temporality and type combination for metric \"claude_code.token.usage\"\n - invalid temporality and type combination for metric \"claude_code.active_time.total\""
OTEL_METRICS_EXEMPLAR_FILTER
Exemplars attach a trace ID and span ID to individual metric data points, letting you jump from a spike in a histogram directly to a specific trace that was recorded during that measurement. They're what makes the line between metrics and traces navigable rather than theoretical.
1export OTEL_METRICS_EXEMPLAR_FILTER=trace_based
The three allowed values are:
trace_based(default per spec): only measurements recorded within a sampled span become exemplars. This is a reasonable default as it means every exemplar you do capture comes with a usable trace link.always_on: all measurements are candidates, regardless of whether a span is active. Useful if you want exemplars on metrics recorded outside a request context, but it increases memory overhead.always_off: exemplars are disabled entirely.
There's a real catch with trace_based and head-based sampling. If you're only
sampling a fraction of traces, outlier measurements recorded outside a sampled
span
won't produce usable exemplars.
This means that you may spot the anomaly in your histogram, but the trace that
would explain it was never recorded.
OTEL_METRIC_EXPORT_INTERVAL
This defines, in milliseconds, how frequently the SDK's periodic metric reader
collects and exports metrics. The default is 60000 (60 seconds):
1export OTEL_METRIC_EXPORT_INTERVAL=60000
This interval is a reasonable starting point for most services, but the right value depends on your resolution requirements. If you need to catch short-lived spikes or disruptions, a shorter interval gives you finer granularity. However, lowering this value has direct cost implications: the SDK must gather and serialize metric data more frequently (increasing CPU usage), send more requests over the network (increasing bandwidth), and your observability backend must store more data points (increasing your storage bill).
For most production workloads, intervals between 15 and 60 seconds strike a good balance between visibility and cost. Going below 10 seconds is rarely justified unless you have a specific, latency-sensitive use case that demands it.
OTEL_METRIC_EXPORT_TIMEOUT
This sets the maximum time (in milliseconds) the SDK waits for a metric export
batch to complete. The default is 30000 (30 seconds):
1export OTEL_METRIC_EXPORT_TIMEOUT=30000
A good rule of thumb is to keep the export timeout significantly shorter than the export interval. If your interval is 60 seconds and your timeout is also 60 seconds, a stalled export could block the next collection cycle entirely. Some SDK implementations use a lock during export, meaning a timed-out export can delay subsequent exports and cause a cascading backup.
Fine-tuning batches, queues, and limits
The OpenTelemetry SDK batches telemetry in memory before exporting it, which keeps network usage efficient and reduces the overhead of individual export calls.
It also enforces limits on the size and number of attributes, events, and links to prevent runaway memory consumption. Understanding these settings is important because the defaults are designed for moderate workloads, and high-throughput services may need to adjust them.
Controlling how spans are batched
The Batch Span Processor (BSP) collects spans in memory and sends them in periodic batches. Three variables control its core behavior, and they interact with each other in ways that matter operationally.
-
OTEL_BSP_SCHEDULE_DELAYdetermines how long (in milliseconds) the processor waits between consecutive exports. The default is5000(5 seconds). Lowering this value means your trace data appears in your backend more quickly, but at the cost of more frequent network calls. -
OTEL_BSP_MAX_EXPORT_BATCH_SIZEcaps the number of spans sent in a single export request. The default is512. If your service generates spans rapidly, the processor will trigger an export as soon as this limit is reached, even if the schedule delay hasn't elapsed yet. This prevents the queue from growing unboundedly during traffic spikes. -
OTEL_BSP_MAX_QUEUE_SIZEdefines the total number of spans that can be buffered in memory. The default is2048. This is your safety net: if the exporter falls behind (because the backend is slow, the network is congested, or the export is timing out), spans accumulate in this queue.Once the queue is full, new spans are silently dropped. There's no error message in your application logs, no exception thrown. The data simply disappears. This is by design (the alternative would be to let the queue grow until the process runs out of memory), but it means you need to size the queue appropriately for your throughput.
12345# Export every 2 seconds, up to 256 spans per batch,# with a larger queue for burst toleranceexport OTEL_BSP_SCHEDULE_DELAY=2000export OTEL_BSP_MAX_EXPORT_BATCH_SIZE=256export OTEL_BSP_MAX_QUEUE_SIZE=4096
Finally, OTEL_BSP_EXPORT_TIMEOUT controls how long to wait for a single export
to complete before giving up. The default is 30000 (30 seconds). If your
backend is consistently slow, a long timeout here means spans sit in the queue
longer, increasing memory pressure and the likelihood of drops.
Controlling how logs are batched
Logs use a similar Batch LogRecord Processor (BLRP) with separate controls so you can tune them independently from spans:
12345# Export logs every 500ms, up to 100 per batchexport OTEL_BLRP_SCHEDULE_DELAY=500export OTEL_BLRP_MAX_EXPORT_BATCH_SIZE=100export OTEL_BLRP_MAX_QUEUE_SIZE=2048export OTEL_BLRP_EXPORT_TIMEOUT=30000
The BLRP defaults to a faster schedule delay (1000ms vs. 5000ms for spans)
because log data is often more time-sensitive for operational use. The same
queue-full drop behavior applies here: once OTEL_BLRP_MAX_QUEUE_SIZE is
reached, incoming log records are discarded.
Limiting attributes
Attributes provide valuable context on your telemetry, but unbounded attributes can cause real problems. A developer might accidentally attach a large JSON payload as a span attribute, or a high-cardinality value (like a full request body) might slip into production. These oversized attributes consume memory during batching, inflate payload sizes during export, and drive up storage costs on the backend.
Two global variables act as safety valves:
-
OTEL_ATTRIBUTE_VALUE_LENGTH_LIMITsets the maximum character length for any attribute value. Values exceeding this limit are truncated by the SDK. The default is unlimited, which means the SDK will happily serialize a 10 MB string attribute if your code produces one. Setting a reasonable limit (such as4096) prevents this class of problem entirely. -
OTEL_ATTRIBUTE_COUNT_LIMITcaps the total number of attributes allowed on a single telemetry entity. The default is128. Attributes beyond this count are silently dropped.
Span-specific limits
Spans have their own set of limit variables that override the global defaults when set. They work the same way as their global counterparts, but apply only to spans and the events and links attached to them.
-
OTEL_SPAN_ATTRIBUTE_VALUE_LENGTH_LIMITsets the maximum length for any span attribute value. Default is unlimited. -
OTEL_SPAN_ATTRIBUTE_COUNT_LIMITcaps the number of attributes per span. Default is128. -
OTEL_SPAN_EVENT_COUNT_LIMITcaps the number of events a span can carry. Default is128. -
OTEL_SPAN_LINK_COUNT_LIMITcaps the number of links per span. Default is128. -
OTEL_EVENT_ATTRIBUTE_COUNT_LIMITcaps the number of attributes on each span event. Default is128. -
OTEL_LINK_ATTRIBUTE_COUNT_LIMITcaps the number of attributes on each span link. Default is128.
Log record limits
Logs have analogous controls for keeping attribute data in check:
-
OTEL_LOGRECORD_ATTRIBUTE_VALUE_LENGTH_LIMITsets the maximum length of any log record attribute value. Default is unlimited. -
OTEL_LOGRECORD_ATTRIBUTE_COUNT_LIMITcaps the number of attributes per log record. Default is128.
By tuning these limits, you'll create guardrails that protect your pipeline from accidental abuse without restricting normal instrumentation. In high-throughput services, a few well-chosen values here can make a meaningful difference in stability and cost.
Setting these variables in production
Every example so far has used shell export commands, which is fine locally. In
production, these are standard environment variables which you can set however
your platform injects environment variables into processes.
If you're running on Kubernetes, the
OpenTelemetry Operator
(or the Dash0 Operator) can inject
the right variables into your workloads automatically via the Instrumentation
custom resource, which removes the per-deployment boilerplate entirely.
Common mistakes and how to avoid them
-
Forgetting
OTEL_SERVICE_NAME. Every service ends up asunknown_servicein your backend, which makes filtering or correlating data per service impossible. Set it before anything else, and treat it as a deployment requirement, not an afterthought. -
Using
traceidratioinstead ofparentbased_traceidratio. If each service independently applies a sampling ratio without considering the parent span's decision, you'll end up with broken, partial traces. The parent-based variant ensures that once a trace is sampled at the entry point, all downstream services continue to record their part of it. -
Mismatched protocols between SDK and receiver. If your SDK is configured to export via
grpcbut your Collector or backend is only listening forhttp/protobuf(or vice versa), exports will silently fail. Make sure the protocol setting matches what your receiver expects, and remember that the default protocol varies across SDK implementations. -
Skipping compression on cross-network exports. When your SDK sends telemetry to a remote Collector or backend (rather than a local sidecar), uncompressed payloads waste bandwidth and increase latency. Setting
OTEL_EXPORTER_OTLP_COMPRESSION=gzipis a one-line change that can reduce payload sizes by 60-80%. -
Confusing base and per-signal endpoint paths. With HTTP transport, the base
OTEL_EXPORTER_OTLP_ENDPOINTautomatically appends/v1/traces,/v1/metrics, and/v1/logs. The per-signal endpoint variables do not. If you setOTEL_EXPORTER_OTLP_TRACES_ENDPOINTtohttp://localhost:4318and expect it to send tohttp://localhost:4318/v1/traces, you'll be disappointed. The per-signal variable needs the full path. -
Ignoring queue sizes in high-throughput services. The default
OTEL_BSP_MAX_QUEUE_SIZEof2048might be perfectly adequate for a low-traffic API, but a service processing tens of thousands of requests per second can fill that queue in moments during an export hiccup. When the queue fills, spans are silently dropped. If you're running high-throughput workloads, increase the queue size and monitor your exporter's drop metrics.
For the full list of available options and their exact behavior across languages, see the OpenTelemetry SDK environment variable specification.
Looking ahead to OpenTelemetry declarative configuration
Environment variables have served as the universal configuration mechanism for OpenTelemetry SDKs since the project's inception, and they aren't going anywhere. But the OTel community is also developing a complementary approach called declarative configuration, which lets you define your entire SDK configuration in a single YAML file.
The motivation is practical: as the number of configuration options grows, managing dozens of environment variables across multiple services and environments becomes unwieldy. A YAML file gives you structure, comments, schema validation, and the ability to review configuration changes in version control diffs.
To use it, you need to point the SDK at the file with a single environment variable:
12export OTEL_EXPERIMENTAL_CONFIG_FILE=\"/etc/otel/sdk-config.yaml"
When this variable is set, the SDK reads configuration from the file at startup,
and all other OTEL_* environment variables are ignored (unless the YAML file
explicitly references them via variable substitution).
As of early 2026, the declarative configuration spec is still experimental. Java has the most mature support, with JavaScript following behind. Other language SDKs are at various stages of implementation.
For now, environment variables remain the production-proven and universally supported approach. But if you're running Java services and want to simplify your configuration management, declarative configuration is worth exploring.
Final thoughts
Every variable in this article gives you a lever you can pull without touching application code. That matters most when things go wrong: wrong temporality sending corrupt metrics, an oversized queue dropping spans silently, a misconfigured endpoint sending data nowhere. The faster you can diagnose and correct those in production, the less time you spend guessing what your pipeline is actually doing.
As you implement these environment variables, consider how an OpenTelemetry-native observability solution like Dash0 can help you maximize the value of your telemetry data.
It accepts OTLP natively across traces, metrics, and logs with no format conversion or proprietary agent required. This means that the data your SDK produces, including exemplars and delta temporality metrics, lands as-is.
On Kubernetes, the Dash0 Operator handles the env var injection covered in this article automatically, so each new workload inherits the right configuration without per-service boilerplate.
