Last updated:
What Is OpenTelemetry Auto-Instrumentation?
You add a JVM flag to your Java service, set an environment variable for your Node.js app, or annotate a Kubernetes pod, and suddenly your services are producing traces and metrics without any code changes. That's the promise of OpenTelemetry auto-instrumentation, and it delivers on a substantial amount of observability coverage most teams need.
But "auto" is doing a lot of heavy lifting in that word, because auto-instrumentation isn't one technique. It's a family of language-specific mechanisms, each shaped by the constraints of its runtime, and each with the same hard ceiling of not seeing your business logic of not seeing your business logic.
If you don't understand what auto-instrumentation actually does and where it stops being useful, you'll spend weeks wondering why your traces don't answer the questions that matter.
This article is the conceptual foundation you need before choosing an approach, covering the mechanisms, the trade-offs, and the patterns that work in production.
OpenTelemetry auto-instrumentation by language
Auto-instrumentation works differently in each language because every runtime provides different mechanisms for loading and modifying instrumentation.
If you're looking for implementation instructions rather than a conceptual overview, start with the guide for your language:
Additional language-specific guides will be added here as they become available.
The rest of this article explains the concepts shared across these implementations, including what auto-instrumentation captures, how the underlying mechanisms differ, and where manual instrumentation is still necessary.
What auto-instrumentation actually does
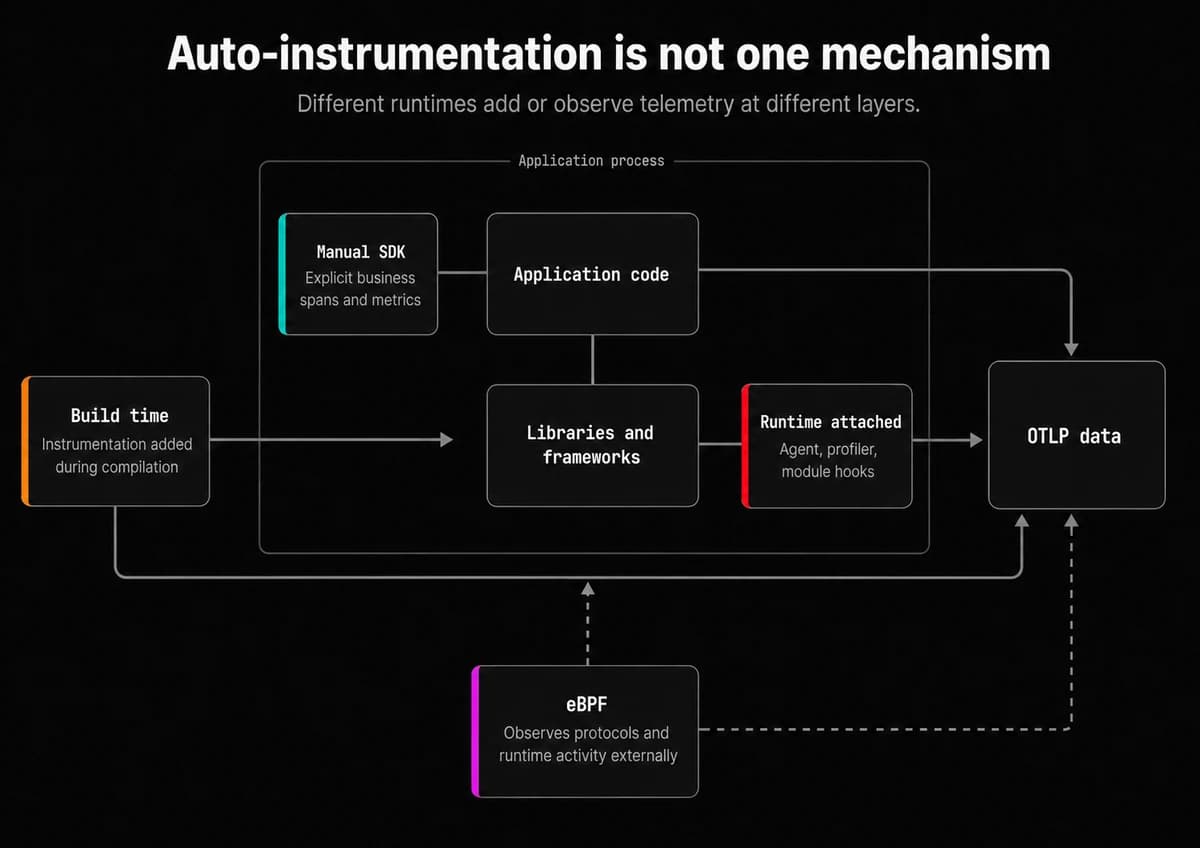
Your application already calls libraries for most of its I/O, like HTTP frameworks, database drivers, or messaging clients.
Auto-instrumentation adds telemetry around supported frameworks, libraries, and runtimes. Depending on the integration, it may create spans for operations, record request and runtime metrics, propagate trace context, or enrich existing log records with correlation metadata.
For example, tracing instrumentation for a PostgreSQL client can create a span around a query and record its duration, database system, and optionally the query text. A corresponding metrics integration may instead aggregate query or request behavior across many operations.
Auto-generated and manually created spans use the same OpenTelemetry span model, participate in the same trace context, and can appear together in a single trace. Backends can still distinguish their instrumentation source through metadata such as instrumentation scope, span naming, and attributes.
The important limitation is that auto-instrumentation instruments supported libraries, not your application logic. It can tell you a database query took 200ms, but it can't tell you that query was fetching invoice data for an enterprise-tier customer who's been waiting on a support ticket for three days.
That context lives in your application logic, and no agent can infer it.
Sorting out the terminology
OpenTelemetry documentation uses zero-code instrumentation, automatic instrumentation, and auto-instrumentation for closely related concepts. In practice, they all describe collecting telemetry without manually adding OpenTelemetry API calls throughout your application code.
The OpenTelemetry documentation currently uses zero-code instrumentation as the main category name, but "zero-code" does not mean zero configuration, zero deployment changes, or zero operational cost.
Most approaches still require you to modify a startup command, add an agent, configure environment variables, change the build process, deploy an operator, or grant additional runtime permissions.
These approaches differ in how instrumentation is added and whether it runs inside or outside the application process.
The main auto-instrumentation models
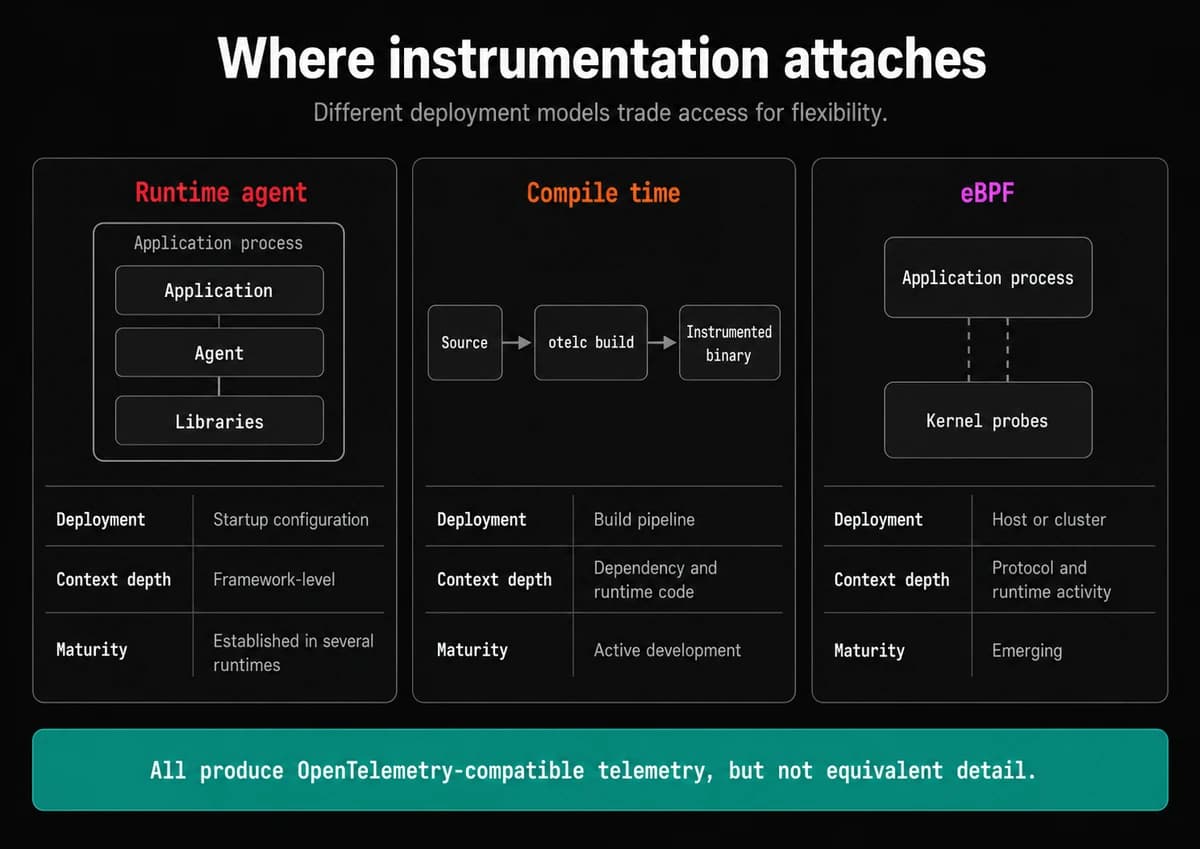
-
Runtime-attached instrumentation modifies or observes the application while it starts or runs. Examples include the Java agent, the .NET profiler, Python monkey-patching, and Node.js module hooks. These approaches do not require application source changes, but they do require the runtime to load an agent or instrumentation package.
-
Build-time instrumentation adds telemetry during compilation. Go compile-time instrumentation, for example, can rewrite application and dependency code as part of the build. It avoids attaching a runtime rewriting agent, but it still changes the build pipeline and adds instrumentation code to the resulting binary.
-
eBPF-based instrumentation observes applications from outside the process using kernel and user-space probes. This makes it largely language-agnostic and useful for fleet-wide coverage without modifying each application. The trade-off is that eBPF can capture supported protocols, network activity, and some runtime behavior, but it usually has less access to framework and business context than in-process instrumentation.
Manual instrumentation is the contrasting model where developers use the OpenTelemetry API or SDK directly to define application-specific spans, attributes, events, and metrics. It runs in process and provides the most domain context, but it requires source-code changes.
Where telemetry is produced
A second distinction is whether instrumentation runs inside or outside the application process.
In-process instrumentation runs alongside your application code. Java agents, .NET profiling, Python and Node.js instrumentation, build-time Go instrumentation, and manual SDK instrumentation generally fall into this category.
Because they execute within the application, these approaches can usually access framework objects, runtime context, and application data. They can also affect application startup time, CPU use, memory allocation, and failure behavior.
Out-of-process instrumentation observes the application externally. eBPF-based instrumentation and service-mesh proxies are common examples.
These approaches can reduce per-service setup and may work with applications whose source or runtime configuration you cannot change. However, they usually have less access to domain-specific context, and their span boundaries, attributes, and propagation behavior can differ from those produced by an in-process agent.
All of these approaches can produce OpenTelemetry-compatible telemetry, but they don't necessarily produce equivalent telemetry as the available attributes, span structure, context propagation, error details, and protocol coverage depend on the mechanism and the specific instrumentation.
For this article, auto-instrumentation refers broadly to instrumentation that captures telemetry without requiring developers to manually create each span or metric. Where the distinction matters, we'll identify whether the approach is runtime-attached, build-time, or externally deployed.
What you get (and what you don't)
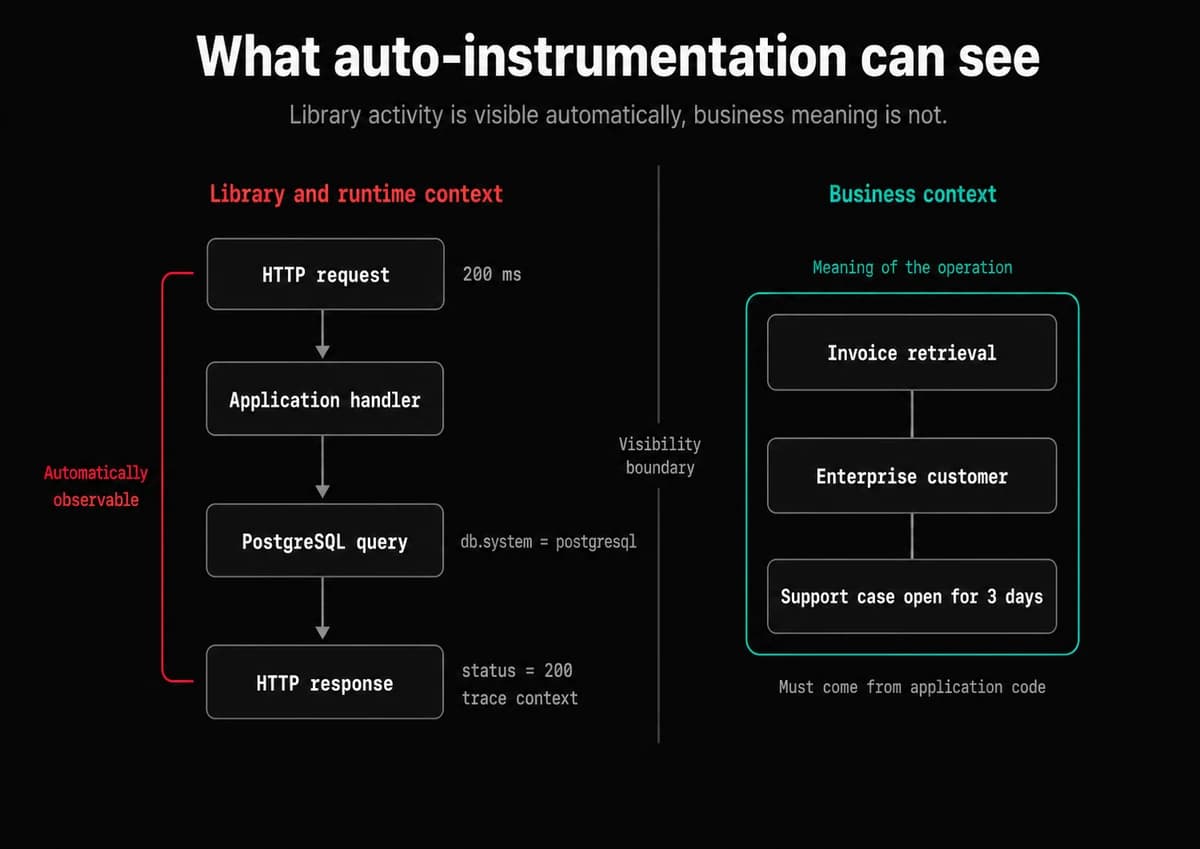
Auto-instrumentation typically provides different kinds of coverage for each telemetry signal.
Traces capture supported operations such as inbound HTTP and gRPC requests, outbound client calls, database queries, and message publishing or consumption. They also propagate trace context across supported boundaries so related operations can be assembled into a distributed trace.
Metrics aggregate behavior across many operations. Depending on the ecosystem, this can include request duration, error counts, active requests, runtime memory, garbage collection, thread pools, event-loop lag, and other in-process or framework measurements.
Logs are less consistent across ecosystems. Depending on the language and logging framework, auto-instrumentation may enrich existing log records with trace and span IDs so that log-trace correlation works or bridge records into the OpenTelemetry logging pipeline. These capabilities often require signal-specific configuration.
Coverage varies by language, library, and signal. Tracing is generally the most complete form of auto-instrumentation, while metrics and logs depend more heavily on the runtime and integration.
When auto-instrumentation is enough (and when it isn't)
Auto-instrumentation is often sufficient for services whose important behavior is already visible through supported HTTP, RPC, database, and messaging libraries. It's especially useful for baseline visibility across many services, and for legacy or third-party applications you can't easily modify.
It is less effective when the important work happens inside application code, such as complex calculations, workflow decisions, retries, or background processing that does not cross an instrumented library boundary. In those cases, the trace may contain a long parent span with little detail about what happened inside it.
Auto-generated metrics may also describe technical behavior without exposing the business outcome behind it. For example, they can show request latency and error rates but not the number of payments sent for manual review unless the application records that metric explicitly.
The hybrid approach: auto + manual together
In practice, most teams use auto-instrumentation as a baseline, then add application-specific telemetry where framework-level coverage is not enough. That may include business spans and attributes, domain metrics, or structured log fields.
For traces, the two approaches work together through shared trace context. When auto-instrumentation creates a span for an inbound HTTP request, and your code then creates a manual span for a business operation inside that handler, the manual span automatically becomes a child of the auto-generated one. In your trace view, you see the full picture: the HTTP layer (auto), the business logic (manual), the database call (auto), all nested correctly in a single trace tree.
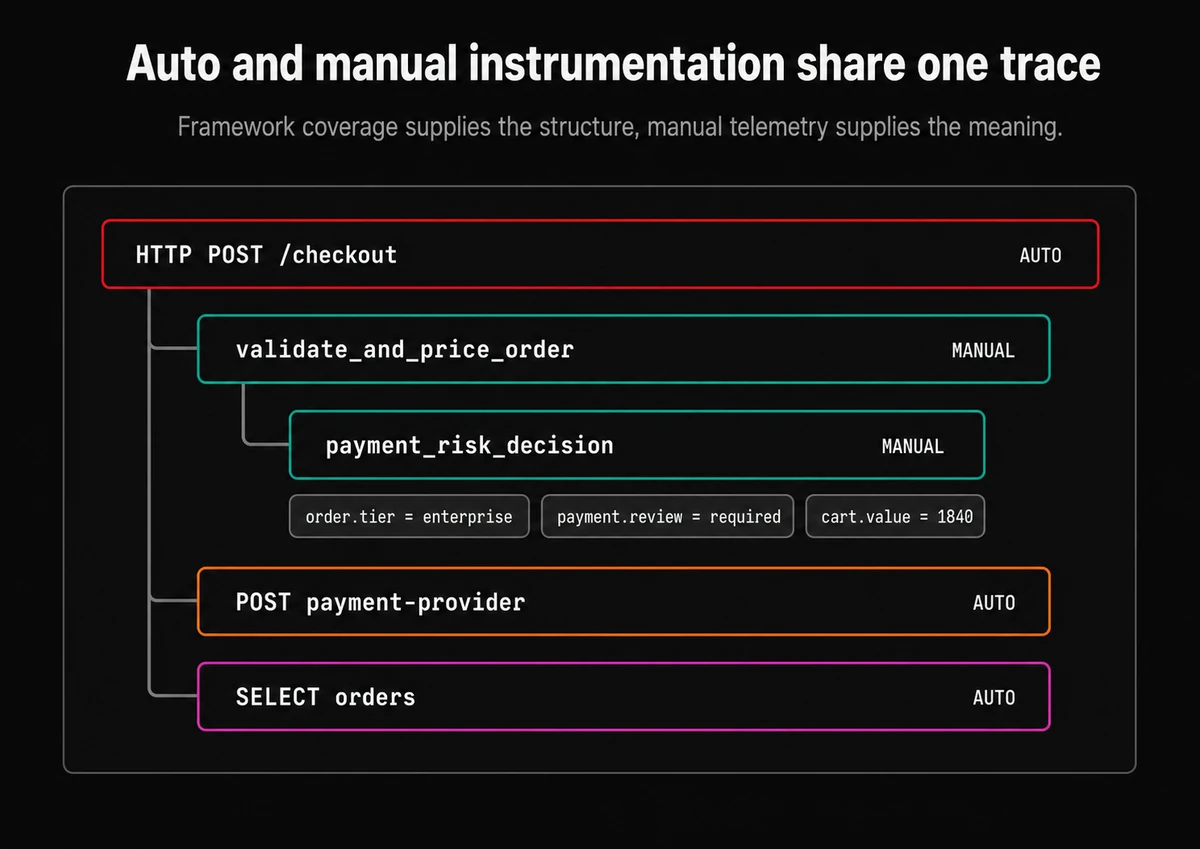
You don't always need to create entirely new spans, either. Several ecosystems
support enriching the auto-generated spans themselves. In Java, you can use the
@WithSpan annotation or grab the current span from the context to add custom
attributes. In
Node.js,
the auto-instrumentation packages accept hook functions that let you modify span
names and attach attributes based on request or response data. This is useful
when you want to keep the auto-generated span but add the business context that
makes the data actually useful.
Enable auto-instrumentation as a baseline, then add manual telemetry to the workflows that matter most. The urge to instrument everything is real, especially early on, but most of those custom spans will never get looked at. Focus on what you'll actually pull up when something breaks.
If you're not sure where to start, look at your last few production incidents and ask which ones would have been faster to debug with a custom span or attribute, because that's your shortlist.
Common OpenTelemetry auto-instrumentation gotchas
Auto-instrumentation has rough edges, and a few of them trip up nearly every team that adopts it.
1. Performance overhead varies
Auto-instrumentation adds overhead, but the impact depends on the runtime, enabled instrumentations, sampling, and export configuration.
In-process approaches can affect CPU usage, memory footprint, startup time, and request latency. Compile-time instrumentation avoids the runtime cost of attaching an agent or rewriting code as the application starts, but the emitted instrumentation still has the normal runtime cost of creating, enriching, and exporting telemetry.
Out-of-process eBPF instrumentation shifts much of the work away from the application process, but it still consumes host CPU and memory and may introduce operational costs elsewhere in the system.
2. Cold-start latency catches people off guard in serverless
The Java agent performs class discovery and transformation at startup. On long-running services that's a one-time cost you forget about. In serverless, you pay it on every cold start, and it adds up fast.
For latency-sensitive serverless workloads it's worth considering manual instrumentation with just the specific instrumentations you need, rather than the full agent.
3. Compatibility gaps can cause missing telemetry
Auto-instrumentation depends on supported libraries, runtime versions, and loading behavior. Framework upgrades, custom wrappers, unusual startup configurations, or unsupported libraries can result in missing telemetry or incomplete attributes without causing an obvious application error.
4. Overlapping instrumentation can create duplicate telemetry
Enabling multiple instrumentation layers for the same operation can produce duplicate spans, repeated metrics, or confusing parent-child relationships. This can happen when an application already emits OpenTelemetry data and you add an agent, or when in-process instrumentation overlaps with service-mesh or eBPF-based instrumentation.
Review which layer is responsible for each protocol and library, disable redundant instrumentations, and validate trace structure, metric series, and log enrichment after rollout.
5. Data volume and attribute cardinality can grow quickly
Auto-instrumentation usually captures all supported operations using default rules, but most implementations provide some control over what is collected. You can often disable specific instrumentations, ignore noisy endpoints, suppress attributes, or customize span enrichment.
Some of that data may be sensitive, while high-cardinality values such as user IDs, tenant IDs, full URLs, or unbounded query text can increase storage and query costs substantially.
Review which attributes are collected, redact or disable sensitive fields, and filter noisy traffic before it reaches your backend.
6. Context propagation can still break
Auto-instrumentation usually propagates trace context across supported HTTP, RPC, and messaging libraries, but it cannot cover every boundary. Custom protocols, background jobs, async handoffs, or mismatched propagator settings can split a request into separate traces.
Verify that critical workflows remain connected end to end, especially across queues, scheduled jobs, and custom integrations.
7. Kubernetes injection only happens when the pod is created
The OpenTelemetry Operator injects auto-instrumentation through a mutating
admission webhook. The Instrumentation custom resource must therefore exist
before the target pod is created.
If the application is deployed first, creating the Instrumentation resource
later will not modify the running pod. Restart or recreate the pod after the
resource is available.
Where auto-instrumentation is heading
Two newer approaches are expanding where OpenTelemetry auto-instrumentation can be used.
OpenTelemetry eBPF Instrumentation (OBI) provides out-of-process instrumentation using eBPF. It can generate traces and metrics for supported protocols without loading an agent into each application, making it useful for fleet-wide coverage and applications that cannot be modified.
OBI reached its first alpha release in November 2025. Its published 2026 roadmap includes broader protocol support, improved Kubernetes deployment, closer alignment with OpenTelemetry semantic conventions, and progress toward a stable release. As an external, protocol-level approach, it generally provides less framework and application detail than in-process instrumentation.
Go compile-time instrumentation addresses a different limitation. Because Go applications compile directly to native binaries, they cannot use the runtime attachment techniques available to Java or .NET.
The OpenTelemetry Go compile-time instrumentation project provides an otelc
build wrapper that uses the Go toolchain's -toolexec mechanism to inject
instrumentation during compilation, including into supported dependencies. The
project just had its v1 release so you can start using it in production if it fits your needs.
These projects do not replace existing agents or manual instrumentation. They expand the available deployment options, particularly where runtime attachment is impractical or application source changes are difficult.
Final thoughts
Auto-instrumentation is usually the fastest way to establish baseline visibility across a service fleet. It captures supported framework and library activity without requiring developers to manually instrument every operation.
It's not a substitute for application-specific instrumentation. Use it for breadth, then add manual telemetry and attributes to the workflows where business decisions and domain context matter. The two approaches share the OpenTelemetry data model and context, but the fidelity of the resulting telemetry still depends on the instrumentation mechanism and the information available to it.
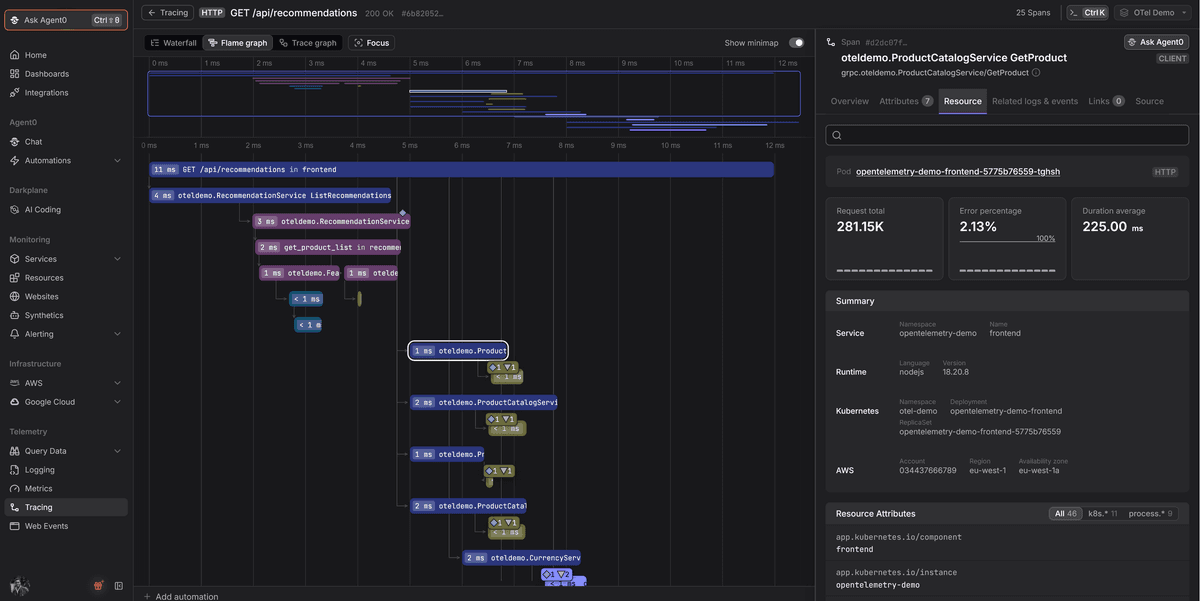
Dash0 accepts OpenTelemetry data from agents, SDKs, Collectors, and Kubernetes-based auto-instrumentation. You can use it to verify that traces remain connected, inspect the metrics produced by your runtime and framework integrations, and correlate logs with the operations that generated them.
The Dash0 Kubernetes Operator can also manage auto-instrumentation injection for supported workloads. You can try Dash0 for free with a 14-day trial.