Last updated: July 27, 2026
Understand OpenTelemetry Metric Names and Labels
Because Dash0 is OpenTelemetry-native, metric names are stored and queried differently from a traditional Prometheus setup. Understanding the distinction between otel_metric_name and the translated Prometheus name avoids a common class of PromQL errors.
Dual Naming: OpenTelemetry and Prometheus
When OpenTelemetry metrics are sent to Dash0, they maintain their original names while also being exposed with Prometheus-compatible names according to the OpenTelemetry specification. This dual-naming approach gives you flexibility in how you query your data.
For example, an OpenTelemetry metric named k8s.pod.memory.working_set is also exposed in Prometheus format as k8s_pod_memory_working_set_bytes. Both names refer to the same underlying metric data, and you can use either in your queries.
The otel_metric_name Attribute
Every metric ingested by Dash0 carries a special otel_metric_name label that holds the original OpenTelemetry metric name — for example, app.ads.ad_requests or dash0.logs. This attribute is not sent by your instrumentation; Dash0 derives it from the metric's own identity metadata (alongside otel_metric_type and otel_metric_unit).
Using otel_metric_name in a PromQL selector is the recommended approach for most users:
1increase({otel_metric_name="app.ads.ad_requests", otel_metric_type="sum"}[2m])
This works regardless of how the underlying metric name has been translated for Prometheus compatibility and stays stable even if the metric type or unit changes.
You can equivalently query using the Prometheus-compatible name directly:
1k8s_pod_memory_working_set_bytes{service_name="adservice"}
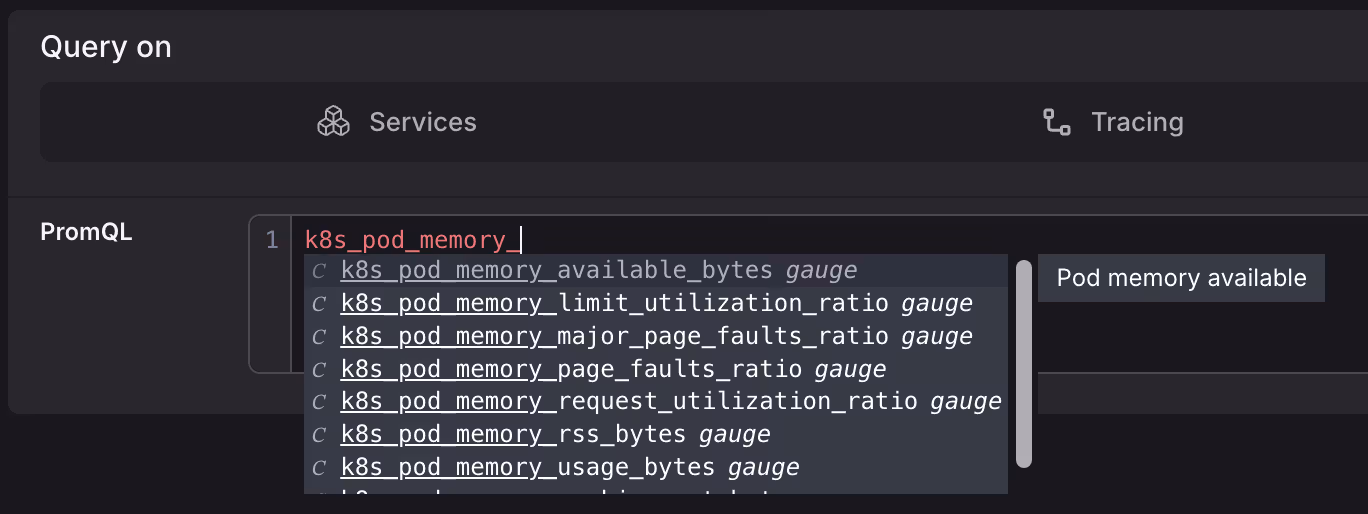
The easiest way to discover Prometheus-compatible names is the Query Builder's autocomplete — once you type a prefix, it shows all matching metric names.
The otel_metric_type and otel_metric_unit Attributes
Alongside otel_metric_name, Dash0 adds two more labels to every metric:
otel_metric_type— the OTLP data model type. Valid values aresum,gauge,histogram,exponential_histogram, andsummary(always lowercase in PromQL).otel_metric_unit— the unit declared in the metric definition (e.g.,s,By,1), if one was provided.
The table below maps each otel_metric_type value to its OTLP type, the OTel API instrument it corresponds to, and how it appears in the Metric Explorer UI:
otel_metric_type | OTLP Type | OTel API Instrument | Metric Explorer |
|---|---|---|---|
sum | Sum | Counter, UpDownCounter | SUM |
gauge | Gauge | Gauge | GAUGE |
histogram | Histogram | Histogram | HIST |
exponential_histogram | ExponentialHistogram | ExponentialHistogram | EXP HIST |
summary | Summary | — | SUMMARY |
Use otel_metric_type in PromQL to disambiguate metrics that share a name but differ in type:
1{otel_metric_name="app.frontend.requests", otel_metric_type="sum"}
The Prometheus Name Transformation
Prometheus requires metric names to match the pattern [a-zA-Z_:][a-zA-Z0-9_:]*. Dash0 applies the standardized OpenTelemetry-to-Prometheus mapping when exposing metrics via a Prometheus-compatible endpoint. The mapping applies these transformations:
- Type suffixes are added (e.g.
_totalfor counters). - Unit suffixes may be added (e.g.
_seconds,_bytes). - Invalid characters (dots, hyphens) are replaced with underscores.
- Multiple consecutive underscores are collapsed into one.
Note that in PromQL selectors, dots in label names are also replaced with underscores — for example, k8s.deployment.name becomes k8s_deployment_name.
Choosing Which Name to Use
| Situation | Recommendation |
|---|---|
| Writing new PromQL queries in Dash0 | Use otel_metric_name |
| Migrating queries from an existing Prometheus setup | Look up the translated name via autocomplete, or convert manually |
| Querying Dash0's Prometheus-compatible scrape endpoint | Use the translated Prometheus name |
| Long-term stability (type or unit may change) | Use otel_metric_name |
Common Pitfall: Dots in Metric Names
A frequent error is using OpenTelemetry metric names directly as the PromQL metric selector without wrapping them in a label matcher. Dots are not valid in bare PromQL metric names and will cause a parse error:
12# Error: unexpected character '.'jvm.memory.used.bytes{service.name="catalog", jvm.memory.type="heap"}
Fix this by using otel_metric_name or the Prometheus-compatible translated name:
12345# Option 1: otel_metric_name label matcher (recommended){otel_metric_name="jvm.memory.used.bytes", service_name="adservice", jvm_memory_type="heap"}# Option 2: Prometheus-compatible namejvm_memory_used_bytes{service_name="adservice", jvm_memory_type="heap"}
Sending Prometheus Metrics to Dash0
The best way to send Prometheus metrics to Dash0 is via the OpenTelemetry Collector. See our integration documentation for setup instructions.
Further Reading
- Query Metrics in the Query Builder — practical guidance on writing PromQL in Dash0, including common pitfalls around step sizes and cardinality.
- Understand Synthetic Metrics — how
otel_metric_nameapplies to log, span, and web event metrics. - Write Effective PromQL Queries — a reference of query patterns for gauges, histograms, summaries, and synthetic metrics.