Last updated:
How OpenTelemetry Metrics Work (with Examples)
Metrics are one of the core signals used to understand how a system is behaving. They let you track quantities such as request rates, error counts, resource usage, queue depth, and latency distributions over time.
OpenTelemetry provides a vendor-neutral way to generate and export those metrics alongside traces and logs. Instead of tying your instrumentation to a particular backend, you can use a common API, data model, and protocol while retaining control over how measurements are aggregated and where the resulting metrics are sent.
This article explains how OpenTelemetry metrics work from the application outward. You'll learn how Instruments and Measurements relate to metric streams, how aggregation and temporality affect the exported data, when to use Counters, Gauges, and Histograms, and how Views, Resources, and exporters fit into the metrics pipeline.
OpenTelemetry metrics vs traditional metrics instrumentation
Traditional metrics libraries often combine several concerns: the API you use to record a value, how that value is aggregated, the format used to transport it, and sometimes the backend that ultimately stores it.
OpenTelemetry separates those concerns. Your application records Measurements through the Metrics API. The OpenTelemetry SDK decides how those Measurements are aggregated into metric streams, while the OpenTelemetry Protocol (OTLP) provides a standard way to transport the resulting data to a Collector or compatible backend.
This separation has a few practical benefits:
-
Backend independence: Instrumentation written against the OpenTelemetry API isn't tied directly to a particular observability backend. Changing where metrics are sent can often be handled through SDK, Collector, or deployment configuration instead of rewriting application instrumentation.
-
Consistent telemetry: OpenTelemetry provides shared conventions for describing metrics, Resources, and attributes across languages and services. It also uses the same Resource and context concepts across metrics, traces, and logs.
-
Control over metric streams: The SDK can aggregate Measurements, adjust attributes, configure histogram behavior, and otherwise shape metric streams before they're exported. This lets you adapt the resulting telemetry without changing every place where a Measurement is recorded.
How the metrics architecture fits together
OpenTelemetry metrics are easier to reason about once you separate what your application records from what the SDK exports and what your backend eventually stores.
The OpenTelemetry metrics data model describes this flow using three related models:
- Event model: This is where instrumentation happens. Your application creates metric Instruments and records individual Measurements, such as one request taking 250 milliseconds or one job completing successfully.
- Metric Stream model: The SDK combines Measurements with the Instrument's identity and aggregation configuration to produce metric streams containing aggregated data points. This is the form OpenTelemetry can export and transform downstream.
- Time Series model: This describes how an OpenTelemetry backend ultimately interprets and stores the resulting data as time series.
You can think of the relationship like this:
Application                 OpenTelemetry                 Backend

Instrument
    │
    ├── Measurement ───► Metric stream ─────────────► Time series
    │                    and data points
    └── Measurement
This distinction matters because OpenTelemetry generally doesn't export every Measurement individually, as doing so would generate far too much telemetry for most applications. Instead, the SDK aggregates Measurements into metric data points before they're exported. A Histogram, for example, can represent many individual latency Measurements using a count, sum, and bucket distribution rather than sending every observed latency separately.
The intermediate stream model also supports several useful transformations:
-
Temporal reaggregation combines shorter collection intervals into longer ones, such as combining 10-second intervals into 60-second intervals.
-
Spatial reaggregation combines streams after removing an attribute. For example, removing
service.instance.idlets you aggregate across service instances. -
Delta-to-cumulative conversion turns values for individual intervals into values accumulated from a common starting point.
Almost every confusing thing about OpenTelemetry metrics turns out to be a question about which of these three layers you're standing in.
How the OpenTelemetry metrics API works
The OpenTelemetry metrics API gives you the components you need to define and record measurements in your application, while the SDK handles aggregation, collection, and export.
The main components fit together like this:
MeterProvider → Meter → Instrument → Measurement
                                      ↓
                               SDK aggregation
                                      ↓
                            MetricReader → Exporter
The MeterProvider is the entry point for metrics in your application. It
creates Meter instances, and each Meter creates Instruments such as
Counters, Gauges, and Histograms.
Your code records Measurements through those Instruments. The SDK aggregates
those Measurements into metric data, while Views can change how the resulting
metric streams are configured.
A MetricReader controls how aggregated metrics are collected, while a
MetricExporter sends them to an OpenTelemetry Collector or observability
backend.
Each component has a distinct role, so it's worth looking at them individually.
Defining your metric sources with a MeterProvider
The MeterProvider is the main entry point to the OpenTelemetry Metrics API. It
provides access to Meter instances and is also the central place where you
configure the SDK's metrics pipeline.
You'll typically create one MeterProvider when your application starts and
register it globally so that your application code and instrumented libraries
can acquire Meters from it.
A MeterProvider is responsible for:
- Providing
Meterinstances. - Associating a
Resourcewith the metrics it produces. - Configuring
Views andMetricReaders that control how Measurements are aggregated, collected, and exported.
Here's a minimal example:
import { metrics } from "@opentelemetry/api";
import { MeterProvider } from "@opentelemetry/sdk-metrics";

// Create the application's MeterProvider
const meterProvider = new MeterProvider({
  // Configure resources, readers, and views here.
});

// Make it available through the global Metrics API
metrics.setGlobalMeterProvider(meterProvider);
Once you've registered the provider, any part of your application can
acquire a Meter:
const meter = metrics.getMeter("my-application-web-server");The name you provide identifies the instrumentation that produced the metrics. You can also provide a version and schema URL, which together contribute to the Meter's Instrumentation Scope.
Creating Instruments with Meters
A Meter is the component you use to create metric Instruments such as
Counters, Histograms, and Gauges.
You normally acquire a Meter for a particular library, module, or other
logical unit of instrumentation rather than sharing one Meter indiscriminately
across unrelated code.
The name and optional version you provide when acquiring a Meter identify its
Instrumentation Scope. That scope travels with the metrics produced by the
Meter's Instruments, which helps you identify where the instrumentation
originated.
This is different from a Resource:
- A Resource describes the entity producing the telemetry, such as a service, process, container, or host.
- An Instrumentation Scope identifies the library or component that created the telemetry.
For example, several libraries inside the same payment-service might emit
metrics. They can share the same Resource while using different Instrumentation
Scopes.
Here's an example of acquiring a Meter for payment-related instrumentation:
import { metrics } from "@opentelemetry/api";

// Assuming the global MeterProvider has already been configured.

const meter = metrics.getMeter("my-app.payment-logic", "1.0.0");
Once you have a Meter, you can use it to create the Instruments that record
Measurements in your application.
The metric instruments and when to use each
instruments and when to use each An Instrument is what you use to record
Measurements in your application. You create it from a Meter, usually once
during application startup, and its configuration helps define the metric stream
that the SDK will later produce.
Each Instrument has a few important properties:
- A descriptive name, such as
http.server.request.duration. - An instrument type, such as Counter, UpDownCounter, Gauge, or Histogram, which defines the semantics of the Measurements you can record.
- A unit, such as
sfor seconds orByfor bytes, which tells consumers how to interpret the recorded values. - An optional description that explains what the Instrument measures.
Choosing the right instrument type matters because each one expresses a different kind of value. A Counter represents a total that only increases, for example, while a Histogram records a distribution of individual values such as request durations.
OpenTelemetry Instruments are also divided into synchronous and asynchronous variants.
With a synchronous Instrument, your code records a Measurement when an event occurs or a value becomes known. An asynchronous Instrument instead uses a callback that the SDK invokes during collection to observe the current value from another source.
The distinction is mainly about how the value becomes available, not whether the metric itself changes frequently.
1. Counter and Asynchronous Counter
Counters measure values that only increase, a property known as monotonicity.
OpenTelemetry provides two counter instruments: the synchronous Counter and
the asynchronous ObservableCounter. Both represent monotonically increasing
totals, but they differ in how those totals are recorded.
A Counter is the usual choice when your application knows that an event has
occurred. You call its .add() method with a non-negative value each time the
event happens.
Typical uses include counting completed orders, processed messages, cache misses, or other application-specific events that automatic instrumentation can't infer.
For example, an e-commerce service could count each successfully completed order:
const completedOrders = meter.createCounter("app.orders.completed", {
  description: "Total number of successfully completed orders",
  unit: "{order}",
});

async function completeOrder(order) {
  await saveOrder(order);

  completedOrders.add(1, {
    "order.payment_method": order.paymentMethod,
  });
}
An ObservableCounter is useful when another part of the system already keeps
track of a cumulative total. Instead of calling .add(), you register a
callback that reads the current value whenever the SDK collects metrics.
For example, Node.js exposes cumulative CPU usage through process.cpuUsage().
You can report those values with the standard process.cpu.time metric:
const processCpuTime = meter.createObservableCounter("process.cpu.time", {
  description: "Total CPU seconds broken down by CPU mode.",
  unit: "s",
});

processCpuTime.addCallback((result) => {
  const { user, system } = process.cpuUsage();

  result.observe(user / 1_000_000, {
    "cpu.mode": "user",
  });

  result.observe(system / 1_000_000, {
    "cpu.mode": "system",
  });
});
process.cpuUsage() returns cumulative user and system CPU time in
microseconds, so the callback converts each value to seconds. Both values only
increase over the lifetime of the process, which matches Counter semantics.
Use a batch observable callback when one expensive read supplies values for
multiple asynchronous Instruments. For a single Instrument like this,
addCallback() is simpler.
2. UpDownCounter and Asynchronous UpDownCounter
An UpDownCounter measures an additive value that can increase or decrease.
Unlike a Counter, it isn't monotonic, so you can record both positive and
negative changes.
The OpenTelemetry API provides two variants: the synchronous UpDownCounter and
the asynchronous ObservableUpDownCounter.
A synchronous UpDownCounter is useful when your application directly observes
the changes that affect a current total:
const activeOrders = meter.createUpDownCounter("app.orders.active", {
  description: "Number of orders currently being processed",
  unit: "{order}",
});

async function processOrder(order) {
  activeOrders.add(1);

  try {
    await chargePayment(order);
    await fulfillOrder(order);
  } finally {
    activeOrders.add(-1);
  }
}
The value rises when order processing begins and falls when processing ends.
Because the Measurements represent changes to an additive total, an
UpDownCounter is a good fit.
Make sure you use the same attributes for the increment and corresponding decrement. Otherwise, the two Measurements can end up in different time series and won't cancel each other out.
If the current value is already maintained somewhere else and can be read
directly, use an ObservableUpDownCounter instead.
For example, you can observe the current physical memory used by the Node.js process:
const processMemoryUsage = meter.createObservableUpDownCounter(
  "process.memory.usage",
  {
    description: "The amount of physical memory in use.",
    unit: "By",
  },
);

processMemoryUsage.addCallback((result) => {
  result.observe(process.memoryUsage().rss);
});
process.memoryUsage().rss reports the process's current resident set size
(RSS) in bytes. The value can rise or fall over time, and memory usage is
additive across processes, which matches ObservableUpDownCounter semantics.
3. Gauge and Asynchronous Gauge
A Gauge measures a non-additive value that represents the state of something at a particular point in time. Its value can increase or decrease, but unlike an UpDownCounter, it doesn't represent a quantity that you can meaningfully sum across multiple sources.
CPU utilization is a good example. If two servers report 50% and 60% utilization, adding them together to produce 110% doesn't tell you anything useful. You'd normally calculate an average, maximum, or another aggregation instead.
This is the key difference between a Gauge and an UpDownCounter:
- Use an UpDownCounter for values that can increase or decrease but remain additive, such as the amount of memory used by a set of processes.
- Use a Gauge for values that aren't meaningfully additive, such as CPU utilization, temperature, or connection-pool utilization.
For most current-state metrics, you should prefer an Asynchronous Gauge. It lets the SDK observe the latest value when metrics are collected, which fits naturally when another component already maintains that state.
For example, you could report the current utilization of a database connection pool:
const dbPoolUtilization = meter.createObservableGauge(
  "app.db.pool.utilization",
  {
    description: "Current fraction of database connections in use",
    unit: "1",
  },
);

dbPoolUtilization.addCallback((result) => {
  const total = pool.totalCount;
  const active = total - pool.idleCount;

  result.observe(total === 0 ? 0 : active / total);
});
A synchronous Gauge is more specialized. It records values with record() and
uses Last Value aggregation, so only the most recent Measurement for a given
attribute set is retained for collection.
This can be appropriate when your application receives authoritative state updates as they happen and can't query the current value later:
const temperature = meter.createGauge("app.room.temperature", {
  description: "Current room temperature",
  unit: "Cel",
});

sensor.on("temperature", (value) => {
  temperature.record(value);
});
Be careful when multiple parts of your application can record the same synchronous Gauge with the same attributes. Since the aggregation keeps the last observed value, concurrent writers can make the result dependent on which Measurement happens to arrive last.
If you can read the current value directly at collection time, prefer the Asynchronous Gauge.
4. Histogram
A Histogram records a distribution of values. It's the right instrument when you want to understand not only how many Measurements occurred, but also how those values are distributed.
Common examples include request duration, database query latency, message size, or order value. Unlike Counters and Gauges, which summarize a single quantity, a Histogram is designed for values that vary from one event to the next.
Each time an event occurs, you record its value with the Histogram. The SDK then aggregates those Measurements into statistics such as the total count, sum, and a distribution across buckets. Observability backends can use that distribution to analyze percentiles such as p50, p95, and p99.
For example, an e-commerce application could record the value of every successfully completed order:
const orderValue = meter.createHistogram("app.orders.value", {
  description: "Value of successfully completed orders",
  unit: "{USD}",
});

async function completeOrder(order) {
  await saveOrder(order);

  orderValue.record(order.total, {
    "order.payment_method": order.paymentMethod,
  });
}
The OpenTelemetry specification recommends the following default explicit bucket boundaries when neither the Instrument nor a matching View provides them:
[0, 5, 10, 25, 50, 75, 100, 250, 500, 750, 1000, 2500, 5000, 7500, 10000]Those defaults were designed around millisecond-scale latency and can be a poor fit for other units. If you record durations in seconds, for example, most normal values may fall into the first bucket, leaving the resulting distribution with very little useful resolution.
When you own the instrumentation, the Instrument itself is the best place to recommend suitable boundaries because its author knows the unit and expected range of the Measurements.
OpenTelemetry calls these advisory parameters. For a Histogram, you can provide recommended explicit bucket boundaries when creating the Instrument. In the JavaScript API, that looks like this:
const orderProcessingDuration = meter.createHistogram(
  "app.orders.processing.duration",
  {
    description: "Time spent processing an order",
    unit: "s",
    advice: {
      explicitBucketBoundaries: [0.01, 0.025, 0.05, 0.1, 0.25, 0.5, 1, 2.5, 5],
    },
  },
);
The boundaries are recommendations to the SDK rather than immutable properties of the Instrument. If an operator configures a matching View with an Explicit Bucket Histogram aggregation, the View takes precedence.
This separation lets instrumentation authors provide sensible defaults while still allowing operators to override them for a particular deployment.
Instrumenting your application with OpenTelemetry metrics
OpenTelemetry supports zero-code and manual instrumentation, and you'll often use both in the same application.
Zero-code instrumentation
Start with zero-code instrumentation for standard framework, protocol, and runtime telemetry where your language ecosystem supports it. There's little benefit in manually recreating a standard metric if existing instrumentation already emits it.
Support varies between languages and instrumentation libraries, so the exact metrics available depend on your stack.
Manual instrumentation
Manual instrumentation is what we've been doing throughout this article. You create Instruments through the OpenTelemetry Metrics API and record Measurements from application code.
It's most useful for domain-specific behavior that automatic instrumentation can't infer, such as completed orders, payment failures, or other business and application-level signals.
From Measurements to metric data points
A Measurement is an individual value recorded through an Instrument. It consists of the value itself and, optionally, a set of attributes that describe the context in which it was observed.
For example, a Histogram might record how long an order took to process:
orderProcessingDuration.record(0.42, {
  "order.payment_method": "card",
});
That call records one Measurement. The SDK doesn't normally export that raw value directly. Instead, it aggregates Measurements into metric data points.
The aggregation used depends on the Instrument and the SDK configuration:
| Instrument | Default aggregation | Resulting data type |
|---|---|---|
| Counter | Sum | Sum |
| Asynchronous Counter | Sum | Sum |
| UpDownCounter | Sum | Sum |
| Asynchronous UpDownCounter | Sum | Sum |
| Gauge | Last Value | Gauge |
| Asynchronous Gauge | Last Value | Gauge |
| Histogram | Explicit Bucket Histogram | Histogram |
A Counter that records 1 five times can therefore produce a Sum of 5, while
a Histogram can turn many recorded values into a count, sum, and bucket
distribution.
Different combinations of attribute values produce separate time series within the resulting metric data, which we'll discuss in more detail when we cover attributes and cardinality.
Understanding aggregation temporality
Aggregation temporality describes the period of time represented by an aggregated value.
OpenTelemetry supports two temporalities for Sums, Histograms, and Exponential Histograms: delta and cumulative.
With delta temporality, each data point represents only the Measurements from the latest collection interval, while cumulative temporality represents Measurements accumulated since a common starting time:
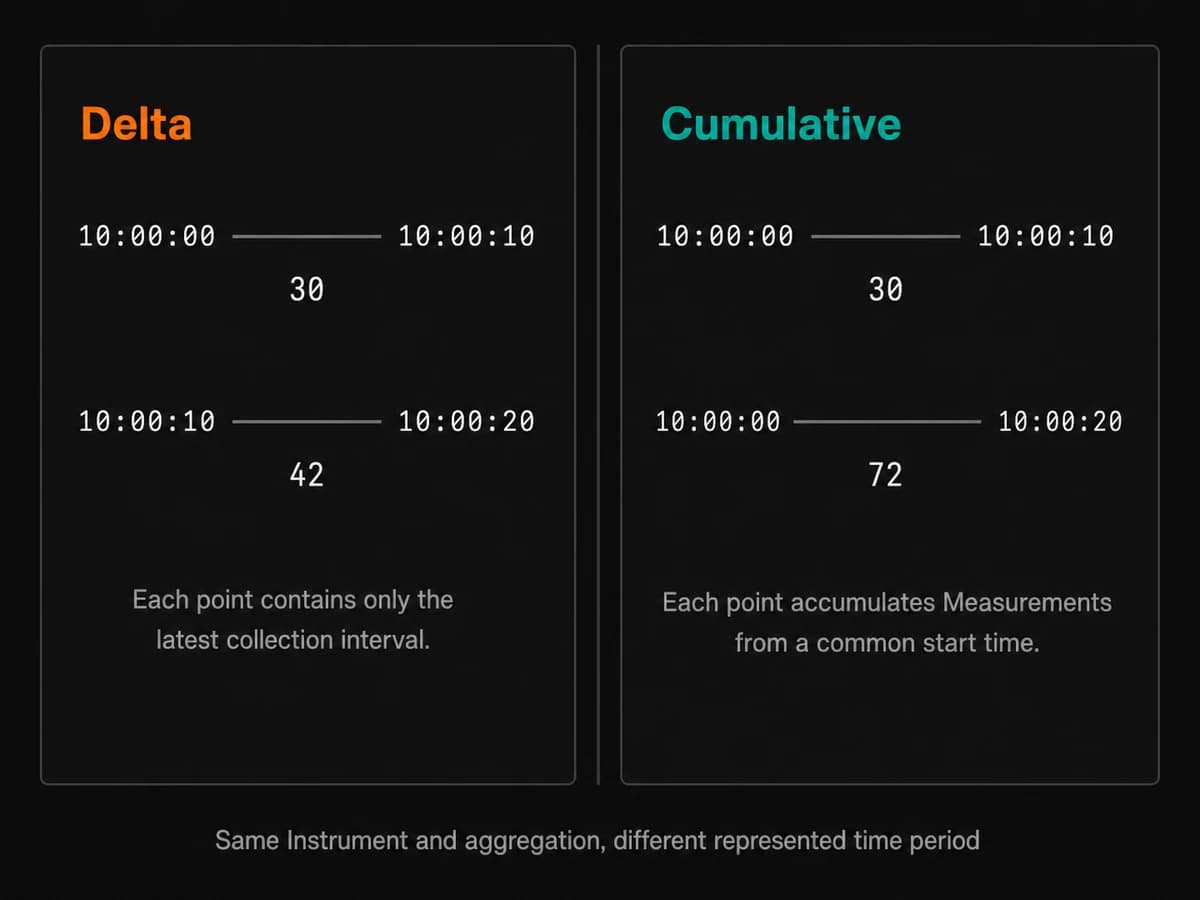
The Instrument and aggregation don't change and a Counter still uses a Sum aggregation in both cases. Temporality only changes the time period represented by that Sum.
Cumulative is the OTLP exporter's default, and it's the right default. It matches how Prometheus has always treated counters, and a dropped export doesn't cost you anything permanent because the next cumulative value still carries whatever happened during the gap.
Delta temporality can be useful when you want the producing application to retain less aggregation state, particularly for synchronous Counters and Histograms with high-cardinality attributes. It also shifts the cost of building cumulative series downstream, which can be useful for short-lived or high-churn workloads.
The OpenTelemetry SDK exposes this choice through
OTEL_EXPORTER_OTLP_METRICS_TEMPORALITY_PREFERENCE:
export OTEL_EXPORTER_OTLP_METRICS_TEMPORALITY_PREFERENCE=deltaThe supported values are:
cumulative: use cumulative temporality for all applicable Instruments. This is the default.delta: use delta temporality for Counters and Histograms where appropriate, while Instruments such as UpDownCounters remain cumulative.lowmemory: prefer delta for synchronous Counters and Histograms while avoiding some of the state required to convert asynchronous cumulative values into deltas.
If your backend expects cumulative metrics but your applications emit deltas, you can convert them in an OpenTelemetry Collector with the deltatocumulativeprocessor. That's usually the least disruptive place to fix a mismatch, since it doesn't require redeploying every service.
What a metric data point actually contains
A metric data point is the aggregated representation that OpenTelemetry exports as part of a metric stream.
You don't create these points directly. You record Measurements, and the SDK produces the appropriate data points when metrics are collected.
OpenTelemetry defines four primary data point kinds:
- Sum represents an additive total. Counters and UpDownCounters use Sum aggregation by default. Counter sums are monotonic, while UpDownCounter sums aren't.
- Gauge represents a sampled value at a particular point in time. It doesn't have aggregation temporality because there is no running total.
- Histogram summarizes a population of Measurements using a count, sum, and bucket distribution.
- Exponential Histogram represents the same kind of distribution as a Histogram, but uses base-2 exponential buckets instead of fixed explicit boundaries.
For example, suppose a Histogram records these values during one collection interval:
0.18
0.24
0.42
0.63
0.91
With an Explicit Bucket Histogram aggregation, those Measurements could become:
{
  "attributes": {
    "order.payment_method": "card"
  },
  "start_time_unix_nano": 1731066000000000000,
  "time_unix_nano": 1731066010000000000,
  "count": 5,
  "sum": 2.38,
  "bucket_counts": [2, 1, 2],
  "explicit_bounds": [0.25, 0.5]
}
The individual Measurements are no longer present. Instead, the data point contains an aggregated representation of the values recorded during that interval.
OTLP also supports legacy Summary data points for compatibility with systems that precompute quantiles, but new OpenTelemetry instrumentation should use Histograms instead.
Correlating metrics with traces using exemplars
Exemplars let you connect aggregated metric data to individual Measurements that contributed to it.
You don't record exemplars through a separate API. Instead, the Metrics SDK samples eligible Measurements and exports selected ones alongside the aggregated metric data.
OpenTelemetry defines three exemplar filters:
trace_basedconsiders Measurements recorded in the context of a sampled span.always_onmakes every Measurement eligible.always_offdisables exemplar sampling.
The filter can be configured through the standard OTEL_METRICS_EXEMPLAR_FILTER
environment variable:
export OTEL_METRICS_EXEMPLAR_FILTER=trace_basedWith trace-based sampling, an exported exemplar can retain the trace and span IDs associated with the original Measurement:
{
  "exemplars": [
    {
      "time_unix_nano": 1731066005000000000,
      "value": 2.34,
      "span_id": "a1b2c3d4e5f60718",
      "trace_id": "0af7651916cd43dd8448eb211c80319c"
    }
  ]
}
If your observability backend supports exemplars, it can use those IDs to link a metric data point back to a representative trace.
Describing your service with resources
A Resource is a set of attributes that describes the entity producing your
telemetry, such as a service, process, container, or host.
Resources are shared across metrics, traces, and logs, which gives all three signals a consistent way to identify where telemetry came from.
You usually configure a Resource when the application starts and attach it to
the MeterProvider:
import {
  defaultResource,
  resourceFromAttributes,
} from "@opentelemetry/resources";
import { MeterProvider } from "@opentelemetry/sdk-metrics";
import {
  ATTR_SERVICE_NAME,
  ATTR_SERVICE_VERSION,
} from "@opentelemetry/semantic-conventions";

const serviceResource = resourceFromAttributes({
  [ATTR_SERVICE_NAME]: "checkout-service",
  [ATTR_SERVICE_VERSION]: "1.2.0",
});

const resource = defaultResource().merge(serviceResource);

const meterProvider = new MeterProvider({
  resource,
});
The defaultResource() function provides the SDK's default Resource, but it
doesn't automatically discover host, process, container, or cloud metadata. That
information comes from Resource detectors, which can run in the SDK or later in
an OpenTelemetry Collector.
In production, the Collector is also commonly used to enrich telemetry with infrastructure context through components such as the resource detection processor and Kubernetes attributes processor.
Using attributes and semantic conventions
Resources describe the entity producing telemetry, while attributes attached to Measurements add context about the individual values being recorded.
For example:
completedOrders.add(1, {
  "order.payment_method": order.paymentMethod,
});
Here, order.payment_method lets you break the resulting metric down by payment
method.
When OpenTelemetry already defines a standard name for the telemetry you're recording, use its Semantic Conventions.
Semantic conventions provide consistent names for common concepts such as HTTP requests, database operations, messaging, processes, and infrastructure. That consistency makes telemetry easier to query across services and easier for observability backends to interpret.
Before introducing a custom metric or attribute name, check whether a semantic convention already exists. For application-specific concepts that OpenTelemetry can't define generically, custom attributes are appropriate.
Managing attribute cardinality
Each distinct combination of metric attribute values can produce a separate time series. For example, this attribute has a small number of likely values:
order.payment_method = card | bank_transfer | walletBut an attribute such as user.id would produce a new time series for every
user.
This matters for both application overhead and observability cost. OpenTelemetry SDKs need to maintain aggregation state for each active attribute combination, while many observability backends price metrics partly according to the number of time series, metric samples, or data points they ingest and retain.
As a result, adding an attribute can have a multiplicative effect. A metric with 10 routes, 5 status codes, and 4 regions can potentially produce:
10 × 5 × 4 = 200 time seriesAdding a customer.id attribute with 10,000 possible values could increase that
theoretical space to:
10 × 5 × 4 × 10,000 = 2,000,000 time seriesOpenTelemetry SDKs protect the application from unbounded aggregation state with cardinality limits. The Metrics SDK specification defines a default limit of 2,000 attribute combinations per metric stream. Once that limit is exceeded, additional combinations are merged into an overflow data point marked with:
otel.metric.overflow = trueThat protects process memory, but it doesn't solve the underlying problem. You lose the original dimensional breakdown, and your backend can still see large numbers of time series across many processes and metric streams.
Treat cardinality limits as a safety net, not a substitute for choosing attributes carefully.
Shaping your metrics with views
Views let you override how metric streams are produced without changing the instrumentation that records them.
While instrumentation authors can provide advisory configuration, such as suitable Histogram bucket boundaries, because they understand the metric's unit and expected range, Views let the end user override those recommendations when the deployment needs something different.
For example, you might inherit a Histogram from a library whose recommended boundaries don't suit your workload. A View can replace them:
import { AggregationType, MeterProvider } from "@opentelemetry/sdk-metrics";

const latencyView = {
  instrumentName: "app.orders.processing.duration",
  aggregation: {
    type: AggregationType.EXPLICIT_BUCKET_HISTOGRAM,
    options: {
      boundaries: [0.01, 0.05, 0.1, 0.5, 1, 5, 10],
    },
  },
};

const meterProvider = new MeterProvider({
  views: [latencyView],
});
Because the View explicitly selects an Explicit Bucket Histogram aggregation, its boundaries override any advisory boundaries supplied when the Instrument was created.
Views can also remove attributes you don't need which is useful when an Instrument you don't control produces dimensions that would create unnecessary time series. Here, only the listed attributes are retained for matching Instrument:
import {
  MeterProvider,
  createAllowListAttributesProcessor,
} from "@opentelemetry/sdk-metrics";

const ordersView = {
  instrumentName: "app.orders.*",
  attributesProcessors: [
    createAllowListAttributesProcessor([
      "order.payment_method",
      "order.fulfillment_type",
    ]),
  ],
};

const meterProvider = new MeterProvider({
  views: [ordersView],
});
Views can target Instruments by properties such as name, type, unit, or Instrumentation Scope. Depending on the SDK, you can also use wildcard selectors to apply the same configuration to groups of Instruments.
Other common uses for Views include:
- Changing an Instrument's aggregation.
- Renaming the resulting metric stream.
- Changing its description.
- Removing unwanted attributes.
- Dropping an Instrument entirely.
Views are most useful when the transformation belongs close to the source. For changes that need to apply consistently across many services, the OpenTelemetry Collector is often a better fit.
Exporting metrics to your observability backend
Once the SDK has aggregated your Measurements into metric data points, those
metrics need to be collected and sent somewhere. OpenTelemetry separates these
responsibilities between a MetricReader and a MetricExporter.
A MetricReader collects metric data from the SDK. Different readers support
different collection models. For example, a PeriodicExportingMetricReader
collects metrics at regular intervals for push-based export.
A MetricExporter sends the collected metric data to its destination. OTLP exporters, for example, encode the metrics using the OpenTelemetry Protocol and send them to a Collector or directly to a compatible backend.
Here's an example using the JavaScript SDK to periodically export metrics over OTLP/HTTP:
import { metrics } from "@opentelemetry/api";
import {
  MeterProvider,
  PeriodicExportingMetricReader,
} from "@opentelemetry/sdk-metrics";
import { OTLPMetricExporter } from "@opentelemetry/exporter-metrics-otlp-http";

const exporter = new OTLPMetricExporter({
  url:
    process.env.OTEL_EXPORTER_OTLP_METRICS_ENDPOINT ||
    "http://localhost:4318/v1/metrics",
});

const reader = new PeriodicExportingMetricReader({
  exporter,
  exportIntervalMillis: 60_000,
});

const meterProvider = new MeterProvider({
  readers: [reader],
});

metrics.setGlobalMeterProvider(meterProvider);

process.on("SIGTERM", async () => {
  await meterProvider.shutdown();
});
The PeriodicExportingMetricReader collects metrics at the configured interval
(60 seconds by default) and passes them to the OTLP exporter. The exporter then
sends the resulting metric data to the configured endpoint.
Applications can export OTLP directly to an observability backend. A Collector is useful when you need centralized processing, routing, buffering, or backend configuration.
Final thoughts
OpenTelemetry metrics become much easier to work with once you separate the different layers involved.
You record Measurements through Instruments. The SDK aggregates those
Measurements into metric data points, applies temporality where relevant, and
exports the resulting metric streams through a MetricReader and
MetricExporter.
From there, useful metrics depend heavily on the choices made at instrumentation time: selecting the right Instrument, using meaningful attributes, following semantic conventions where they apply, and controlling cardinality before it becomes a problem.
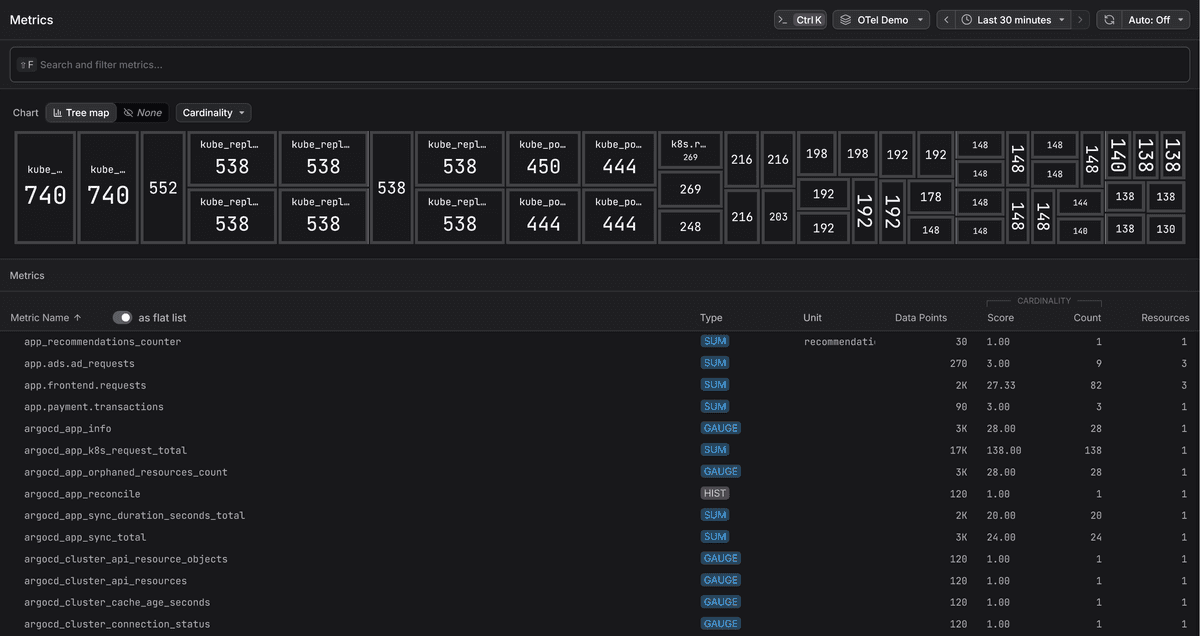
As you implement OpenTelemetry metrics in your services, consider how an OTLP-native observability solution like Dash0 can help you collect, explore, and correlate metrics with traces and logs.