Last updated: January 17, 2026
Log Levels Explained: A Better Strategy with OpenTelemetry
Fewer parts of logging generate more confusion and debate than deciding how to use severity levels.
Some folks advocate for simplifying things by sticking to INFO and ERROR, but logging needs are rarely that binary.
Most events live somewhere between "everything is fine" and "wake someone up now", and collapsing those hides important clues during diagnosis and triage.
A fuller set of levels gives you space to express what is routine, what is unusual, and what is genuinely broken. It also helps keep verbosity under control, so you can raise or lower detail intentionally instead of logging everything all the time.
This article will break down how log levels fit into a modern logging strategy, how OpenTelemetry standardizes them across your entire infrastructure, and how to avoid the common mistakes that undermine their value.
Why legacy severity models fail in distributed systems
Most of the log levels in use today trace back to
Syslog, which introduced a standardized
set of severities in Unix systems decades ago. That model shaped how logging
evolved across languages and platforms, and that's why terms like DEBUG,
INFO, WARN, and ERROR feel so familiar.
In practice, though, log levels have never been truly standardized. Different libraries interpret them differently, some frameworks omit levels entirely, and teams often redefine their meaning over time.
What one service logs as WARN, another might log as ERROR. Some systems
collapse levels, others invent custom ones, and many logs arrive without any
explicit severity at all.
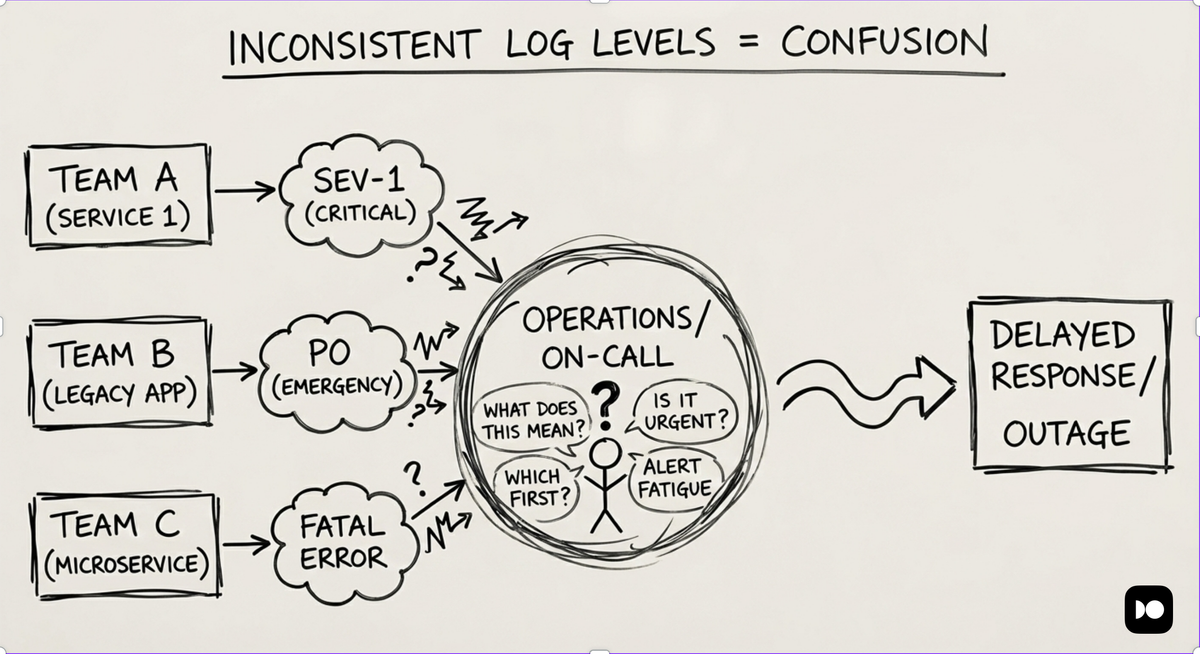
This inconsistency becomes a real problem in distributed systems. When logs from dozens of services, languages, and runtimes are aggregated, severity labels alone are no longer reliable. Filtering, alerting, and analysis all depend on shared semantics, and ad hoc conventions do not scale.
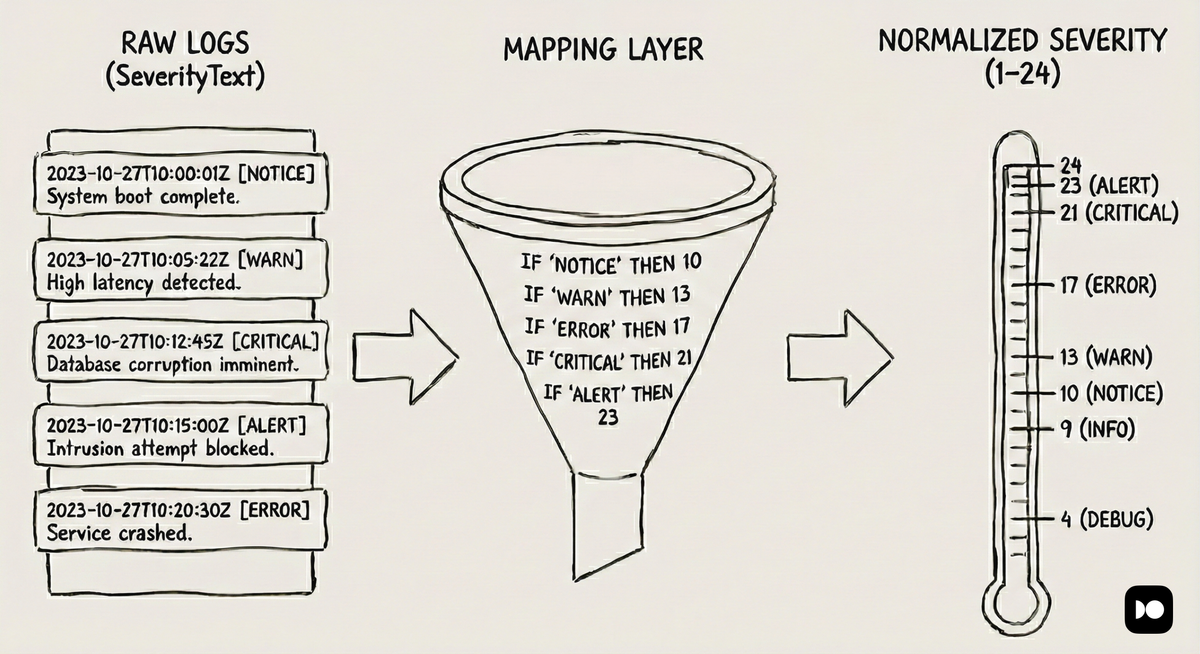
OpenTelemetry addresses this by defining a common severity model that goes beyond textual labels. Alongside a severity name, each log entry carries a normalized numeric value that represents its relative importance. This makes it possible to compare, filter, and alert on logs consistently, regardless of where they originated or which logging library produced them.
With a shared standard in place, severity levels stop being loose conventions and become a dependable signal across the entire system.
Let's start by examining the most common levels and how they should be used in practice.
| Level | When to use | Action required |
|---|---|---|
TRACE | Granular execution flow (loop steps, large payloads). | None |
DEBUG | Diagnostic state for specific contexts. | None |
INFO | A standard business or operational event occurred. | None |
WARN | System is functioning, but with degradation risk | Create ticket |
ERROR | A request or operation failed, but the application is still running | Alert on spikes/trends |
FATAL | The application cannot start or must terminate immediately. | Alert immediately |
TRACE and DEBUG: Detailed information for troubleshooting
TRACE and DEBUG logs provide detailed diagnostic information that's most
useful during development and troubleshooting.
They expose internal application logic, decision paths, variable values, and other state details that help you understand how the system is functioning and interacting with other systems.
These levels are usually disabled in production because of their verbosity and performance impact, but they remain essential when troubleshooting difficult issues.
While TRACE is nominally more fine-grained than DEBUG, many libraries and
teams treat the two levels interchangeably, effectively collapsing the
distinction.
When to use TRACE and DEBUG
Use TRACE or DEBUG when the goal is to understand detailed execution paths
or internal system behavior, for example:
- During local development to understand code flow without using a debugger.
- Logging entry and exit of functions along with arguments.
- Capturing variable contents, payloads, or intermediate values.
- Profiling algorithms with step-by-step state changes.
- Logging interactions across services during integration testing.
123456{"level":"TRACE","msg":"enter processOrderRequest","order_id":"ORD-28734"}{"level":"TRACE","msg":"validating inventory item","item_id":"A123","stock":12}{"level":"TRACE","msg":"validating inventory item","item_id":"B456","stock":5}{"level":"DEBUG","msg":"attempting database connection","retries":3,"timeout_ms":5000}{"level":"DEBUG","msg":"user record retrieved","user_id":45678,"status":"active"}{"level":"DEBUG","msg":"shutdown signal received","signal":"SIGTERM","waiting_for_active_connections":true}
INFO: A narrative of normal operations
INFO logs record routine operational events in a service. They describe what
the system is doing under normal conditions and often correspond to meaningful
business-level actions.
It's typically the default level in most logging frameworks because it captures normal system behavior without introducing unnecessary detail.
When to use INFO
Use INFO when capturing meaningful but non-problematic behavior, such as:
- Successful API or service operations.
- Incoming service requests.
- Configuration or state changes.
- Maintenance tasks or scheduled jobs.
123456{"level":"INFO","msg":"database connection established","database":"users_db"}{"level":"INFO","msg":"order created successfully","order_id":"ORD-28734","customer_id":12345,"items_count":3,"total":129.99}{"level":"INFO","msg":"payment processed","payment_id":"PMT-9876","amount":129.99,"method":"credit_card"}{"level":"INFO","msg":"configuration updated","environment":"production","updated_keys":["session_timeout","max_connections"]}{"level":"INFO","msg":"scheduled database backup completed","success":true,"size_mb":1254,"location":"s3://backups/db-20250512.bak"}{"level":"INFO","msg":"server shutdown initiated","mode":"graceful"}
WARN: Potential issues requiring attention
WARN logs occupy a specific niche: they describe state that is technically
valid but practically undesirable. The golden rule for WARN is actionability.
If a developer sees this log, is there a specific task they should eventually
perform? If the answer is "no, that just happens sometimes", it belongs in
INFO (or DEBUG).
A common mistake is logging every automatic retry as a WARN. In production
systems, transient network blips are normal. If your system successfully retries
and recovers, that is standard behavior so log it as INFO.
WARN should be reserved for when you are nearing a failure threshold or when a
fallback mechanism with lower fidelity is triggered.
When to use WARN
Use WARN when an event requires eventual human review but no immediate
intervention:
- Resource usage nearing critical thresholds.
- Deprecated APIs or features being exercised.
- Misconfigurations or fallback behavior that still allow the system to function.
- Slower-than-expected behavior from dependencies.
12345{"level":"WARN","msg":"database connection pool nearing capacity","current":85,"max":100}{"level":"WARN","msg":"slow database query detected","duration_ms":3250,"query":"SELECT * FROM orders WHERE created_at > ?"}{"level":"WARN","msg":"deprecated API endpoint used","endpoint":"/api/v1/users"}{"level":"WARN","msg":"disk space running low","usage_percent":85,"threshold":80,"path":"/var/log"}{"level":"WARN","msg":"API rate limit threshold approaching","client_id":"45AC78B3","current_rate":178,"limit":200,"window":"1m"}
ERROR: Problems impacting functionality
ERROR logs indicate failures that prevent an operation from completing as
expected. It means the service is still running, but a specific action has
failed.
A single error is not always cause for alarm, but repeated failures in a short period often indicate deeper issues that warrant investigation.
Handled or recoverable failures that eventually succeed, such as retries or
fallback paths, are usually better logged as INFO. ERROR should be reserved
for cases where the operation ultimately fails.
Effective error logs should include enough context to explain what was attempted, what failed, and why. Without that context, errors are difficult to diagnose and easy to misinterpret.
When to use ERROR
Use ERROR when an operation fails or cannot be completed, for example:
- External or internal dependencies fail.
- Operations cannot be completed.
- Requests time out or permissions are denied.
1234{"level":"ERROR","msg":"payment processing failed","user_id":45678,"amount":129.99,"error_code":"GATEWAY_TIMEOUT"}{"level":"ERROR","msg":"notification email delivery failed","user_id":45678,"error":"SMTP connection refused"}{"level":"ERROR","msg":"database query failed","query":"UPDATE users SET status = ? WHERE id = ?","error":"lock wait timeout exceeded"}{"level":"ERROR","msg":"file upload could not be processed","filename":"report.xlsx","reason":"invalid or corrupt format"}
FATAL: When your application can't continue
FATAL logs represent unrecoverable conditions that cause the application to
terminate by design. They exist to document why a process exited, not to prevent
it from doing so.
In containerized and serverless environments, recovery is handled by the platform. When the application reaches a state it cannot safely continue from, it should exit immediately and allow the orchestrator to restart it.
FATAL logs are useful for explaining these intentional crashes during startup
or invariant violations, and where understanding the exit reason matters for
subsequent diagnosis.
When to use FATAL
Use FATAL when the system is in a non-recoverable state, for example:
- Required configuration, secrets, or encryption keys are missing at startup.
- A security invariant is violated and continued execution would be unsafe.
- Data corruption or integrity checks fail.
- The application detects a state it was explicitly designed to never recover from.
123{"level":"FATAL","msg":"required encryption keys missing, exiting"}{"level":"FATAL","msg":"database unavailable after startup checks, exiting","retries":10}{"level":"FATAL","msg":"data integrity check failed, exiting","check":"user_index_consistency"}
How OpenTelemetry standardizes log levels
Traditionally, log severity has been represented almost entirely through textual
labels. Whether a log is marked as WARN, ERROR, or CRITICAL depends on the
logging library, the language, and often the preferences of the team that wrote
the code.
However, once these logs are aggregated across services, those labels alone are not enough to reason about severity consistently.
OpenTelemetry addresses this by defining a severity model that separates what a log was called from how severe it actually is. Its log data model introduces two complementary fields to describe log severity:
-
SeverityText: A textual label such asINFO,ERROR, orWARNas emitted by the source logging framework. Because this value originates at the source, it carries no standardized meaning on its own. Different libraries and teams may use the same label to mean very different things, so OpenTelemetry treats it primarily as informational. -
SeverityNumber: A numeric value between 1 and 24 that represents the relative severity of the log record. This is the authoritative signal used by OpenTelemetry-aware tooling for filtering, comparison, and alerting. By relying on numbers rather than names, severity becomes consistent across languages, runtimes, and logging frameworks.
Each severity category maps to a defined numeric range:
| SeverityNumber Range | Category |
|---|---|
| 1-4 | TRACE |
| 5-8 | DEBUG |
| 9-12 | INFO |
| 13-16 | WARN |
| 17-20 | ERROR |
| 21-24 | FATAL |
Within a category, higher numbers represent greater severity. For example, an
ERROR log with a SeverityNumber of 18 signals a more serious condition than
one with a value of 17. This allows
OpenTelemetry-native tools
to order, threshold, and compare log records with more precision than name-based
levels alone.
Compatibility with existing logging systems
This severity model is designed to interoperate with existing logging standards rather than replace them. Legacy systems like Syslog already define a hierarchy of severities, and OpenTelemetry provides a clear mapping between those levels and its own severity ranges:
| Syslog | OpenTelemetry | SeverityNumber |
|---|---|---|
| Emergency | FATAL | 24 |
| Alert | FATAL | 23 |
| Critical | FATAL | 21 |
| Error | ERROR | 19 |
| Warning | WARN | 14 |
| Notice | INFO | 12 |
| Informational | INFO | 9 |
| Debug | DEBUG | 5 |
Rather than relying on name matching, this mapping prioritizes semantic
equivalence. For example, both Notice and Informational map to INFO, but
Notice is assigned a higher severity number to reflect its greater operational
significance. Likewise, Emergency, Alert, and Critical are all treated as
FATAL, while still preserving their relative urgency through distinct numeric
values.
Once severity is normalized across your entire infrastructure, log analysis and interpretation becomes far simpler and more reliable. You no longer need to guess what a given label means or maintain per-library translation rules. Instead, you can operate directly on severity numbers.
In Observability tools, this enables precise queries and alerts that work across all log sources. For example, to view every log that represents an error or worse, regardless of which service or framework produced it, you can filter using:
1SeverityNumber >= 17
This approach turns log levels from loose conventions into a dependable signal that scales with cloud-native and distributed systems.
Mapping existing severity labels to OpenTelemetry
In an ideal world, every log record would arrive in your observability pipelines with the correctly populated severity fields. In practice, however, most systems start from existing logs that were never designed with distributed systems in mind.
OpenTelemetry was explicitly designed to accommodate this reality. When logs are
ingested through OpenTelemetry SDKs or
log bridges,
common log levels are automatically mapped to appropriate SeverityNumber
values based on their semantic meaning to ensure consistency and preserve
severity information as logs move downstream.
However, not all ingestion paths provide enough information to do this automatically. When logs are collected from files, streams, or external systems using generic receivers, severity information is often missing, inconsistent, or ambiguous.
In those cases, an explicit mapping step becomes necessary in the OpenTelemetry Collector. Depending on how logs are produced and collected, this may involve:
- Configuring receivers or processors to translate textual levels into numeric severity.
- Normalizing custom or nonstandard levels into the closest OpenTelemetry category.
- Detecting and enriching logs that implicitly encode severity within the message body.
The goal is not to rewrite all existing logging overnight, but to progressively align with OpenTelemetry's model so that your logs become a reliable signal across the entire system.
Once this alignment is in place, filtering, alerting, and analysis no longer depend on the quirks of individual libraries or teams. Instead, they operate on a shared definition of what each log level actually means.
Embracing dynamic log level control
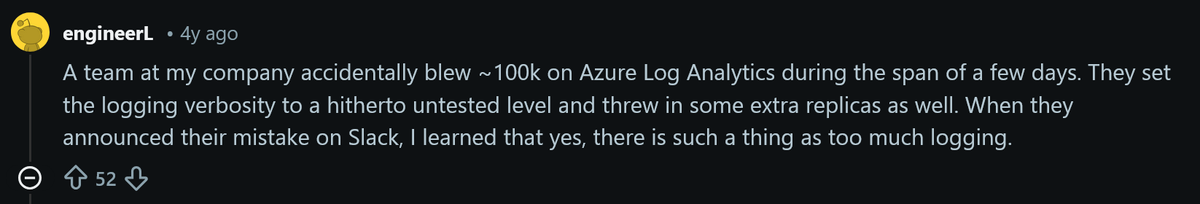
Traditional approaches to log levels often create a frustrating paradox: either you log too little and miss critical clues during an incident, or you log too much and suffer performance hits or ballooning observability costs.
In many systems, log levels are treated as static configuration. They're set at deploy time and rarely changed without a full redeploy. This rigidity slows down troubleshooting and limits visibility precisely when it is needed most.
Modern observability practices address this with dynamic log level control,
which allows verbosity to be adjusted at runtime without redeploying or
restarting services. Instead of turning on DEBUG logging everywhere, you can
temporarily increase detail only where it is needed.
This makes it possible to:
- Raise log verbosity for a single service or component.
- Scope detailed logging to a specific request, user, or transaction.
- Capture additional context during a live incident, then revert to normal levels once the issue is understood.
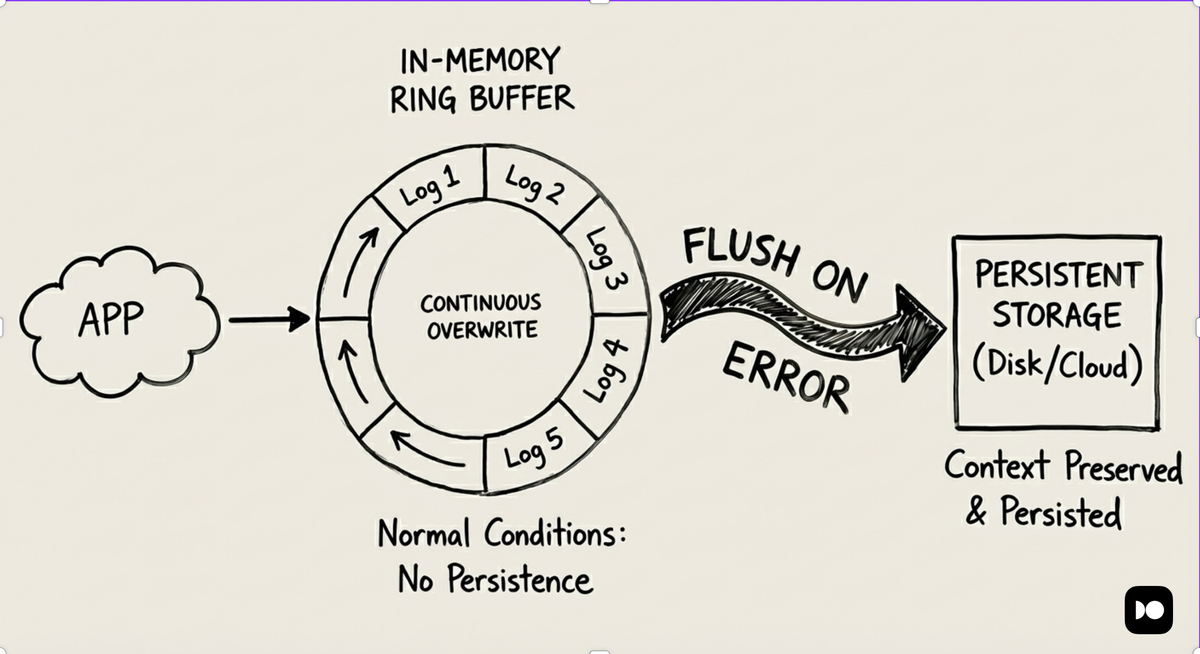
Some logging frameworks also support writing detailed logs continuously into an
in-memory ring buffer. Under normal conditions, the buffer simply overwrites
itself and nothing is persisted. If an ERROR or FATAL condition occurs, the
buffer is flushed alongside the error log, preserving the context leading up to
the failure without incurring ongoing volume or cost.
By limiting both the scope and lifetime of verbose logging, teams can capture rich diagnostic detail when it matters most, while keeping the steady-state logging path lean and predictable.
Making log levels actionable
On their own, log levels are just severity labels attached to log entries. They become far more useful when your observability tools act on them for filtering, visual prioritization, and alerting.
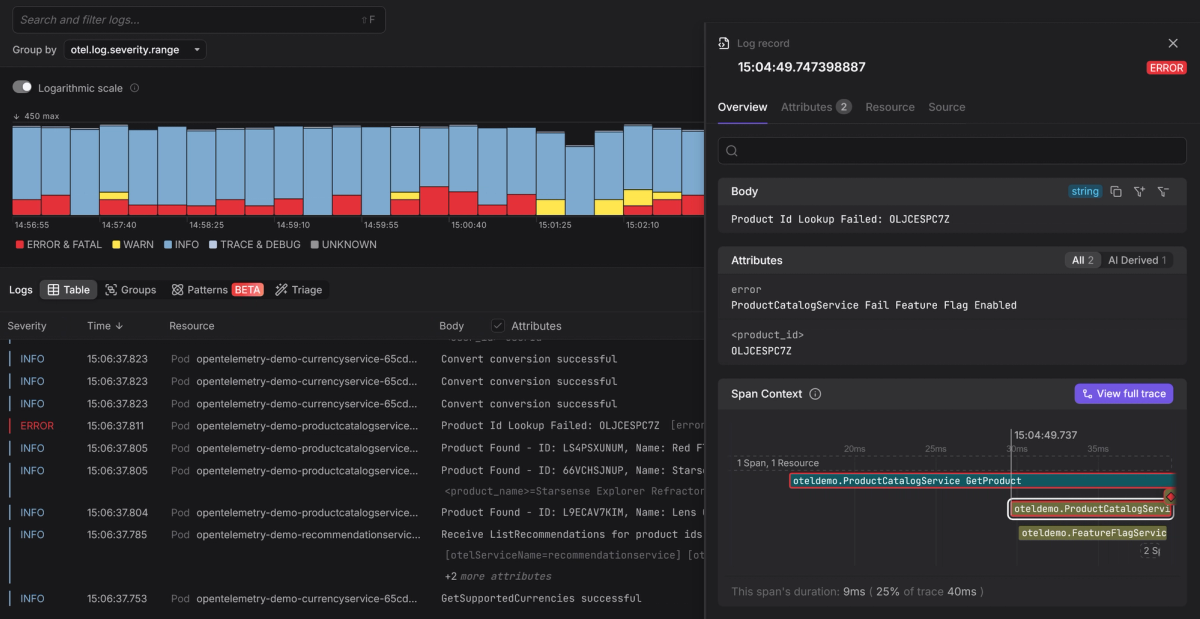
At Dash0, severity levels are presented as a clear visual hierarchy that helps guide attention at a glance. This follows our deliberate data-in-color philosophy:
- Red highlights error and fatal logs that demand immediate attention.
- Yellow surfaces warnings that may indicate emerging issues.
- Gray keeps informational and debug logs in the background unless you intentionally drill into them.
Log levels also play a central role in alerting. While FATAL events usually
warrant immediate notification, many real-world problems emerge gradually.
Spikes in ERROR logs or sustained increases in WARN entries often signal a
degrading service well before it reaches a hard failure. Alerting on these
patterns is usually more effective than reacting to individual events.
Context is what makes this actionable in practice. A DEBUG or INFO log is
rarely useful in isolation, but becomes valuable when it can be tied to the same
request as an ERROR that occurred moments later in another service.
OpenTelemetry enables this by
propagating trace context alongside logs,
allowing logs to be grouped and explored by request instead of as disconnected
events.
This makes it possible to start from an error, identify the affected traces, and
inspect related DEBUG or TRACE logs only for those requests. Instead of
increasing verbosity globally, you get depth exactly where it is needed.
Final thoughts
Log levels are a small but important part of a sound logging strategy. Used well, they convey intent, control verbosity, and make system behavior easier to understand without overwhelming engineers with noise.
OpenTelemetry reinforces this by standardizing severity through SeverityText
and SeverityNumber, making log levels consistent across languages, frameworks,
and services and enabling reliable analysis at scale.
Log levels are not the primary value of a log entry, but when used consistently, they help separate routine behavior from real issues and surface detailed context only when it's genuinely needed.
Reducing everything to a single "normal" and "error" bucket discards that signal without providing any real benefit.
Thanks for reading!
