Last updated: April 24, 2026
Traces vs Logs for Debugging Distributed Systems
Logs and traces provide you with two different perspectives on system behavior.
Logs record that something happened at a particular moment inside a particular process. They're like individual diary entries that capture local context, errors, state, and internal decisions within a service.
On the other hand, traces are structured hierarchical workflows that follow a single request as it moves across service boundaries, from the edge of your system all the way to downstream dependencies. Instead of isolated events, you get a connected graph that shows which component called which, in what order, and how long each step took.
One tells you what happened inside a service. The other shows you how various services and their dependencies interacted together to produce a result.
This article will help you understand the strengths and limitations of each signal, and guide their usage in a way that gives you clarity instead of confusion.
Logs vs traces: understanding the key differences
The table below summarizes their core differences between logs and traces. It highlights not just how they capture data, but what kinds of questions each one is best suited to answer:
| Dimension | Logs | Traces |
|---|---|---|
| Primary focus | Discrete events and detailed context | End-to-end request flow and causality |
| Data model | Independent time-ordered records | Hierarchical graph of spans |
| Scope | Local to a single process | Distributed by design |
| Strength | Rich detail and internal state | Relationships and latency across components |
| Context propagation | Requires explicit correlation | Built-in trace and span IDs |
| Failure analysis | Shows local error details | Shows where failure originated and propagated |
| Visualization | Search and filter results | Waterfall timelines and service maps |
This comparison is useful, but it can still feel abstract. To understand why these differences matter, it helps to look at each signal in more detail and see how it behaves in real systems.
Logs describe what happened at a moment in time
A log is a deliberate record of something your code chose to surface. It captures an event at a precise instant inside a running process. That event could be a request beginning, an external call failing, a background task finishing, or a validation rule rejecting input.
A log only exists because someone decided that this state of the application was worth recording. But what makes logs powerful is not the fact that they exist, but what you put into them.
A log entry can include identifiers, configuration values, payload details, error codes, or stack traces. The richer and more intentional that context is, the more useful the log becomes later.
When you are troubleshooting, logs help you answer practical questions:
- What did the code actually execute?
- What data did it receive?
- Which path did it follow?
- What outcome did it produce?
They provide insight into the internal behavior of your application at a level that other signals scarcely capture.
In the not too distant past, application logging meant writing plain text lines to a log file:
12026-02-12 10:00:00 ERROR Product Id Lookup Failed: OLJCESPC7Z
This worked fine when applications were small and ran on a single machine. You could SSH into a server, open a log file, and scroll until you found something interesting.
In modern distributed systems where dozens or hundreds of services are each writing thousands of log lines per second, that approach breaks down quickly. Free-form text quickly turns into noise, and extracting meaning often depends on brittle string searches and ad hoc parsing.
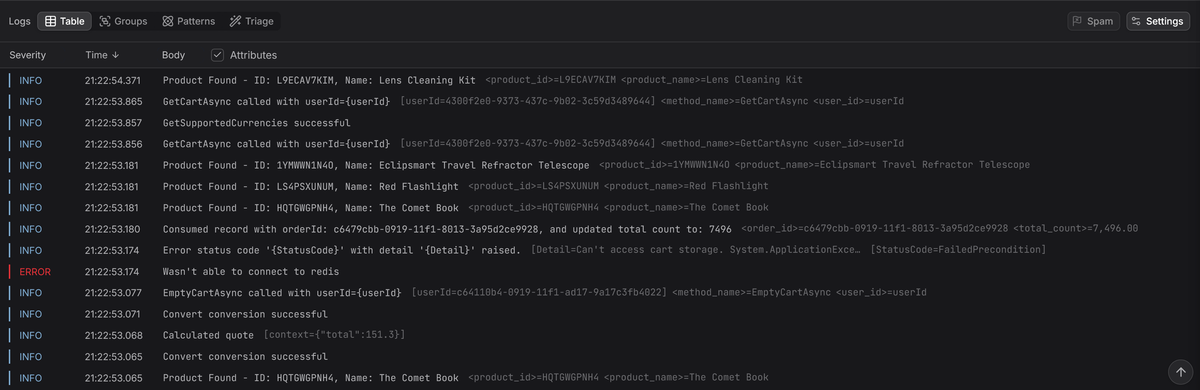
This is why structured logging has become the standard. Instead of writing a sentence that a human must read and interpret, you emit machine-readable fields (usually in JSON format) that can be queried directly:
12345678{"timestamp": "2026-02-12T10:00:00Z","level": "ERROR","service": "product-catalog","message": "Product Id Lookup Failed","product_id": "OLJCESPC7Z","error_code": "insufficient_funds"}
When ingested by an observability platform, you can filter, aggregate, and query logs with precision instead of relying on fragile keyword searches or complex regular expressions.
This shift from unstructured text to structured events is one of the most consequential advances in recent years. It's what transforms logs from a legacy debugging artifact into a first-class signal for observability.
And it's exactly what you need when things go wrong in distributed systems running across ephemeral infrastructure, where context disappears quickly and accurate diagnosis determines how fast you recover.
When logs are the right tool
Logs shine when you need precise, contextual detail. If you need to see the exact input that triggered a failure, the full error message returned by a dependency, or the internal state of your application at a given moment, logs are usually the most direct and reliable source of truth.
Another major strength of logs is their ability to handle high-cardinality data. Recording order IDs, email addresses, transaction hashes, or session tokens is perfectly reasonable in logs. Each entry can safely carry unique identifiers without destabilizing your storage model.
Metrics systems, on the other hand, are optimized for aggregation. Attaching a unique user ID or request ID as a metric label can create an explosion of time series, dramatically increasing storage and query costs. Logs don't have that limitation, which makes them a natural home for request-scoped and user-scoped identifiers.
Logs also extend far beyond day-to-day debugging. They form the backbone of audit trails that record who performed which action and when. Because they provide a durable, chronological account of activity across your system, they are essential for security investigations, compliance requirements, and post-incident reviews.
Where logs fall short
The primary limitation of logs is scope. A log entry tells you what happened inside a single process at a specific moment, but it does not inherently show how that event relates to upstream requests, downstream dependencies, or other work happening concurrently across your system.
In a distributed architecture, one user request might traverse an API gateway, an authentication service, a billing service, a database, and a message queue. When something fails, you are left piecing together fragments from multiple services to determine what actually happened.
That might be manageable at a small scale, but when your system processes thousands of requests per second, using logs alone to reconstruct what happened quickly turns into a manual, error-prone, and time consuming exercise.
To improve this, many teams adopted correlation IDs. The approach was straightforward: generate a unique identifier at the edge of the system and attach it to every log entry produced during that request.
This helped isolate related events, but it introduced operational friction. Every service had to propagate the ID correctly and every log statement needed to include it. If a single link in the chain failed, the context was lost.
Even when everything worked, the output remained a flat list of log entries. You could filter by ID, but you still could not see explicit parent-child relationships or clearly understand how time was distributed across services.
When you need to understand causality, latency distribution, and the origin of a failure within a request chain, you need more than grouped log lines. You need a model that represents relationships directly.
That's where distributed tracing comes in.
Traces describe how a request actually moved through your system
A trace is a Directed Acyclic Graph (DAG) that represents the lifecycle of a single request. Where logs record isolated events, traces models how operations are connected and presents a timeline that tells a coherent story.
Each operation within a trace is called a span, which might represent an incoming HTTP request, a call to another service, a database query, or even a function execution inside your code. Every span has a start time, an end time, a unique identifier, and metadata that describes what happened during that operation.
Every trace includes:
- A trace ID that remains constant from the first service to the last.
- Multiple spans, each with its own span ID, timing information, and metadata.
- Parent-child relationships that establish causality between operations.
If Service A calls Service B, the span created by Service B records the span ID of Service A as its parent. That relationship is what allows observability tools to reconstruct the full execution path.
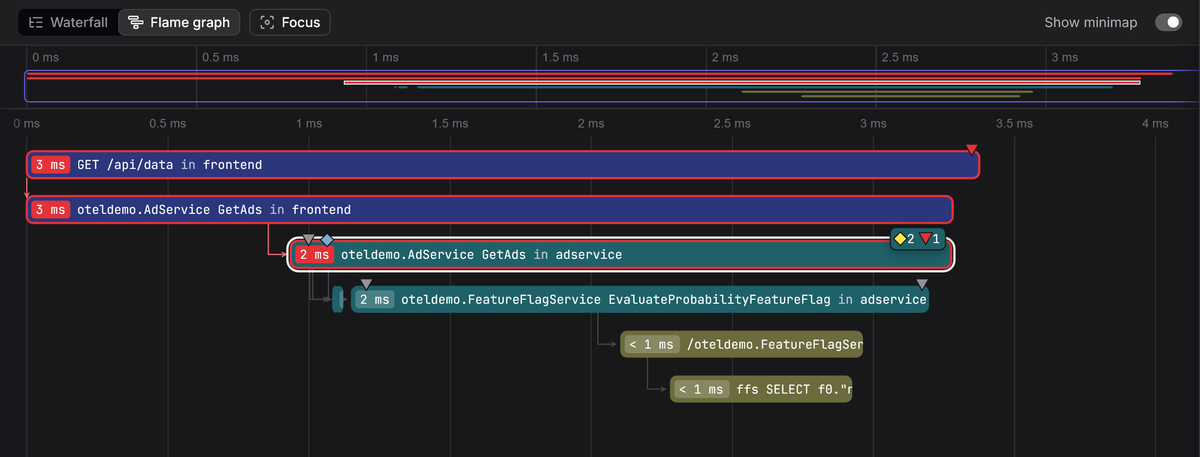
The result is often visualized as a waterfall diagram where you can immediately see which service called which dependency, how long each step took, and where errors or latency originated.
For distributed tracing to work, the trace ID must travel across service boundaries. This is typically done through standardized protocol headers, such as the W3C Trace Context header, which carries the trace ID and parent span ID with each request:
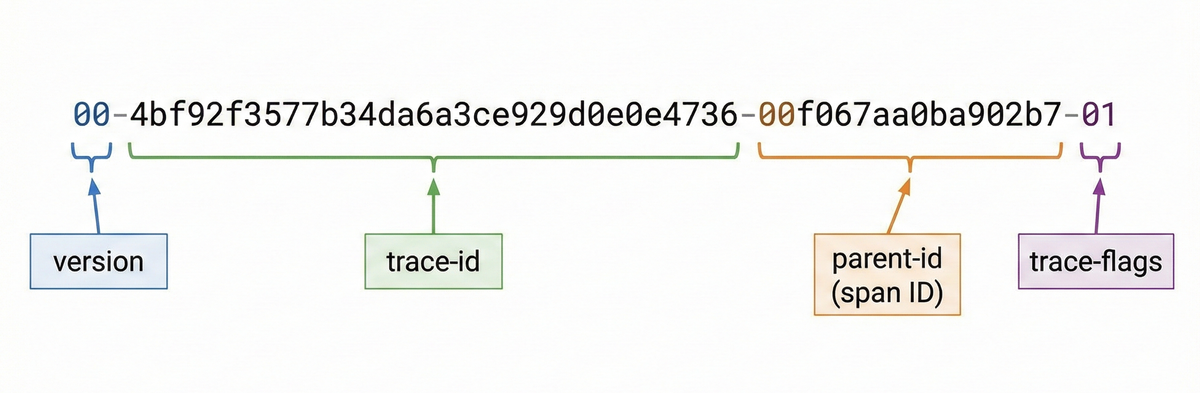
Instrumented services extract that context, create new child spans, and propagate the context downstream. If context propagation breaks at any point, the trace fragments into disconnected pieces.
Traces, then, show you how everything was connected and how the request actually moved through your system.
Why this matters in practice
When something breaks in a distributed system, multiple services often report errors at the same time. An upstream API may return a 500, a downstream service may log a timeout, and a database layer may report connection failures. From the outside, everything can look broken at once.
Metrics confirm that error rates have increased, but they do not explain causality. Logs provide detailed messages, but they're scattered across services and instances, leaving you trying to determine which error is the cause and which ones are side effects.
A trace lays out the full execution path of a single request in order. You can see exactly where the first failure occurred and how subsequent services reacted. Instead of inferring relationships from timestamps, you see causality modeled explicitly.
Traces give you a structured path from symptom to root cause, and that's why they're particularly strong for:
- Identifying the true origin of failures in distributed systems.
- Understanding how requests propagate across services.
- Spotting the slowest or most fragile components in a call chain.
- Separating root causes from downstream symptoms.
When multiple services are reporting problems simultaneously, traces provide a structured view of what actually happened. That structure is often what allows you to regain control quickly.
Why you can't trace everything (usually)
Traces are optimized to model relationships and timing across service boundaries. They're excellent at showing causality and latency, but capturing every detail of every request is usually impractical.
Unlike logs, which have adjustable levels, tracing is all or nothing at the request level. When a request is traced, you'll capture all its spans, attributes, and events. When it is not traced, you'll capture nothing. There's no mechanism that lets you gradually increase or decrease verbosity per request in the same way you would tune log levels.
While span attributes and events make it possible to record every internal variable, every branch decision, and every intermediate state, tracing every request could quickly become expensive from both a performance and storage perspective, especially in high-throughput systems.
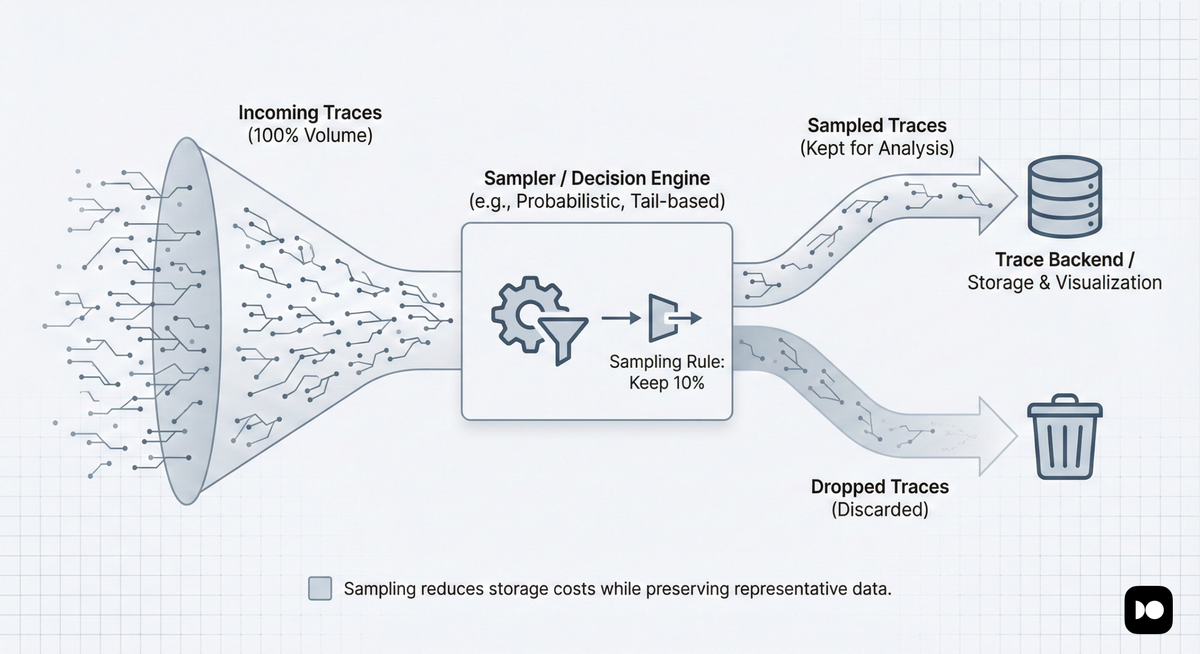
That's why most production systems use sampling where only a percentage of traces are retained. For example, you might keep 100% of error traces, but only 5% of successful ones.
While this dramatically reduces storage and processing costs, it also means that traces are no longer a full historical record. If a request was not sampled, its trace will simply not exist.
How OpenTelemetry is unifying span events and logs
A span event is a structured annotation that marks a meaningful moment within a span and carries structured attributes. Unlike a standalone log, it is inherently anchored inside the trace hierarchy.
1234567891011// Traditional log instrumentationlogger.info("Payment gateway responded", {"http.response.status_code": 200,"gateway.provider": "stripe",});// Span eventspan.addEvent("Payment gateway responded", {"http.response.status_code": 200,"gateway.provider": "stripe",});
Both instrumentations above capture the same information. The difference is that the span event is inherently tied to its enclosing span and trace, while the log entry exists independently and must be explicitly correlated through trace and span IDs to connect it to the broader request flow.
Until recently, choosing between these two approaches was a judgment call based on whether the information made sense on its own or only within the context of a traced operation.
That guidance is now changing. In March 2026, the OpenTelemetry project announced the deprecation of the Span Event API in favor of a unified model where events are emitted as logs through the Logs API and correlated with traces through context.
The motivation is straightforward: having two overlapping APIs for the same concept created split guidance for instrumentation authors, duplicate concepts for operators, and slowed the evolution of the event model itself.
Under the new direction, methods like span.addEvent() and
span.recordException() will be phased out over time. New code should emit
events as log records that carry the active trace and span context, which
observability platforms can then surface in span timelines just as they do
today. The deprecation only targets the API for recording span events, not the
ability to view events attached to spans.
This is worth understanding because it changes how you should instrument going forward, but it does not invalidate existing instrumentation. Existing span event data remains part of the supported OTLP trace model, and language SDKs will provide compatibility options that can transform log-based events back into span events for backends that still depend on that representation.
The shift reinforces a principle that already runs through this article: logs and traces work best when they're connected. By routing events through the Logs API and correlating them with traces via context, OpenTelemetry is collapsing a distinction that was always somewhat artificial. Events that once required a choice between two APIs will now flow through a single path, making instrumentation more consistent and the resulting telemetry easier to reason about.
The key difference in the new model is the otel.event.name attribute. Its
value is a stable event class identifier — a fixed string that uniquely
identifies the structure and meaning of the event, independent of any per-call
variation in the message or attributes. Backends use it to group, count, and
surface events of the same class in the span timeline, the same way they handle
events recorded with span.addEvent(). The trace and span context is attached
automatically by the
OTel log bridge
whenever the log is emitted inside an active span.
1234567891011121314151617181920212223// Deprecated: recording events on the span directlyspan.addEvent("Payment gateway responded", {"http.response.status_code": 200,"gateway.provider": "stripe",});// Preferred: emitting events through the Logs APIlogger.info("Payment gateway responded", {"otel.event.name": "payment.gateway.responded","http.response.status_code": 200,"gateway.provider": "stripe",});// Deprecated: recording exceptions on the span directlyspan.recordException(error);// Preferred: emitting exceptions through the Logs APIlogger.error("Exception occurred", {"otel.event.name": "exception","exception.type": error.name,"exception.message": error.message,"exception.stacktrace": error.stack,});
If you're writing new instrumentation, prefer logs for events and exceptions. If
you have existing code that uses span.addEvent(), there's no urgency to
migrate, but avoid adding new dependencies on it.
Capturing logs and traces in practice
What determines the usefulness of your logs and traces in practice is how they get captured, how much context they carry, and how consistent the instrumentation is across services.
For logs, there is no shortcut—you have to write them. That means choosing a structured logging library, emitting JSON, and adding relevant contextual fields. Logs reflect what your code chooses to reveal so if you don't log it, it won't exist later during an incident.
Tracing gives you more options. You can instrument spans manually, just like logs, by wrapping important operations and attaching attributes. That's how you capture domain-specific decisions and annotate critical execution paths.
You can also rely on auto-instrumentation at the application level or kernel-level (via eBPF) to capture common operations such as HTTP requests, database calls, message queue interactions, and network boundaries. This gives you visibility into broad request flows and latency without source code modifications.
The goal is not to capture everything; it's to capture enough of the right things so that when production breaks, you can move from signal to root cause without guesswork.
Correlating logs and traces
Each signal on its own leaves gaps. Metrics lack sufficient context, traces are usually sampled, and logs lack structural relationships. Correlating them is how you close those gaps and get a holistic view of what's happening.
Correlating traces and logs involves automatically attaching a trace ID and span ID to every log record emitted during a request:
12345678910{"timestamp": "2026-02-12T14:23:45Z","level": "ERROR","message": "Payment declined: insufficient funds","service": "payment-service","trace_id": "abc123456789abcdef0123456789abcd","span_id": "def456789abcdef0","user_id": "user-42","amount": 99.99}
But it's not enough to simply attach these identifiers as log attributes. In the
OpenTelemetry logs data model,
TraceId, SpanId, and TraceFlags are dedicated top-level fields on the
LogRecord, distinct from the attributes collection.
This distinction matters because observability backends rely on these top-level fields to build navigable links between logs and traces. If the trace and span IDs are only present as attributes (as seen above), the log record may appear to carry the right data, but backends that follow the OTLP specification will not recognize them as trace context and correlation will silently break.
The following shows what a properly correlated log record looks like in the OTLP JSON format, with trace context in the correct top-level fields:
123456789101112131415161718192021222324{"timeUnixNano": "1707742800000000000","severityNumber": 17,"severityText": "ERROR","body": {"stringValue": "Payment declined: insufficient funds"},"traceId": "abc123456789abcdef0123456789abcd","spanId": "def456789abcdef0","attributes": [{"key": "service.operation","value": { "stringValue": "process_payment" }},{"key": "user_id","value": { "stringValue": "user-42" }},{"key": "amount","value": { "doubleValue": 99.99 }}]}
Notice that traceId and spanId sit alongside body and severityNumber at
the top level of the record, not inside the attributes array. Domain-specific
fields like user_id and amount belong in attributes, but trace context does
not.
In practice, you rarely need to think about this distinction because
OpenTelemetry handles it for you. SDK log appenders and bridges automatically
populate the top-level TraceId and SpanId fields from the active span
context whenever a log is emitted within a traced operation.
If you're collecting logs from sources outside the SDK, such as log files parsed by the OpenTelemetry Collector, you may need to configure a processor to extract and map trace context into the correct top-level fields.
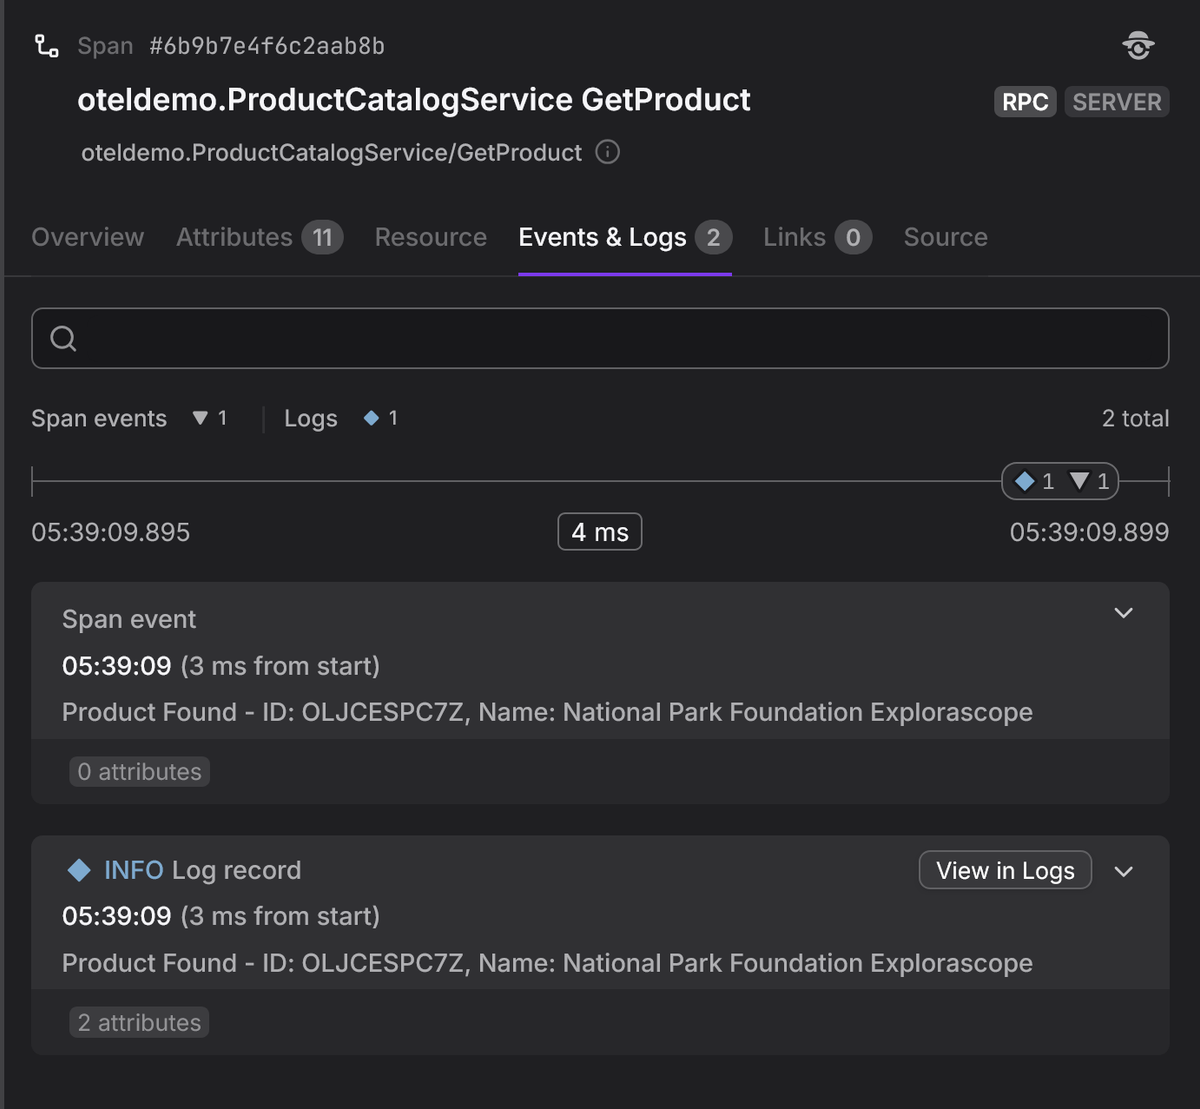
Once this context is populated correctly, logs begin to behave very much like span events. They're no longer isolated records that require manual filtering, but become anchored to a specific span and trace.
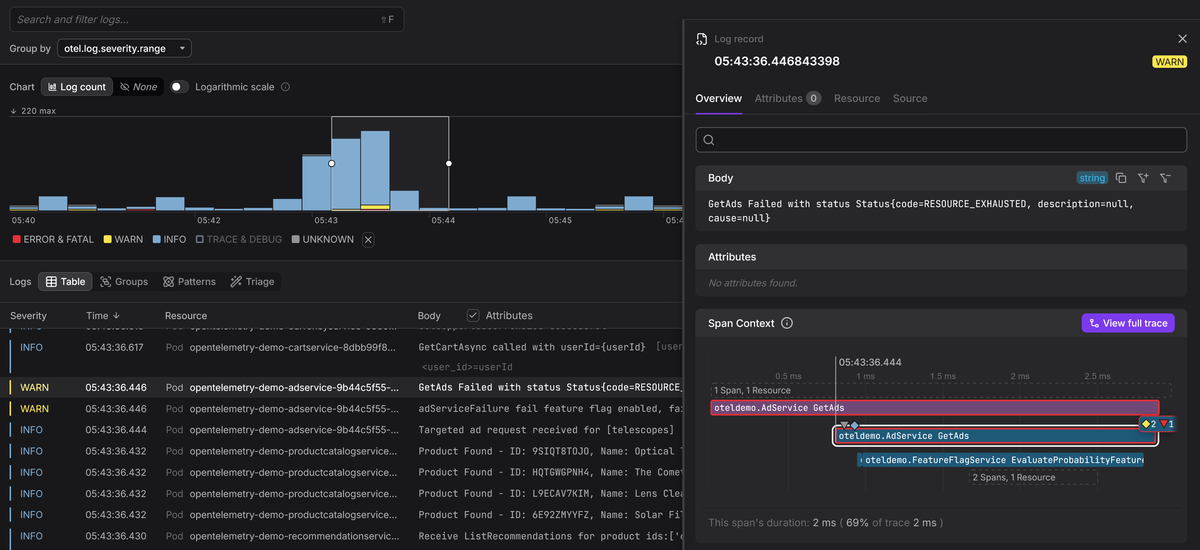
In your observability tool, you can select a span and immediately see all logs emitted during that operation. Or you can begin with an interesting log entry and jump directly to the full distributed trace for that request to see what happened before and after.
Once your telemetry is connected in this way, you stop jumping between isolated signals and guessing how they relate. Instead, you'll move through linked data with intent until the root cause becomes clear.
This is the shift required to go from just collecting telemetry to practicing observability.
Final thoughts
Logs give you depth inside a service. Traces give you the connected story across services. Each signal fills gaps the other can't cover on its own, and correlating them through shared trace context and resources is what turns raw telemetry into something you can actually navigate during an incident.
If you want faster incident response, clearer performance analysis, and less guesswork during outages, the focus should be on using each signal for what it does best and connecting them so you can move fluidly between perspectives.
Dash0 is designed to unify logs, traces, and metrics into a single, connected experience, built natively on OpenTelemetry. Rather than treating each signal as a separate "pillar", Dash0 lets you go from a metric spike to a representative trace, and from a specific span directly to the logs emitted during that operation, all within the same interface.
Start your free 14 day trial and see how quickly you can move from alert to root cause with OpenTelemetry-native observability.
