
You’re here because managing observability is a headache. You’re dealing with exploding data volumes, surprise bills that make your finance team cringe, and a mess of different tools that don’t play nice together.
You’ve heard OpenTelemetry is the answer—the vendor-neutral standard that promises to fix it all. And it can be, but OTel is just a specification. You still need a backend to store, query, and make sense of all that data.
Choosing the right OpenTelemetry backend is a critical decision. The market is flooded with vendors, from legacy giants who’ve bolted on OTel support to a new wave of “native” platforms.
They all claim to be the best, but the devil is in the details. The wrong choice can lock you into a proprietary ecosystem, drain your budget, and leave you with the same old problems, just with a new name.
This is a practitioner’s guide to the best OpenTelemetry tools on the market today. We’ll look at them through the lens of what actually matters for a modern, cloud-native team: zero vendor lock-in, predictable costs, and a unified workflow that doesn’t require you to be a query language polyglot.
1. Dash0

Dash0 is built from the ground up to be truly OpenTelemetry-native. This means that it’s not just compatible with OTel, but its entire architecture is based on OTel’s concepts, data model, and open standards.
The goal is to provide a unified, no-nonsense observability platform for teams that live and breathe cloud-native and don’t want to be shackled to a vendor’s proprietary tech. It’s built for SREs and developers who want the benefits of a managed SaaS platform without giving up control.
What’s good
- Zero Lock-In by Design: This is the biggest one. Dash0 is built on a foundation of open standards. It uses OTLP as its native format, PromQL as its query language for everything (metrics, logs, and traces), and a Perses-compatible format for dashboards. If you decide to leave, you can take your dashboards and alerts with you. Your instrumentation, built on the OTel standard, just needs to be pointed to a new endpoint.
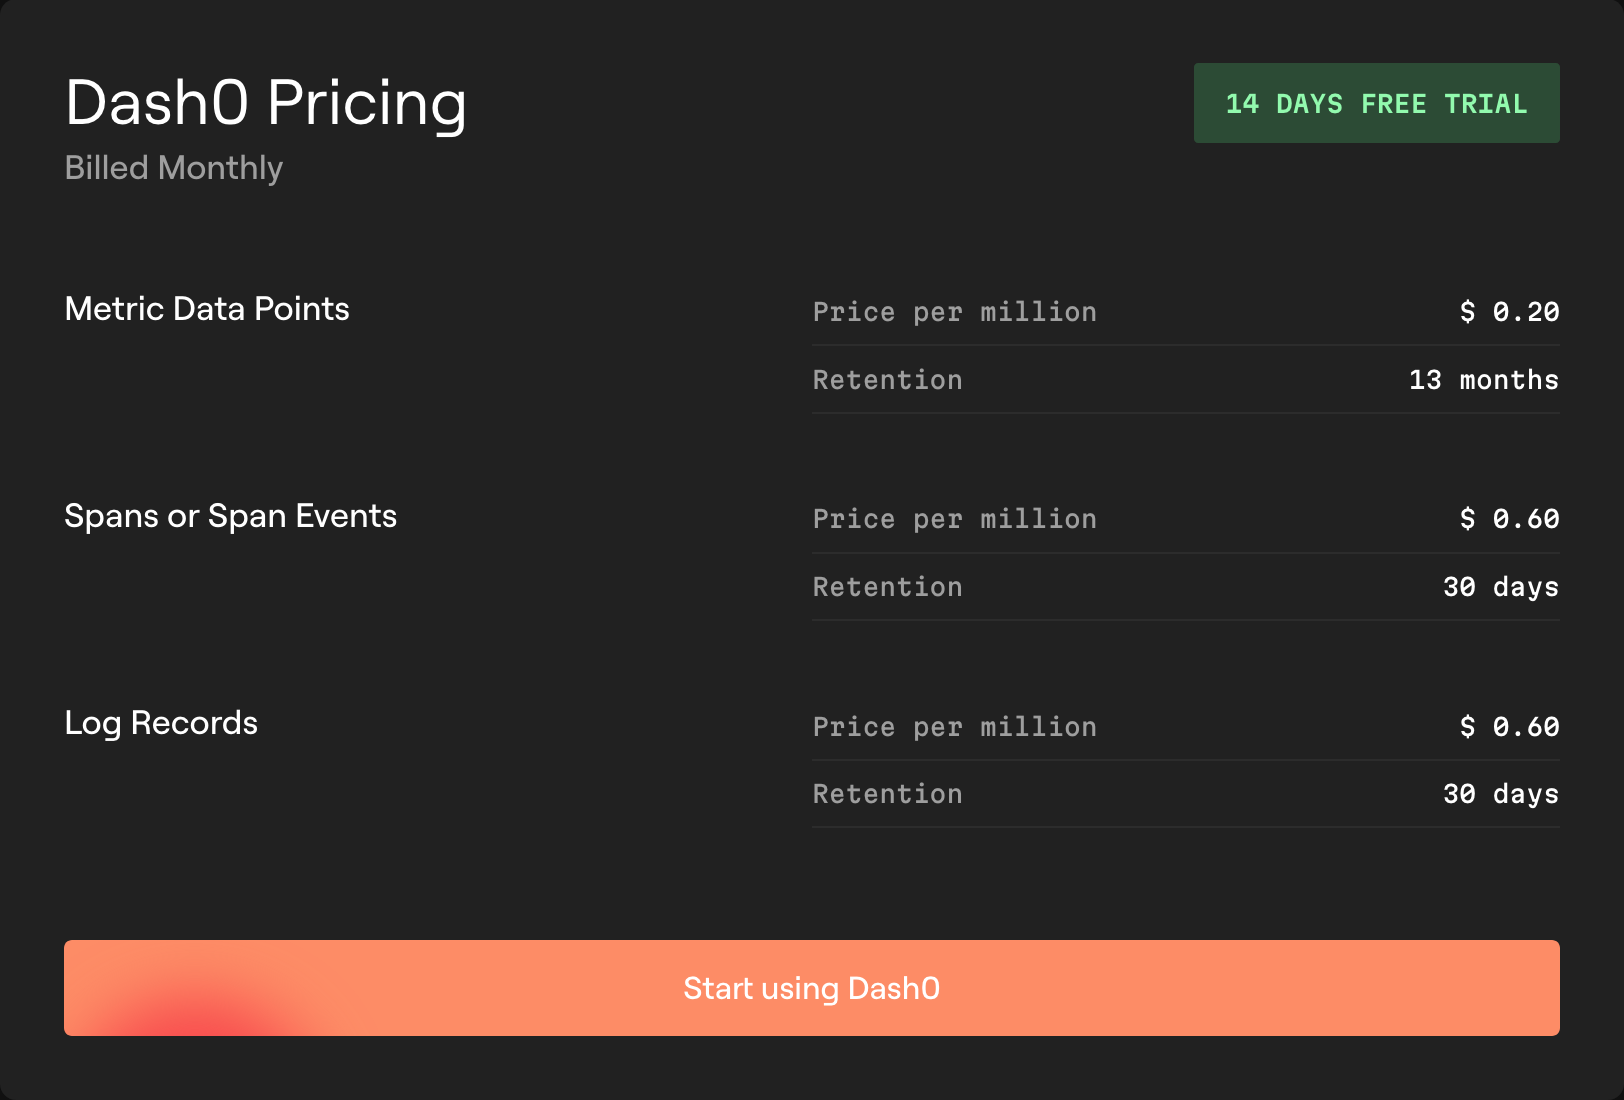
- Transparent and Predictable Pricing: The pricing model is dead simple. You pay per million signals (logs, spans, metric data points) ingested. That’s it. No per-user fees that punish you for growing your team, no opaque per-GB ingestion costs that penalize you for sending rich metadata, and no extra charges for querying your own data. You get real-time dashboards to track your usage against your spend, so there are no end-of-month surprises.
- Unified Workflow: Having one query language, PromQL, for all signals is a game-changer. You don’t have to switch context and syntax to correlate a spike in metrics with specific traces and logs. It dramatically reduces workflow friction and the cognitive load on your team.
The catch
While Dash0 has a solid set of integrations for major cloud-native technologies, its library of one-click integrations might not be as encyclopedic as what a behemoth like Datadog has built over a decade.
However, because it’s OpenTelemetry-native, you can use the vast OTel ecosystem to instrument pretty much anything. It just might require a bit more configuration than a pre-built integration.
The verdict
Dash0 is the clear choice for cloud-native teams who are serious about adopting OpenTelemetry for the long haul. If you’re tired of vendor games, unpredictable billing, and juggling multiple query languages, this is the platform for you.
It’s built on the principles of interoperability and transparency, delivering the simplified experience of a managed platform without the proprietary handcuffs. It’s built for engineers, by engineers, and it shows.
2. Datadog

Datadog is a feature-rich platform that covers everything from infrastructure monitoring and APM to security (SIEM) and RUM. For many organizations, it’s the default choice. They have recently added support for OpenTelemetry, allowing you to send OTLP data to their agent or directly to their endpoint.
What’s good
- Massive Feature Set: Datadog does everything. It has over 850 integrations, slick dashboards, and a mature set of features for monitoring, alerting, and security analysis. If there’s a niche monitoring need, Datadog probably has a product for it.
- All-in-One Platform: For large enterprises that want a single vendor to handle all their monitoring needs, Datadog presents a compelling, unified front. The experience is generally polished and works out of the box.
The catch
- Proprietary at its Core: Datadog is not an OpenTelemetry-native tool. It has a proprietary agent and data model. OTel is a translation layer, not the native language. This means you don’t always get full feature compatibility, and they even warn against mixing OTel and Datadog SDKs in the same app. You’re using the Datadog ecosystem, which happens to speak some OTel.
- Complex and Punitive Pricing: Datadog’s pricing is notoriously complex and expensive. It’s a labyrinth of per-host fees, per-GB ingestion costs, charges for custom metrics, indexed spans, and a dozen other add-ons. A single spike in traffic or verbose logging can blow up your bill. This pricing model actively discourages you from sending the high-cardinality data that makes observability useful.
- Vendor Lock-In: Once you’re deep in the Datadog ecosystem, it’s hard to get out. Your dashboards, monitors, and alerts are all built with their proprietary tools. Migrating away means rebuilding everything from scratch.
The verdict
Datadog is a powerful platform, but it’s a gilded cage. You get a lot of features, but you pay for it with high costs, complexity, and deep vendor lock-in. For teams looking to truly embrace the flexibility and portability of OpenTelemetry, Datadog’s approach feels like a step backward. It’s using OTel as an ingestion pipeline, not as a core philosophy.
3. New Relic

New Relic is another long-standing player in the APM space that has pivoted to become a broader observability platform. Like Datadog, they have embraced OpenTelemetry as a way to get data into their system. Their core pitch revolves around an “all-in-one” platform with predictable pricing based on users and data.
What’s good
- Simplified Pricing (in theory): New Relic made waves by simplifying its pricing to be based on data ingested and per-user fees. This is an improvement over the old, complicated SKU-based models and is generally more transparent than Datadog’s.
- Generous Free Tier: They offer a perpetually free tier with 100GB of data ingest per month and one full-platform user, which is great for small projects or for trying out the platform.
The catch
- The User-Based Pricing Trap: The “per-user” model can be a killer. Observability data should be accessible to everyone in engineering, but this model puts a price on that collaboration. It can lead to teams sharing generic user accounts, which is a security and compliance nightmare.
- Data Ingestion Costs: While simpler, the price per GB of ingest still penalizes you for sending detailed, high-cardinality data. At $0.35/GB (or $0.55/GB for their “Data Plus” option), costs can still spiral quickly with verbose logs or traces.
- OTel is Not Native: Similar to Datadog, New Relic ingests OTLP data, but it’s mapped to their internal data models. There are limits on attribute counts and payload sizes, and you lose some of the raw fidelity of the original OTel data. You are still operating within the New Relic world.
The verdict
New Relic has made positive strides in simplifying its pricing and embracing OpenTelemetry. However, the user-based pricing model is fundamentally at odds with a collaborative DevOps culture, and the cost-per-GB model still creates friction. It’s a better option than it used to be, but it’s not a truly OpenTelemetry-native solution. It’s another proprietary platform with an OTLP on-ramp.
4. Dynatrace

Dynatrace is a leader in the enterprise observability space, known for its AI-powered root cause analysis and deep, automated instrumentation via its “OneAgent”. It’s a platform targeted at large organizations that need extensive automation and AI-driven insights. They support OTel by having their OneAgent automatically collect OTel data or by sending data to their API endpoint.
What’s good
- Powerful AI and Automation: Dynatrace’s AI engine, “Davis,” is core to its value proposition. It excels at automatically discovering dependencies, identifying anomalies, and pointing to the root cause of problems without much human intervention.
- Automated Instrumentation: The OneAgent is designed to be a one-shot install that automatically instruments your entire stack, from the infrastructure up to the application code, which can simplify initial setup.
The catch
- Proprietary Agent is King: The entire Dynatrace model is built around the OneAgent. While it can ingest OTel data, it works best when its own agent is in control. Using OTel without the OneAgent requires manual data enrichment to get the same context. Running both can lead to duplicate data and disconnected traces. You’re either all-in on their agent or a second-class citizen.
- Complex, Consumption-Based Pricing: The pricing is a complex soup of “Host Units,” “Davis Data Units,” and GiB ingestion costs. It’s incredibly difficult to predict and control your spending, a common pain point for users of large-scale platforms.
- Extreme Lock-In: Because so much of the value is tied to the OneAgent and the Davis AI, moving off Dynatrace is a massive undertaking. All the automated context and intelligence you rely on disappears the moment you unplug their agent.
The verdict
Dynatrace is a powerful, but highly proprietary, “black box” solution. It’s for enterprises that want to outsource their observability thinking to a vendor’s AI. If your goal is to build a flexible, portable observability practice based on OpenTelemetry, Dynatrace’s philosophy is the polar opposite. It treats OTel as just another data source to be fed into its proprietary engine.
5. Honeycomb

Honeycomb is a well-respected tool that pioneered the concept of observability for many. They focus heavily on distributed tracing and high-cardinality event data. They were early and vocal supporters of OpenTelemetry and are a great choice for teams that want to debug complex, distributed systems.
What’s good
- Excellent for Tracing: Honeycomb’s strength is in exploring and debugging traces. Their “BubbleUp” feature is fantastic for slicing and dicing high-cardinality data to find the needle in the haystack. They understand event-based debugging better than almost anyone.
- Strong OTel Support: They are deeply committed to the OpenTelemetry project and have first-class support for OTLP. Internally, though, Honeycomb does convert incoming OTel data into its own event-based data model for storage and querying.
The catch
- Less Focus on Metrics: While they have support for metrics, Honeycomb’s DNA is in tracing and events. Teams that rely heavily on traditional metric-based monitoring (like with Prometheus) might find their tooling and query capabilities less mature than their tracing features.
- No Unified Query Language: You interact with traces and metrics differently. This isn’t a huge deal, but it lacks the unified workflow of a single query language for all signals.
The verdict
Honeycomb is a great tool, especially for teams whose primary pain point is debugging production incidents in complex microservice architectures
6. Grafana ‘LGTM’ Stack (Cloud or OSS)

Grafana is the de facto open-source tool for visualization. Many teams start here. The full observability offering from Grafana involves stitching together three separate projects: Mimir for metrics, Loki for logs, and Tempo for traces. This can be done via their Grafana Cloud SaaS offering or by self-hosting the open-source versions.
What’s good
- Open Source and Ubiquitous: Everyone knows and loves Grafana dashboards. It’s flexible, has a massive community, and is built on open standards.
- Cost-Effective (if you self-host): If you have the engineering resources to manage it, the open-source Grafana stack can be a very cheap way to get started.
The catch
- Three Backends, Three Query Languages: This is the biggest problem. Mimir uses PromQL. Loki uses LogQL. Tempo uses TraceQL. To get a complete picture, your engineers need to learn and use three different, albeit similar, query languages. This creates significant workflow friction and cognitive overhead, the exact opposite of a unified experience.
- Not Truly Unified: Even in Grafana Cloud, you’re still dealing with three separate backends that have been bundled together. The correlation between signals is not as seamless as in a platform designed to be unified from the start. You’re constantly jumping between contexts.
- Operational Burden (OSS): Self-hosting Mimir, Loki, and Tempo is a massive operational undertaking. These are complex, distributed systems in their own right. You’re basically signing up to run your own observability SaaS, which is a full-time job.
The verdict
The Grafana stack is a powerful, open-source-first option, but it is not a single, unified platform. It’s a collection of separate tools that share a visualization layer. The friction of using three different query languages is a major drawback for teams seeking a streamlined workflow. Grafana Cloud simplifies the hosting problem, but not the core issue of a fragmented backend.
7. SigNoz

SigNoz is an open-source, OpenTelemetry-native alternative to platforms like Datadog and New Relic. It provides a single application for logs, metrics, and traces, and is built to be fully compatible with OTel. You can self-host it or use their cloud offering.
What’s good
- True OTel-Native and Open Source: Like Dash0, SigNoz is designed from the ground up for OpenTelemetry. It uses OTel for everything, which means no data translation issues or vendor lock-in. Being open-source is a huge plus for teams that want full control.
- Unified Application: It provides a single interface for the three signals, which is a better experience than the fragmented Grafana stack.
The catch
- Operational Overhead: If you self-host, you are responsible for scaling, maintaining, and securing the platform. This includes managing its dependencies like ClickHouse and Kafka. As your data volume grows, this can become a very complex and time-consuming task.
- Maturity and Features: As a newer open-source project, it may lack some of the polished, enterprise-grade features and quality-of-life improvements of the more mature commercial offerings.
The verdict
SigNoz is an excellent open-source choice for teams that want a unified, OTel-native platform and have the engineering expertise and desire to run it themselves. It’s a strong contender for those who prioritize open-source above all else.
However, for most teams, the operational cost of managing another complex distributed system is a significant distraction from their core business.
8. Jaeger & Prometheus (OSS)

I’m grouping these together because they represent the “do-it-yourself” foundation of observability. Prometheus is the king of metrics collection, and Jaeger is a popular open-source tool for distributed tracing. Many teams start by using one or both, often with Grafana for visualization.
What’s good
- Best-in-Class for Their Niche: Prometheus is great for metrics and alerting. Jaeger is a solid, widely-used tool for tracing. They are both open-source and have huge communities.
- Ultimate Control: You control everything. The data format, the retention, the storage backend. There is zero vendor lock-in.
The catch
- Incomplete Picture: These are not complete OpenTelemetry observability tools. Jaeger only does traces. Prometheus only does metrics. Neither handles logs natively. To build a full observability solution, you need to add a logging component (like Loki, Victoria Logs, or Elasticsearch) and then figure out how to manage and correlate all three.
- Massive Operational Burden: You are responsible for everything. Setting up the collectors, configuring the storage (Cassandra/Elasticsearch for Jaeger, a time-series database for Prometheus), managing scaling, ensuring high availability, and handling upgrades. This is a huge, hidden cost in engineering time.
- Not an OTel Backend: While you can send OTel data to them, they aren’t a unified OTel backend. They are components around which you might build one.
The verdict
Jaeger and Prometheus are essential open-source projects, but they are not a complete, unified observability platform. They are fantastic for teams with the scale and engineering resources who want to build their own custom solution from scratch. For everyone else, it’s a path filled with operational toil that distracts you from your actual job.
Final thoughts
The observability landscape is finally moving beyond proprietary agents and data formats, and OpenTelemetry is leading the charge. But just because a vendor says they “support OTel” doesn’t mean they embrace its philosophy of interoperability and freedom from lock-in.
The legacy giants like Datadog and Dynatrace treat OpenTelemetry as just another input, funneling your data into their expensive, proprietary black boxes. The open-source world offers immense power with Grafana, Jaeger, and Prometheus, but at the cost of operational complexity.
The clear path forward for most cloud-native teams is to choose one of the truly OTel-native platforms. These tools are built on the principles of open standards from the ground up. They give you the best of both worlds: the simplicity of a managed SaaS platform without the vendor handcuffs.
Among these, Dash0 stands out by combining a zero lock-in architecture with a transparent, predictable pricing model and a unified workflow centered on PromQL.
Sign up for a free account and get 14 days of unlimited access to all features.

