Last updated: April 17, 2026
How OpenTelemetry Distributed Tracing Works (with Examples)
Modern distributed systems fail in ways that monoliths never did. When a single request fans out across a dozen services before returning a response, a log file only shows you what happened in one process. It tells you nothing about the other eleven, leaving you guessing at causal chains.
Distributed tracing was built to solve this problem. For years, the solution usually meant installing a proprietary Application Performance Monitoring (APM) agent. You instrumented your code with a vendor SDK, received a polished flame chart, and accepted the tradeoff: closed data formats, tight coupling to one backend, and the friction of migrating later after the inevitable price hike.
OpenTelemetry tracing changes that model by providing a standard, vendor-neutral data model for describing a request's journey across services. It captures what executed, in what order, how long each operation took, and whether it succeeded or failed. The format is open, the protocol is open, and the destination is your choice.
In this guide, you'll learn how OpenTelemetry tracing actually works. We'll walk through:
- The core span data model and how traces are structured.
- How the tracing API and SDK work together.
- How auto-instrumentation and manual instrumentation complement each other.
- Where the OpenTelemetry Collector fits in shaping production workflows.
By the end, you'll understand how the pieces fit together and start to grasp how OpenTelemetry tracing works in real systems.
Note that this article focuses specifically on how OpenTelemetry implements tracing. If you're looking for a broader introduction, see our dedicated article on how distributed tracing works in microservices.
What is a trace in OpenTelemetry?
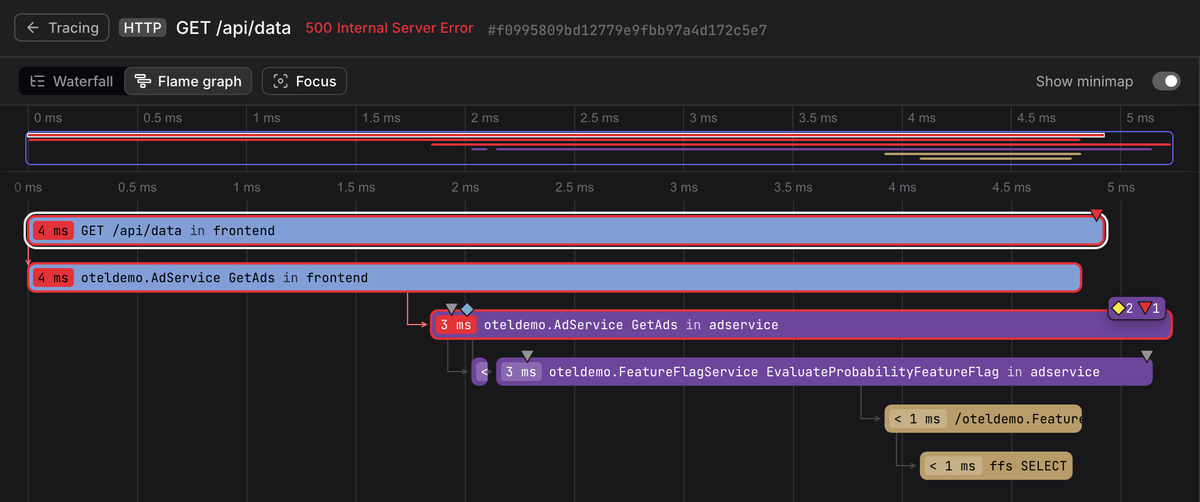
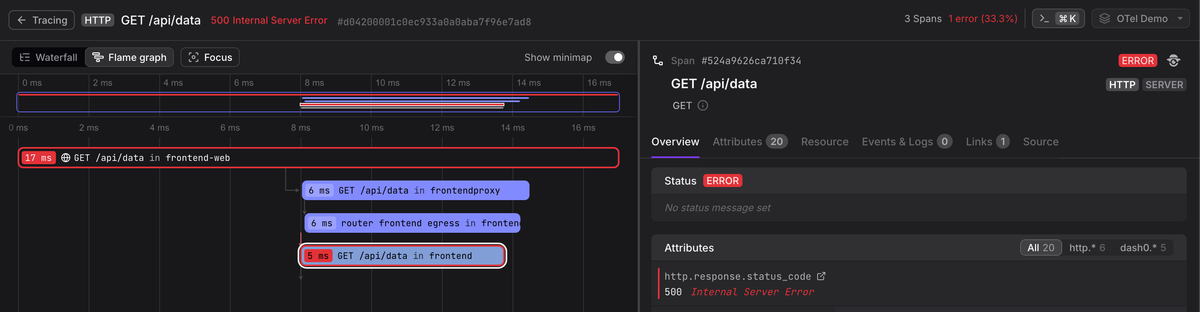
A trace is a record of a request's path through a distributed system. It captures every meaningful operation that occurred as part of fulfilling that request, from the initial HTTP call at the edge down to individual database queries and cache lookups deep in the stack.
Traces are made up of spans: individual units of work, each describing a single operation. Together, spans form a tree that reconstructs the full execution path of a request, complete with timing, context, and outcome.
This model is what makes distributed tracing operationally useful, because it moves you beyond simply observing that a request was slow and instead allows you to analyze where and why that latency occurred.
With a complete trace, you can identify which service introduced the delay, determine which specific database query stalled behind a lock, and understand whether a failure originated locally or was propagated from an upstream dependency.
OpenTelemetry tracing vs traditional APMs
Traditional APM agents were built for an era when most tracing occurred within the boundaries of a single application or a tightly controlled service mesh. They performed well as long as every service in your architecture ran the same vendor's agent and emitted telemetry in the same proprietary format.
However, once a request crossed service boundaries, context propagation typically relied on vendor-specific headers and internal protocols. As a result, every service had to participate in the same ecosystem to preserve trace continuity. Introducing a different backend, even for a single service, often meant losing visibility at that boundary.
This model created a form of architectural lock-in that extended beyond the backend itself. Choosing an APM solution effectively meant committing to its instrumentation agents, propagation format, ingestion pipeline, and data model. Over time, as systems evolved or teams experimented with different observability platforms, migrations became expensive and operationally risky because traces would fragment during the transition.
OpenTelemetry addresses these limitations by standardizing both context
propagation and the internal trace data model. Instead of defining yet another
proprietary protocol, it builds on open standards such as the
W3C Trace Context specification,
which defines how trace identifiers are carried between services through
well-known HTTP headers like traceparent and tracestate. Because this
specification is language-agnostic and vendor-neutral, any service that
implements it can participate in the same distributed trace, regardless of which
SDK or backend it uses.
In practice, this means a request can originate in a Node.js gateway, flow through a Python microservice, call a Java gRPC backend, and still appear as a single, coherent trace. Each service can export telemetry through the OpenTelemetry SDK, potentially to different destinations via the OpenTelemetry Collector, without breaking the logical continuity of the trace itself.
OpenTelemetry also standardizes how spans are represented internally, including attributes, events, links, and resource metadata. Backends no longer need to reinterpret opaque, vendor-specific payloads; they ingest a consistent, documented data structure. This shared data model is what makes trace portability and cross-signal correlation feasible at scale, and it's worth understanding in detail before you design a production tracing pipeline.
Understanding the OpenTelemetry tracing specification
The
OpenTelemetry trace data model
defines a Span as the fundamental unit of tracing. This represents a single
named operation with a defined start and end, enriched with context that makes
it useful for debugging and other analysis.
The core fields of a span are:
-
TraceId: A 16-byte globally unique identifier for the entire distributed trace. All spans that belong to the same request share this identifier. -
SpanId: An 8-byte identifier for this specific span within the trace. -
ParentSpanId: TheSpanIdof this span's parent, which is how the trace timeline is constructed. A span without aParentSpanIdis called the root span. It represents the entry point of the request. -
Name: A human-readable description of the operation, such asGET /api/orders(for an HTTP request) orSELECT * FROM orders WHERE id = ?(for a database query). -
Kind: The role of the span in the request lifecycle. Acceptable values areSERVER(handling an inbound request),CLIENT(making an outbound call),PRODUCERandCONSUMER(for message queues), andINTERNAL(for in-process operations). -
StartTimeandEndTime: The timestamps that bound the operation, from which duration is calculated. -
Attributes: Arbitrary key-value pairs (using semantic conventions) that capture machine-readable context specific to the operation, such as the request path, the database statement, the user ID, or the feature flag that was active. This is where the diagnostic value of the trace accumulates. -
Events: Timestamped annotations attached directly to the span. They are essentially structured log entries that are pinned to a specific point in the span's execution. They carry their own attributes and are visible within the span's timeline. -
Status: Indicates whether the operation succeeded (OK), failed (ERROR), or has not been explicitly set (UNSET). -
Links: References to other spans, used to associate work that is causally related but not strictly parent-child, such as a batch job that processes messages from multiple producers.
In the OpenTelemetry Protocol (OTLP/JSON), a span is represented as follows:
1234567891011121314151617181920212223242526272829303132333435363738394041424344454647484950515253545556{"resourceSpans": [{"resource": {"attributes": [{"key": "service.name","value": { "stringValue": "checkout-service" }},{ "key": "host.name", "value": { "stringValue": "falcon" } }]},"scopeSpans": [{"scope": {"name": "@opentelemetry/instrumentation-http","version": "0.56.0"},"spans": [{"traceId": "da5b97cecb0fe7457507a876944b3cf2","spanId": "fa7f0ea9cb73614c","parentSpanId": "9b36e1a1f8c2d043","name": "POST /checkout","kind": 2,"startTimeUnixNano": "1756571696706248000","endTimeUnixNano": "1756571696891302000","attributes": [{ "key": "http.method", "value": { "stringValue": "POST" } },{ "key": "http.status_code", "value": { "intValue": 200 } },{ "key": "user.id", "value": { "stringValue": "usr_8675309" } }],"events": [{"timeUnixNano": "1756571696750000000","name": "payment.authorized","attributes": [{"key": "payment.provider","value": { "stringValue": "stripe" }},{"key": "payment.amount_cents","value": { "intValue": 4999 }}]}],"status": { "code": 1 }}]}]}]}
At the top level, resourceSpans groups spans emitted by the same resource —
here, a microservice identified by service.name. Within each resource,
scopeSpans groups spans by instrumentation scope, indicating which library
produced them. The spans array contains the individual operations, each with
timing, context, and the trace identifiers (traceId, spanId, parentSpanId)
that links them into a tree.
The structure shown above is not just a transport format; it's the canonical OpenTelemetry data model. When such data is ingested into an OpenTelemetry-native observability backend, the resource metadata, instrumentation scope, parent-child relationships, attributes, and events are preserved exactly as they were emitted.
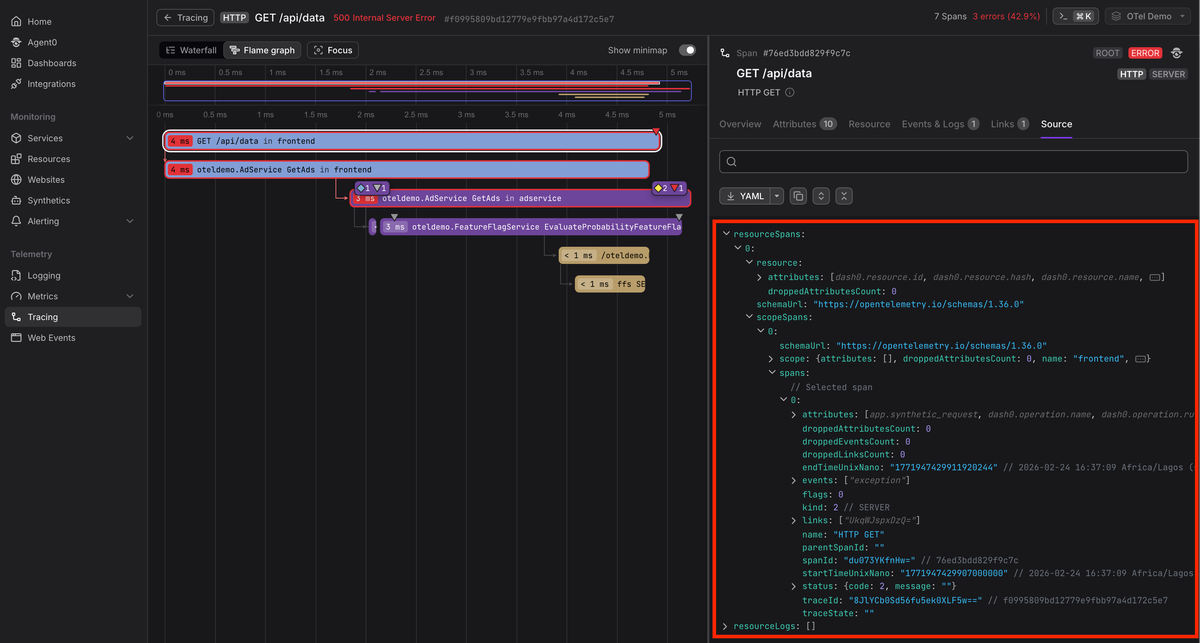
Because the backend understands OTLP natively, it does not need to flatten or reinterpret spans into a proprietary schema. The trace tree, resource grouping, and high-cardinality attributes remain intact, which enables accurate navigation, filtering, and cross-signal correlation without translation loss.
Understanding the trace API and SDK
The trace API defines the contract for creating spans and propagating context. It is the layer that your application code and instrumentation libraries interact with directly.
At the API level, the following three components matter most:
- The
TracerProvideris the entry point that provides access toTracerinstances. - A
TracercreatesSpanobjects. - A
Spanis the API to trace an operation.
Crucially, the Trace API is a no-op by itself. If no SDK is installed, all API calls will succeed but produce no telemetry. This design allows libraries to instrument themselves and depend on the API safely, and end users decide whether telemetry is actually recorded and exported (by installing the appropriate OpenTelemetry SDK).
The trace SDK provides the concrete implementation behind the API. This is where instrumented spans become real telemetry.
At a high level, the SDK is responsible for:
- Deciding whether a span should be recorded or dropped.
- Storing span data while it is active.
- Passing finished spans through processors.
- Exporting spans to a backend.
123456789101112import { OTLPTraceExporter } from "@opentelemetry/exporter-trace-otlp-http";import { NodeSDK } from "@opentelemetry/sdk-node";import { TraceIdRatioBasedSampler } from "@opentelemetry/sdk-trace-node";// NodeSDK automatically configures a global TracerProvider and a// BatchSpanProcessorconst sdk = new NodeSDK({traceExporter: new OTLPTraceExporter(),sampler: new TraceIdRatioBasedSampler(0.1), // sample 10% of traces});sdk.start();
Let's break down the main components below:
TracerProvider
The SDK implementation of TracerProvider manages configuration and creates
Tracer instances. You'll typically create one TracerProvider per process and
register it as the global provider.
Sampler
Sampling determines which traces are recorded and ultimately exported. When the
SDK is asked to create a span, it first ensures that a valid TraceId exists,
then calls Sampler.ShouldSample to obtain a sampling decision.
The sampler may return DROP, RECORD_ONLY, or RECORD_AND_SAMPLE. This
outcome controls whether the span is recording, whether the Sampled flag is set,
and whether the span will be exported. Because sampling happens at span creation
time, any attributes added later cannot influence the decision.
SpanProcessor
A SpanProcessor hooks into the lifecycle of a span and is only executed for
spans where IsRecording is true. In production, you typically use a
BatchSpanProcessor, which buffers completed spans and exports them in batches.
This approach significantly reduces overhead compared to exporting each span
synchronously as soon as it ends.
SpanExporter
A SpanExporter is responsible for encoding and transmitting spans to a
destination. It converts finished spans into a protocol-specific format and
sends them to a configured endpoint.
In most modern deployments, spans are exported via OTLP to the OpenTelemetry Collector, which then processes them further before forwarding to your observability backend.
Tracing your application with OpenTelemetry
Tracing your application involves adding the appropriate instrumentation so that it can create spans, propagate context, and attach meaningful metadata to operations.
OpenTelemetry supports multiple approaches to instrumentation, ranging from fully automatic solutions to fine-grained manual control.
The simplest starting point is zero-code instrumentation.
Zero-code instrumentation
For the most common operations in a web application, you don't need to write any instrumentation code yourself. OpenTelemetry provides zero-code instrumentation via auto-instrumentation packages that hook into popular libraries and automatically create spans.
From the perspective of a typical web service, this covers operations such as:
- Incoming HTTP requests to your server
- Outbound HTTP calls to other services or APIs
- Database queries to PostgreSQL or MySQL
- Cache calls to Redis
- gRPC or messaging interactions
When a request hits your server, a span is created for the inbound HTTP request. If your handler then calls another service or runs a SQL query, additional child spans are created automatically. Context is propagated between these operations automatically so that the entire request flow becomes a single trace.
For example, the
@opentelemetry/auto-instrumentations-node
package for Node.js bundles instrumentation for popular libraries like Express,
pg, mysql, redis,
Pino and many
others.
You only need to install the required packages and configure some OpenTelemetry environment variables before your application code runs:
12345678910# install required packagesnpm install --save @opentelemetry/apinpm install --save @opentelemetry/auto-instrumentations-node# configure export to a backend or collectorexport OTEL_TRACES_EXPORTER=otlpexport OTEL_EXPORTER_OTLP_TRACES_ENDPOINT=http://localhost:4318# start the application with OpenTelemetry enablednode --require @opentelemetry/auto-instrumentations-node/register app.js
With this setup in place, every inbound HTTP request to your server and every outbound HTTP call or database query is automatically wrapped in a span. You get end-to-end traces of real user requests without modifying your application logic.
Zero-code instrumentation is the fastest way to get visibility into a running service, especially when you want broad coverage with minimal effort.
That said, not every language or framework has mature auto-instrumentation libraries, and coverage does vary across language ecosystems. In environments where application-level auto instrumentation is limited or impractical, emerging eBPF-based approaches offer another path by observing network and runtime behavior at the kernel level without modifying application code.
Manual instrumentation
Auto-instrumentation surfaces baseline operations, but it knows nothing about your business logic. To trace domain-specific operations, you must instrument it manually using the trace API:
123456789101112131415161718192021222324252627import { trace, SpanStatusCode } from "@opentelemetry/api";const tracer = trace.getTracer("checkout-service");async function authorizePayment(orderId, amount) {return tracer.startActiveSpan("payment.authorize", async (span) => {span.setAttributes({"order.id": orderId,"payment.amount_cents": amount,"payment.provider": "stripe",});try {const result = await stripeClient.charges.create({ amount });span.setStatus({ code: SpanStatusCode.OK });return result;} catch (err) {span.recordException(err);span.setStatus({ code: SpanStatusCode.ERROR, message: err.message });throw err;} finally {span.end();}});}
The startActiveSpan() method creates a new span and makes it the active span
on the current context. Any spans created inside that scope, whether by
auto-instrumentation or additional manual calls, automatically become its
children. And that's how a trace tree grows without you having to manually wire
parent and child relationships.
From a web application perspective, this span would typically be a child of the
inbound POST /checkout server span. The trace would show:
- The HTTP request span created by auto-instrumentation.
- A child span for
payment.authorize. - Additional spans for outbound calls, such as Stripe’s API.
The setAttributes() call attaches business context directly to the span. This
is where you encode domain meaning: order IDs, user IDs, provider names,
amounts, feature flags, or experiment variants.
If something goes wrong, recordException() captures the error details and
setStatus() marks the span as failed. This makes error analysis much simpler,
because the failure is attached directly to the operation that caused it.
When viewed through the Collector's debug exporter, the resulting span for a full checkout request might look like this:
123456789101112131415161718192021222324252627282026-02-23T07:26:47.419Z info ResourceSpans #0Resource SchemaURL: https://opentelemetry.io/schemas/1.38.0Resource attributes:-> service.name: Str(checkout-service)-> host.name: Str(falcon)-> process.runtime.name: Str(nodejs)-> telemetry.sdk.name: Str(opentelemetry)-> telemetry.sdk.version: Str(2.0.1)ScopeSpans #0ScopeSpans SchemaURL:InstrumentationScope @opentelemetry/instrumentation-http 0.56.0Span #0Trace ID : 457f17e470f2787d1888b9c109cad318Parent ID : fb01742df5311457ID : cf4f5ace509339c4Name : POST /checkoutKind : ServerStart time : 2026-02-23 07:26:46.29833038 +0000 UTCEnd time : 2026-02-23 07:26:46.29845338 +0000 UTCStatus code : OkStatus message :DroppedAttributesCount: 0DroppedEventsCount: 0DroppedLinksCount: 0Attributes:-> http.method: Str(POST)-> http.status_code: Int(200)-> user.id: Str(usr_8675309)
The span captures the full picture: what executed, when it started and ended, how long it took, and the business context attached as attributes.
Manual instrumentation is how you move from generic traces to those that reflect how your application actually works.
The role of the OpenTelemetry Collector in tracing
When your application is instrumented with the OpenTelemetry SDK, spans are typically exported to an OTLP endpoint, which in most production settings, is the OpenTelemetry Collector. While it can act as a simple forwarder, its real value lies in acting as a control plane for your telemetry pipeline.
The Collector receives spans, processes them in configurable stages, and exports them to one or more backends. This decouples your application from vendor-specific ingestion endpoints and gives you a centralized place to enforce sampling, filtering, redaction, and routing policies.
Let’s examine how this works in practice.
Receivers: accepting spans from any source
The Collector ingests spans through receivers, each of which is responsible for accepting telemetry in a specific protocol or data format.
Common receivers include:
- otlp for accepting OTLP over gRPC or HTTP, the standard path for SDK-instrumented services.
jaegerfor legacy Jaeger clients that have not yet migrated.zipkinfor Zipkin-formatted traces, often found in older systems.
By supporting multiple receivers, the Collector can aggregate spans emitted from different SDKs, legacy agents, or transport mechanisms into a unified processing pipeline.
Processors: where traces are shaped
Processors operate on spans after ingestion and before export. Some common operations include:
-
Head-based or probabilistic sampling adjustments using the probabilistic_sampler processor when lightweight sampling decisions are sufficient.
-
Tail-based sampling with the tail_sampling processor to retain traces based on error status, latency thresholds, or probabilistic policies.
-
Per-span mutation and advanced span handling using the span processor to modify span names, adjust attributes, or apply conditional logic to spans as they pass through the pipeline.
-
Attribute enrichment or mutation via the attributes processor to add, update, or delete span attributes.
-
Filtering spans with the filter processor to drop spans that match specific conditions, such as health checks or low-value endpoints.
-
Redaction and transformation using the transform processor to mask sensitive values, rewrite attributes, or remove fields before export.
Beyond processors, the Collector also provides connectors, which link pipelines together and allow telemetry to be derived or rerouted across signals.
For example, the spanmetrics connector converts spans into metrics, enabling RED-style metrics such as request rate, error rate, and latency without instrumenting metrics separately, while the servicegraph connector analyzes spans to produce service-to-service dependency graphs.
Connectors extend the Collector from a linear pipeline into a graph of telemetry flows, making it possible to derive metrics from traces, feed data into multiple destinations, or build higher-level views of your system without modifying application code.
Exporters: delivering spans to your observability backend
Exporters are the final stage of the Collector pipeline. After spans are received and processed, exporters are responsible for sending them to a destination. That destination might be a tracing backend, a data lake, another Collector instance, or multiple systems at once.
The most common exporters in OpenTelemetry deployments are otlp and otlp_http , which send telemetry over gRPC and HTTP respectively.
Other exporters exist for specific ecosystems, such as jaeger, zipkin, and
various cloud vendor integrations. Because exporters are configured at the
Collector level, you can change or add destinations without redeploying your
applications.
For example, exporting traces via OTLP to Dash0 is simply a matter of
configuring the otlp or otlp_http exporter with your Dash0 ingestion
endpoint:
1234567# otelcol.yamlexporters:otlp_http/dash0:endpoint: https://ingress.eu-west-1.aws.dash0.comheaders:Authorization: Bearer ${DASH0_API_TOKEN}Dash0-Dataset: default
Then reference it in your traces pipeline:
1234567# otelcol.yamlservice:pipelines:traces:receivers: [otlp]processors: [batch, tail_sampling, transform]exporters: [otlp_http/dash0]
This architecture keeps your services vendor-neutral because applications only need to speak OTLP, without being coupled to any specific backend. The Collector centralizes routing, sampling, and policy enforcement, while Dash0 receives fully structured OpenTelemetry data and preserves trace context, attributes, and cross-signal correlations exactly as defined by the OpenTelemetry data model.
Exporters, therefore, are not just delivery mechanisms. They're the boundary between your internal telemetry control plane and the systems where you analyze and act on that data.
Best practices for OpenTelemetry tracing
Getting traces flowing is easy, but keeping them consistently useful in production requires deliberate design choices. The difference between noisy telemetry and actionable insight often comes down to how you collect, enrich, and retain your spans.
To produce spans that are reliable, cost-effective, and operationally useful, follow these practices:
1. Use semantic conventions
OpenTelemetry defines
semantic conventions
for common operations such as http.request.method,
http.response.status_code, db.query.text, and many more.
Using standardized attribute names has several benefits:
- Backends can interpret spans without custom configuration.
- Pre-built dashboards work out of the box.
- Logs, metrics, and traces share a consistent vocabulary.
Auto-instrumentation libraries already emit spans that comply with OpenTelemetry’s semantic conventions. When adding manual spans, resist the temptation to invent custom attribute names and instead follow the specification so your telemetry stays portable, consistent, and interoperable across tools and backends.
2. Embrace high-cardinality attributes
The difference between knowing that "error rate is elevated" and being able to
say "error rate is 94 percent for user:8675309 on the canary deployment in
eu-west-1 with the new-checkout-flow feature flag enabled" comes down to the
attributes attached to your spans.
High-cardinality attributes make traces powerful for root cause analysis. Consider including:
- User IDs or tenant IDs.
- Deployment identifiers.
- Feature flags or experiment variants.
- Region or availability zone.
- Customer plan or tier.
These attributes allow you to filter and segment traces along the exact axes that matter when diagnosing an issue. To make this practical, choose an observability backend that handles high cardinality efficiently instead of discouraging it through cost or performance penalties.
3. Always include resource attributes
Resource attributes describe the entity that produced the spans. They anchor traces to specific services and environments.
At minimum, configure service.name, service.version, and
deployment.environment.name:
123456789101112131415import { Resource } from "@opentelemetry/resources";import {ATTR_SERVICE_NAME,ATTR_SERVICE_VERSION,ATTR_DEPLOYMENT_ENVIRONMENT_NAME,} from "@opentelemetry/semantic-conventions";import { NodeSDK } from "@opentelemetry/sdk-node";const sdk = new NodeSDK({resource: new Resource({[ATTR_SERVICE_NAME]: "checkout-service",[ATTR_SERVICE_VERSION]: "2.4.1",[ATTR_DEPLOYMENT_ENVIRONMENT_NAME]: "production",}),});
In Kubernetes environments, use the k8sattributes processor in the Collector to enrich spans automatically with metadata such as pod name, namespace, and node.
Without consistent resource attributes, even well-structured spans will lack valuable context in multi-service environments.
4. Control your volume with sampling
High-throughput services can generate vast numbers of spans, the majority of which represent normal, uneventful traffic. Storing every trace is rarely necessary and can quickly become expensive.
Tail-based sampling in the Collector allows you to retain traces that contain errors, exceed latency thresholds, or match other business-critical conditions, while applying probabilistic sampling to the remaining traffic. Because tail sampling evaluates complete traces before making a decision, it delivers higher-quality datasets than simple head-based sampling.
That said, implementing sampling policies is not trivial. Tail sampling introduces memory and timing considerations, and poorly chosen policies can either drop valuable traces or overwhelm your pipeline. When designed carefully, however, sampling keeps ingestion costs predictable while ensuring that the traces you retain are the ones most worth investigating.
Final thoughts
You now have a working mental model of OpenTelemetry tracing: the span data model, the separation between the tracing API and SDK, how auto-instrumentation and manual spans complement each other, and how the Collector enables tail sampling, normalization, and data scrubbing in production.
If you are starting afresh,begin with zero-code instrumentation. Configure the SDK, add the relevant auto instrumentation package, and point your exporter at a Collector or OTLP endpoint. You'll immediately see HTTP and database spans without modifying application logic. Then layer in manual spans for the business-critical operations that define your domain.
Once traces are flowing, test them in practice. Navigate between traces and logs, filter by resource attributes, and slice by high-cardinality fields. Gaps in semantic conventions or missing resource metadata become obvious when you try to use the data, not just collect it.
An OpenTelemetry-native backend matters at this stage. A system built around OTLP preserves parent-child relationships, resource grouping, span events, and attribute structure instead of flattening them into a proprietary schema. That fidelity is what enables precise navigation from a slow database span to the logs around it, or filtering traces by a feature flag present in only a small fraction of requests.
Dash0 is built around OpenTelemetry from the ground up. It ingests OTLP natively, preserves the full trace data model, and supports high-cardinality attributes without punitive cost tradeoffs. To see how traces, logs, and metrics work together in a system designed for OpenTelemetry, start a free trial with Dash0.
