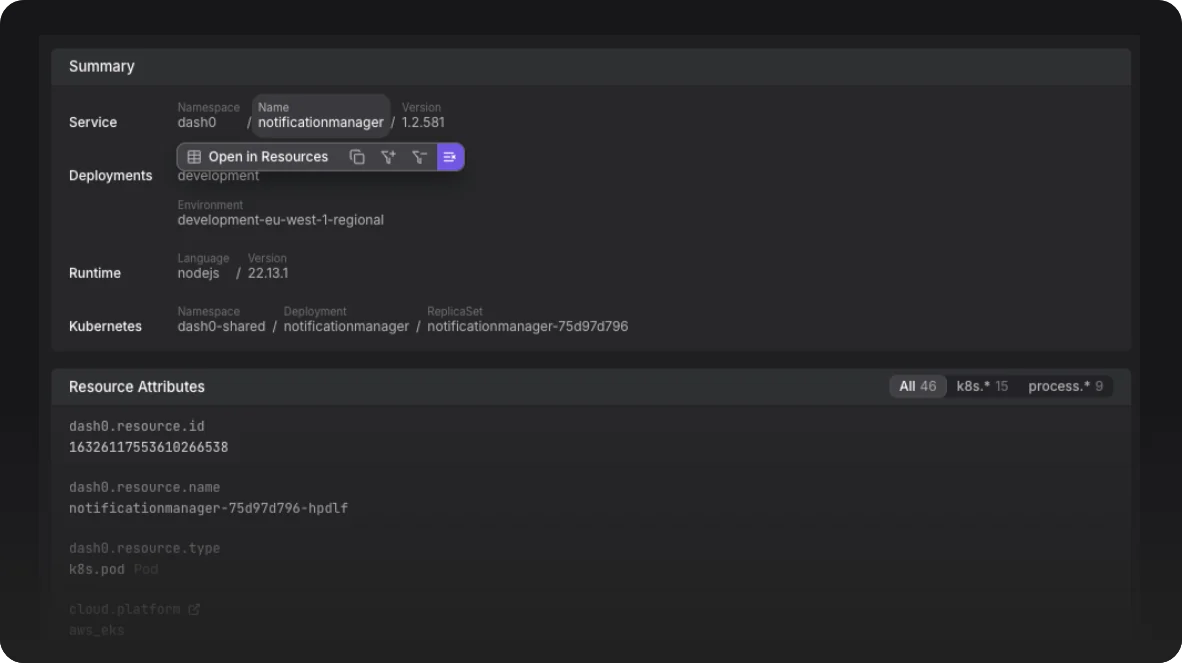
Filtering
Filter fast, find faster!
Easily filter using the OpenTelemetry semantic conventions, with built-in context-aware guidance. Drill down by key or value across resource and signal metadata., ensuring you find what you need in no time.
Dash0 acquires Polar Signals

Dash0 delivers the most powerful way to explore distributed tracing. Follow every request from the end user to the deepest database, uncover latency bottlenecks, and see how failures propagate in real time. Correlate traces with logs, events, and metrics for full-system clarity—fast, scalable, and built for OpenTelemetry.
Start for free or Book a demo

Infrastructure engineer - Chargetrip
In an age of overly complex tools, we find that Dash0 stands out for its simplicity and speed. With simple pricing, easy integration, amazing filtering capabilities, fast handling of large data volumes, and straightforward alerting with clear error messages, Dash0 makes observability a breeze.

CTO - Hayuno AG
Despite being a young company, Dash0 delivers enterprise-grade quality and features—automatic instrumentation, spans, logs with semantic context, PromQL support, AI-powered trace triage—all working reliably from day one.

Senior Full-Stack Engineer - catchHR
Dash0 has significantly streamlined our approach to observability and OpenTelemetry, bringing everything together in one place. The intuitive interface and seamless integration have enabled us to quickly gain valuable insights into our systems and resolve issues efficiently.

Senior Web Developer - CroCoder
What I love most about Dash0 is that it's fully OpenTelemetry native which has significantly improved our software development process. The seamless navigation from logs to traces to metrics streamlines bug diagnosis and troubleshooting, enhancing our team's efficiency.

Software Engineer - Vercel
The tracing UI is amazing. When we switched to Dash0, it significantly cut down the amount of time from a bug being reported to figuring out why it happened and fixing it. Filtering on attributes is extremely intuitive, and the tracing tree UI is awesome.

DevOps Cloud Architect - AV Software Solutions 360° at Bechtle
With Dash0, we have found an OpenTelemetry-native solution that provides the flexibility we need. With the support of the open standard OpenTelemetry, we are able to handle public resources responsibly.

Solution Architect - Porsche Digital
Dash0's foundation on open source standards ensures future-proof and next-gen observability. Their focus on ease of use empowers all of our developers to gain insights quickly.
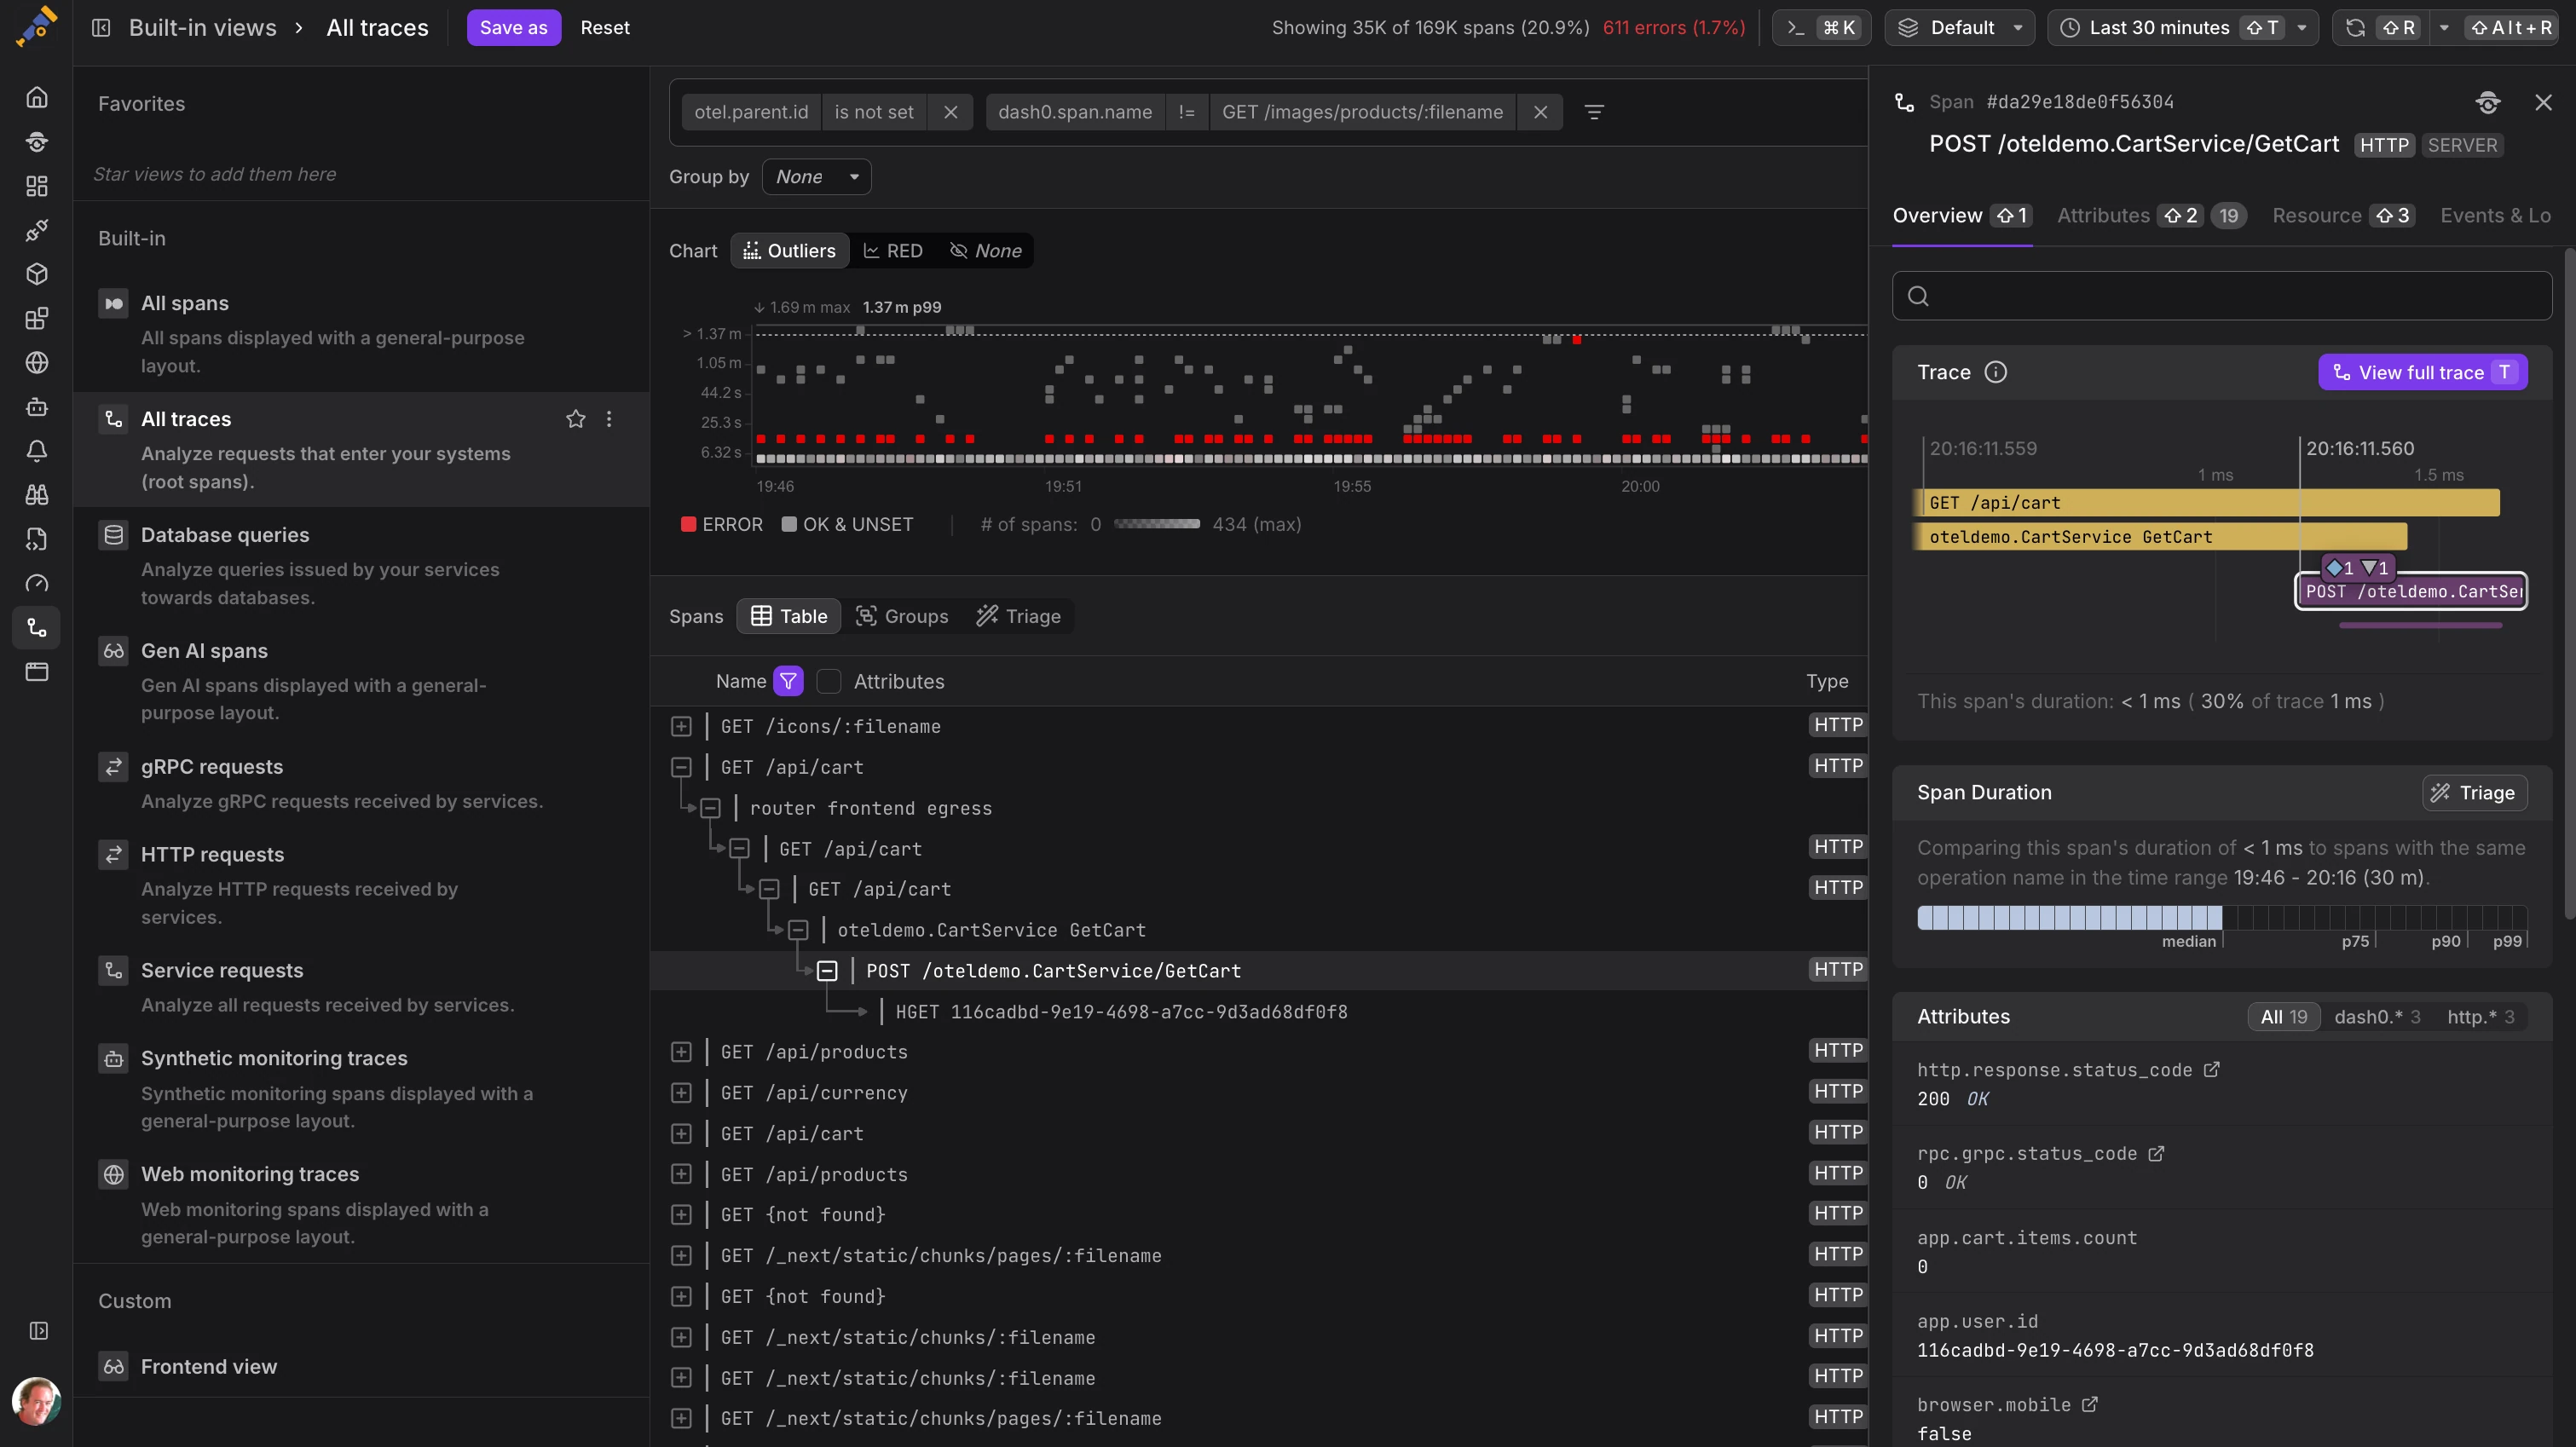
Dash0 makes searching high-cardinality spans effortless. Filter and pinpoint failures or bottlenecks instantly—whether using your keyboard or a simple click. Let Triage analyze millions of traces in seconds—Dash0 finds the needle in the haystack for you.
Easily filter using the OpenTelemetry semantic conventions, with built-in context-aware guidance. Drill down by key or value across resource and signal metadata., ensuring you find what you need in no time.
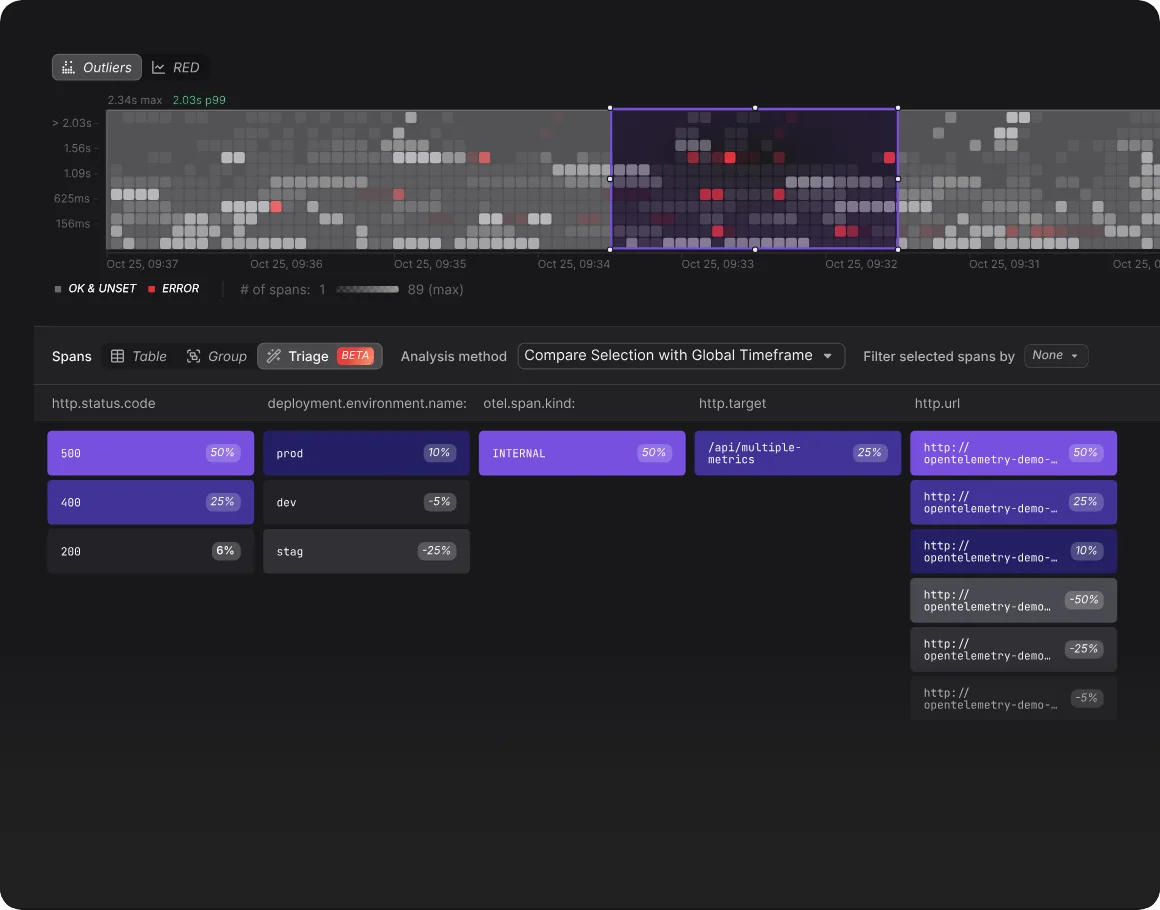
Quickly pinpoint the root cause of performance issues with automated telemetry comparison for logs and traces. Our analytics engine detects key attributes behind bottlenecks and anomalies by analyzing timeframes, baselines, and incident patterns.
Built for developers and platform engineers, this feature accelerates root cause analysis, reducing MTTR and keeping your systems running smoothly.
Dash0 gives you flexible visualizations for HTTP requests, database calls, and API breakdowns. Use predefined views and filters to instantly identify bottlenecks in services, databases, and gRPC requests—making performance optimization effortless.
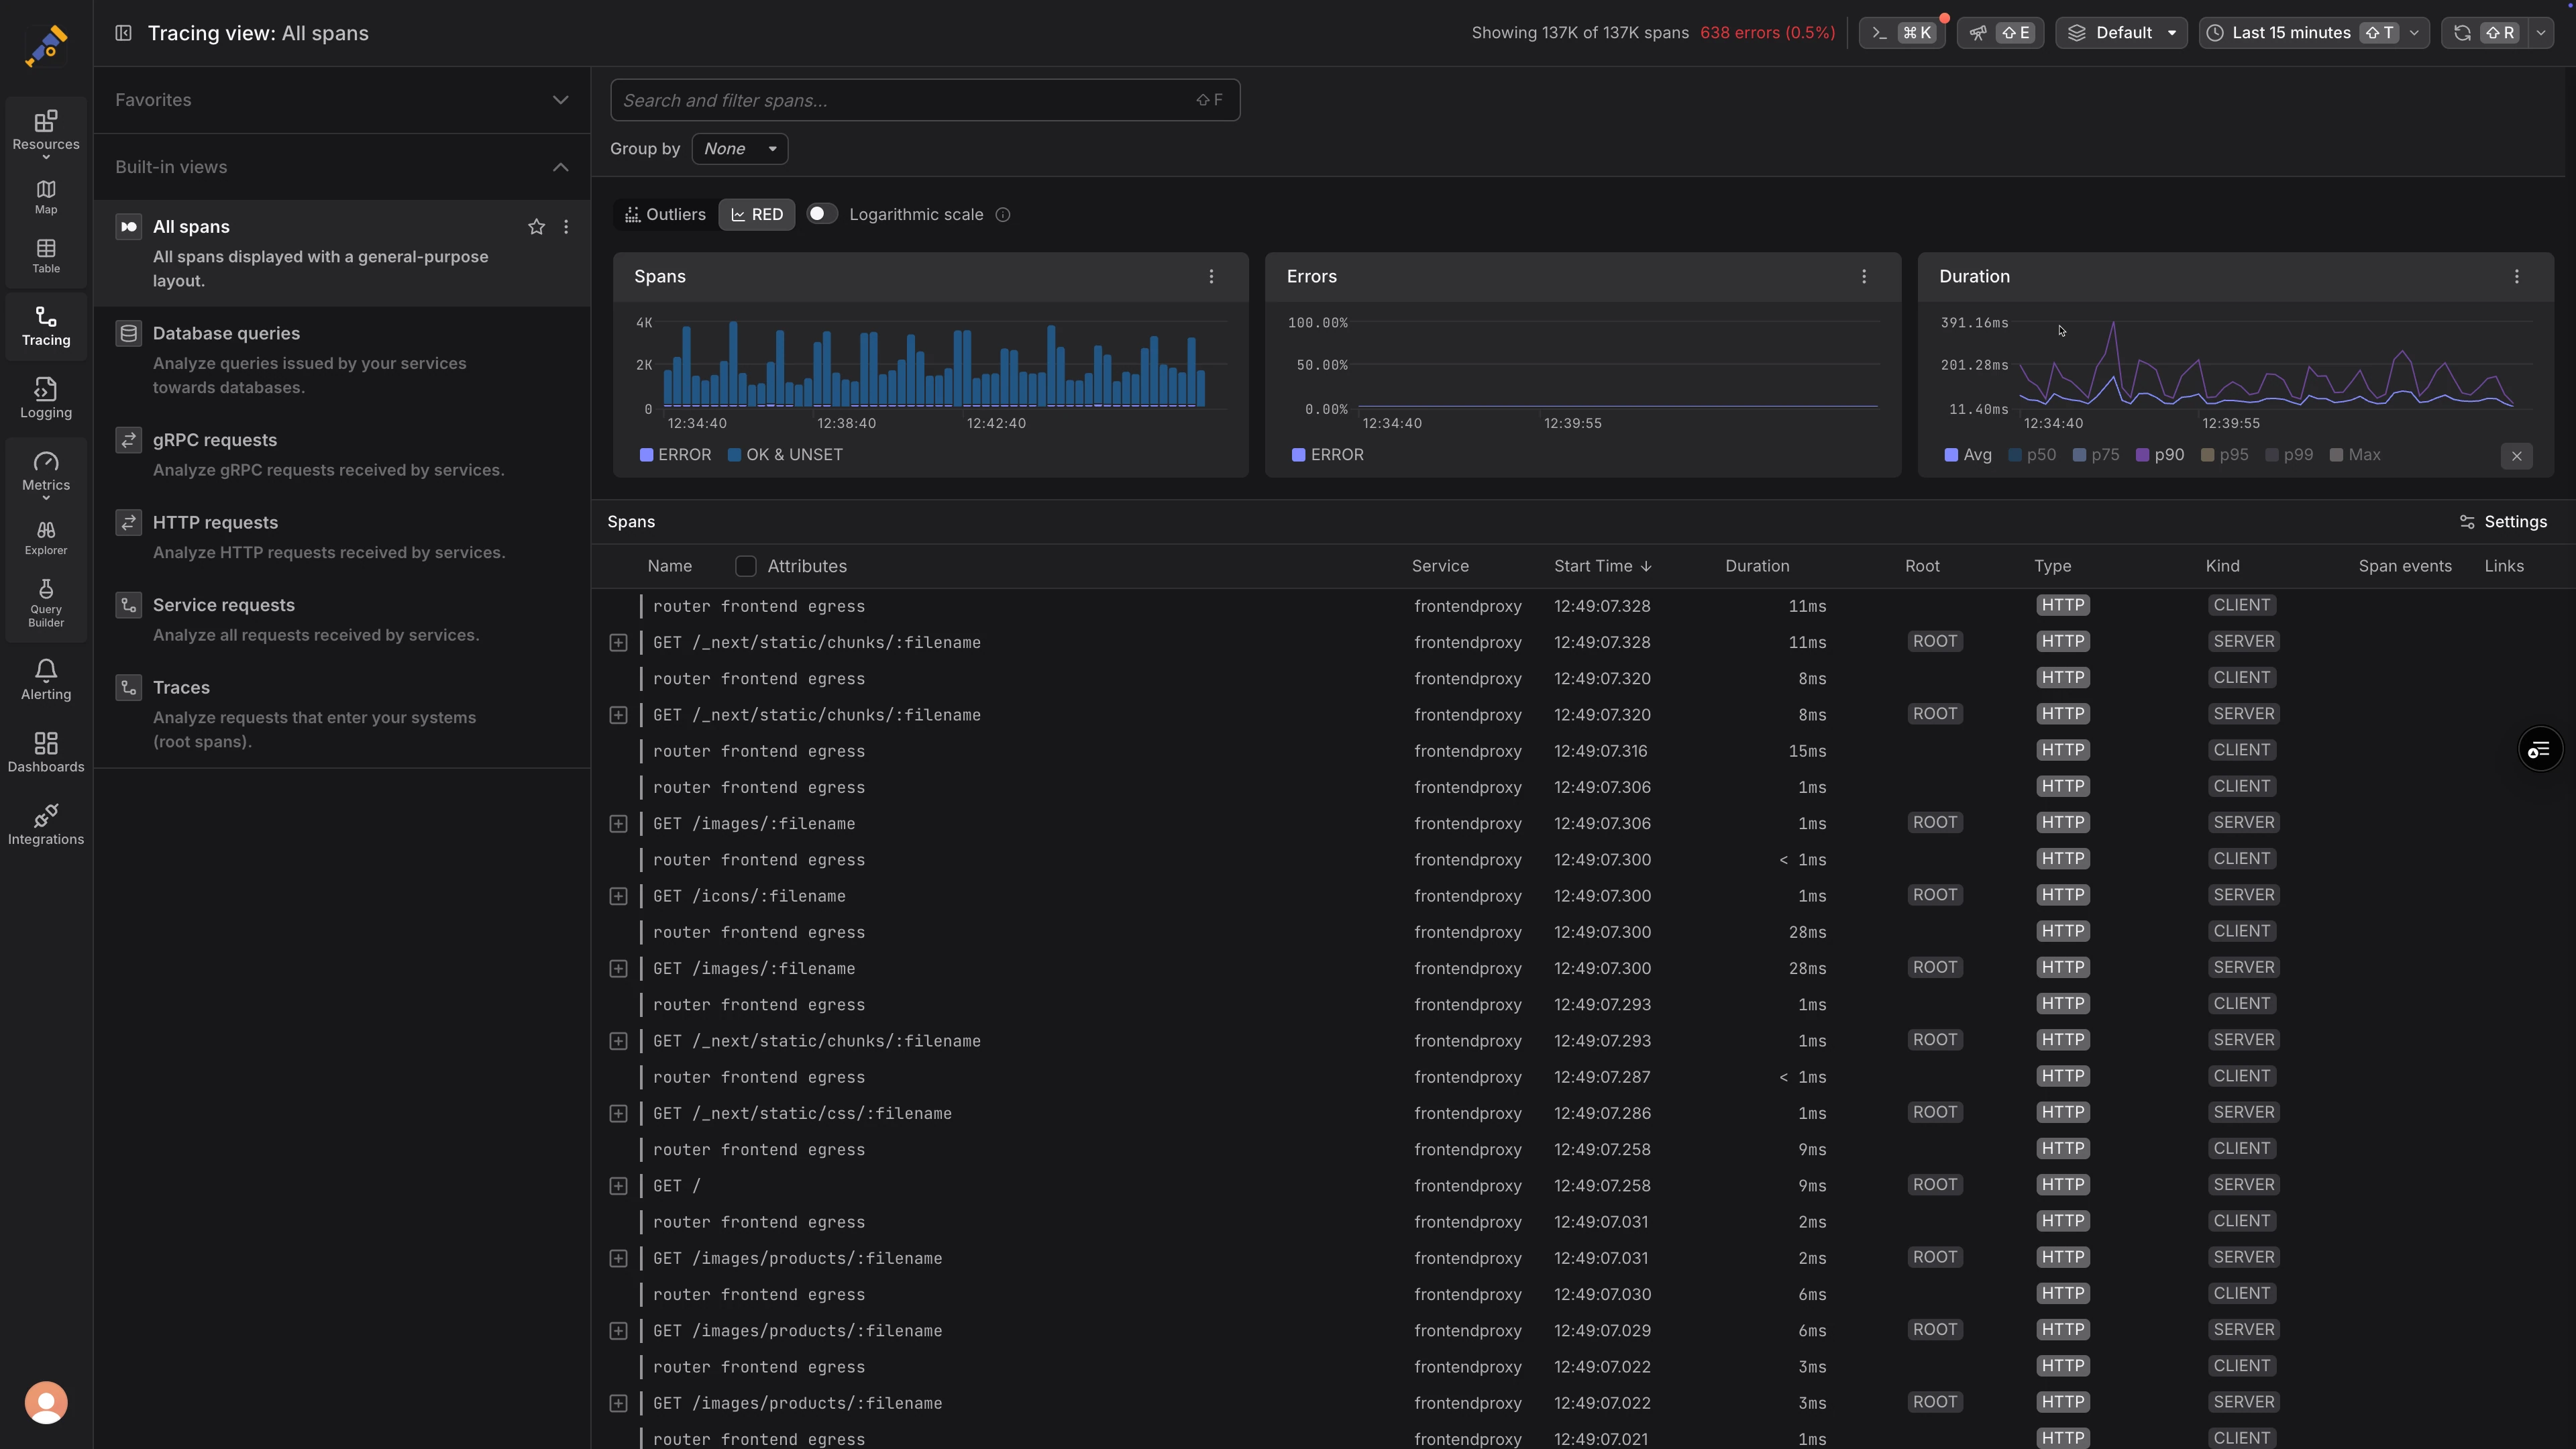
Filter which resources, traces, logs, and metrics you want to see, and customize the way you see them. Predefined views for Kubernetes, cloud providers, and key trace and log use cases.
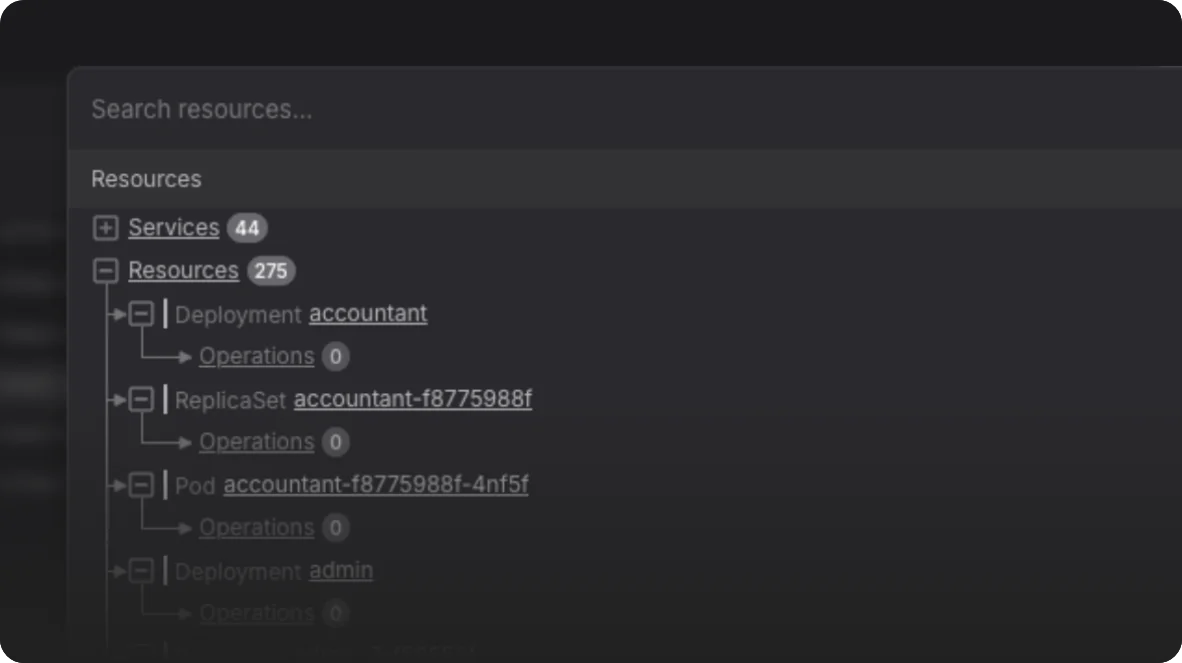
Explore all your resources and signals effortlessly with our intuitive explorer. It adapts to your specific technologies and environment from cloud vendors, Kubernetes to your application services.
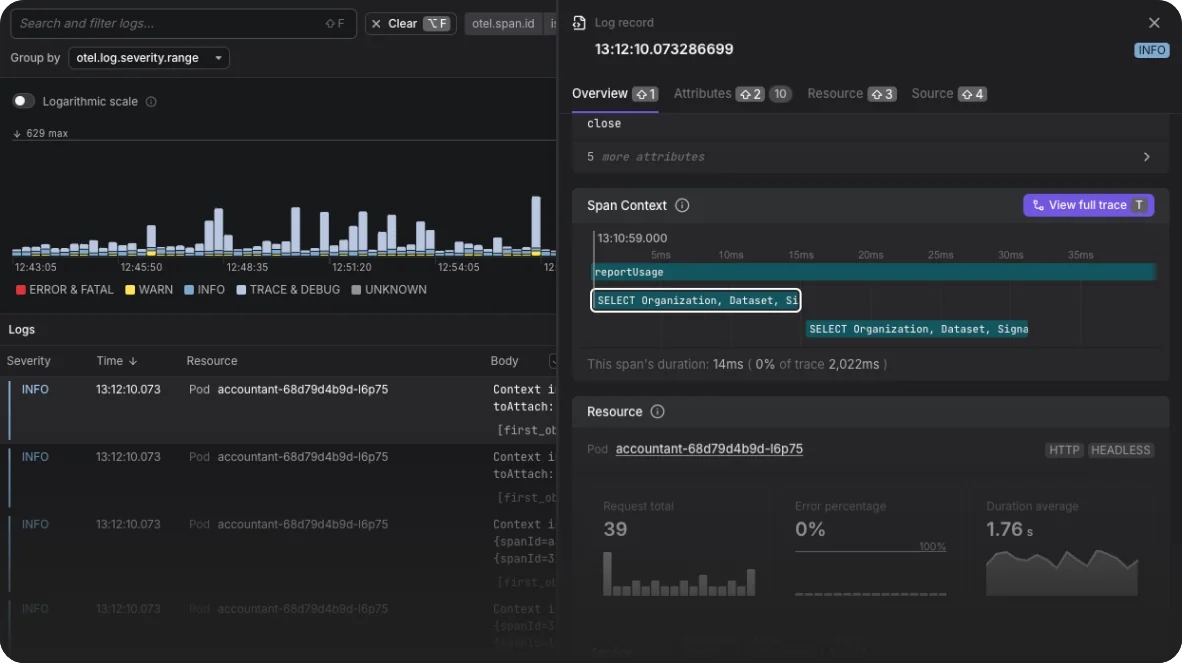
Instantly navigate between logs, traces, and metrics thanks to Dash's resource centricity and OpenTelemetry's trace-context correlation. One click, out of the box.
Vendor-specific libraries and SDKs are a liability. Adopt OpenTelemetry, the de-facto open-source standard for collecting observability data, and free yourself from vendor lock-in.
Virtually all OpenTelemetry setups are centered around the OpenTelemetry Collector: it allows you to collect, transform, sample and forward telemetry to and from an incredible variety of sources and destinations. Every OpenTelemetry Collector out there can be made to talk to Dash0 with a couple lines of configuration. You can even send the same telemetry to multiple destinations, so you can compare apples with apples between Dash0 and other observability tools! By the way, do you know otelbin.io? It’s an open-source tool by Dash0 to help you configure your OpenTelemetry Collectors!
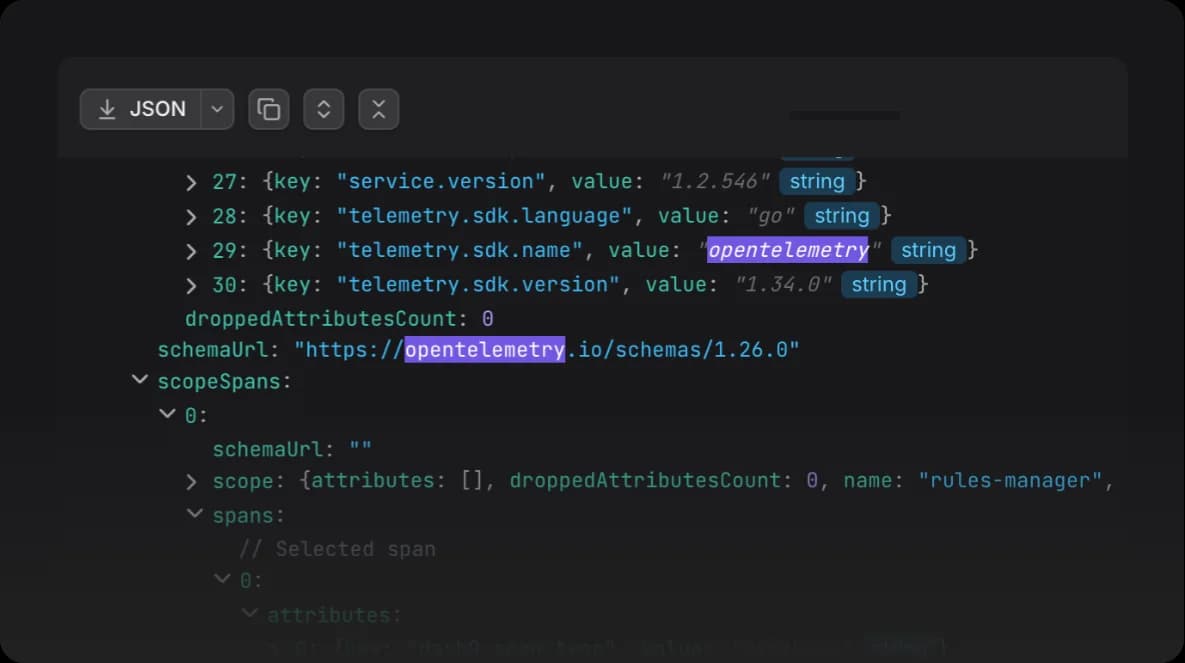
Dash0 is OpenTelemetry-native, enabling standardized and efficient data collection, transmission, and analysis across distributed systems. Enjoy interoperability with modern observability ecosystems.
Start for free or Book a demo
Explore the world of distributed tracing with our detailed guide, 'Best Distributed Tracing Tools in 2025'. This resource covers a carefully selected range of tools available today, offering practical solutions to enhance system performance, simplify debugging, and improve observability—all tailored to meet the needs of modern applications.