Last updated: June 15, 2026
Choosing a Go Logging Library in 2026
For most of Go's history, picking a logging library meant choosing between Logrus, zap, zerolog, and a handful of others that each brought their own API, idioms, and opinions about how structured logging should work.
That era is largely over. Since Go 1.21, log/slog provides a standard frontend that the ecosystem has converged around. That shift simplifies things, but it doesn't eliminate the decision entirely.
This guide covers what's worth considering today: which libraries still matter, how they perform, where they differ, and when slog on its own is all you need.
1. Slog
If you're starting a new Go project, your application code should just use
log/slog. Not because it's the fastest option or because it has the best API,
but because it's in the standard library, the ecosystem has aligned behind it,
and you can plug in a different backend later if you actually need one.
The slog.Handler interface decouples your application code from the encoding
engine underneath it. If slog's built-in JSON handler turns out to be too slow
for a particular service, you can swap in a different backend by changing your
initialization code without touching any of your logging statements.
A typical setup with the JSONHandler looks like this:
123456789opts := &slog.HandlerOptions{AddSource: true,Level: slog.LevelInfo,}logger := slog.New(slog.NewJSONHandler(os.Stderr, opts),)slog.SetDefault(logger)
This gives you structured JSON output, source file attribution, and runtime
level control through slog.LevelVar (which is safe to update from any
goroutine), with no external dependencies.
The API supports three calling conventions:
1234567891011121314// Loosely typed key-value pairs (simplest to write)slog.Info("request", "method", "GET", "status", 200)// Context-accepting variant (recommended as the default)slog.InfoContext(ctx, "request",slog.String("method", "GET"),slog.Int("status", 200),)// Typed attributes only (catches type errors at compile time)logger.LogAttrs(ctx, slog.LevelInfo, "request",slog.String("method", "GET"),slog.Int("status", 200),)
The LogValuer interface also lets you control how types appear in log output.
Its main use case is log redaction without relying on developers to remember to
sanitize or omit
sensitive values
at every call site:
12345type APIKey stringfunc (APIKey) LogValue() slog.Value {return slog.StringValue("REDACTED")}
slog also provides the cleanest path into
OpenTelemetry-native logs.
The
otelslog bridge
implements slog.Handler and routes your log records through the OpenTelemetry
Logs SDK.
Instead of writing JSON entries to stdout, your Go logs become first-class OTel
signals, exported alongside traces and metrics through whatever pipeline you've
configured:
12345678910111213import ("go.opentelemetry.io/contrib/bridges/otelslog""go.opentelemetry.io/otel/log/global")// After initializing your OTel SDK and setting// the global LoggerProvider:logger := otelslog.NewLogger("otelslog-demo",otelslog.WithLoggerProvider(LoggerProvider),)slog.SetDefault(logger)
One important detail is that the bridge reads span context from the
context.Context you pass in, which means you need to use the context-accepting
methods (InfoContext(), ErrorContext(), etc) and have an active span in that
context.
When you do, the resulting OTel log records carry the matching trace and span IDs, allowing your observability backend to automatically correlate logs with the traces they belong to.
123456789// This gets trace correlation (context carries the active span):logger.InfoContext(ctx, "processing request",slog.String("order_id", orderID),)// This doesn't (no context, no span to correlate):logger.Info("processing request",slog.String("order_id", orderID),)
Where slog falls short
slog gets a lot right, but its API has some real weaknesses. The loosely typed
key-value API (slog.Info("msg", "key", val)) is the most convenient way to
write logging calls, but it's also the most error-prone.
Passing an odd number of arguments, mistyping a key, or accidentally swapping a
key and value all compile without complaint and produce silently malformed
output at runtime. The typed slog.Attr constructors fix this but make every
log call noticeably more verbose.
slog also doesn't include Trace or Fatal levels by default and omits
features like deduplication, ring-buffer logging, and sampling that third-party
libraries have long treated as standard.
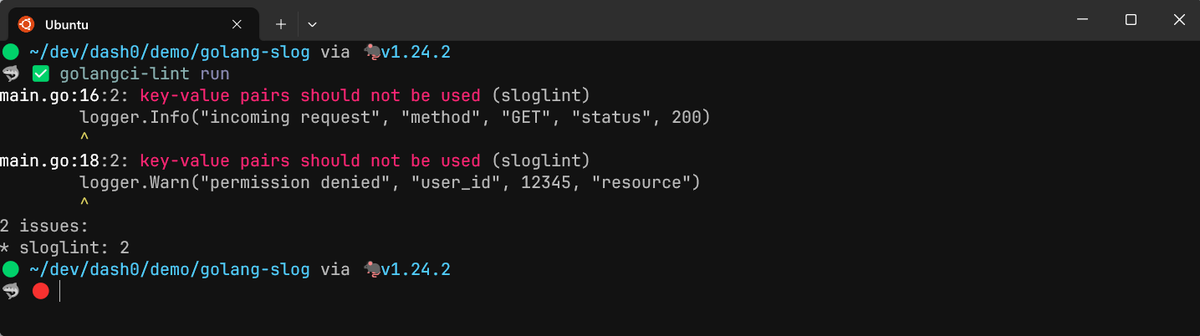
The ecosystem has addressed most of these gaps. sloglint catches malformed log calls and enforces consistent argument styles, and a growing collection of community packages fills in everything else, from sampling and enrichment to log routing and testing.
2. Zerolog
Zerolog remains the top performer in
encoding benchmarks, and its chained API is one of
the more pleasant interfaces in the Go ecosystem. Each method returns the same
*Event, so calls flow as a single expression:
1234567891011logger := zerolog.New(os.Stderr).With().Timestamp().Caller().Logger()log.Info().Str("method", "GET").Int("status", 200).Dur("latency", 47*time.Millisecond).Msg("request completed")
Context integration works just as cleanly. You can attach a logger to a
context.Context, accumulate fields across the lifetime of a request, and
retrieve it anywhere:
123456ctx = log.With().Str("request_id", "abc-123").Logger().WithContext(ctx)log.Ctx(ctx).Info().Msg("processing")
It also provides a sampling system that permits a burst of messages per time window and then throttles to a probabilistic rate, which is useful in high-throughput systems where log deduplication matters.
If raw encoding speed is your primary concern and you're willing to use zerolog's API directly, it's the fastest option available with a mature community behind it.
You can also use it as a slog backend through its NewSlogHandler() method,
which gives you slog's standard API with zerolog's encoder underneath:
1234567func main() {zl := zerolog.New(os.Stderr).With().Timestamp().Logger()handler := zerolog.NewSlogHandler(zl)logger := slog.New(handler)logger.Info("user logged in", "user", "alice", "role", "admin")}
The main footgun with Zerolog's API to watch for is that if you forget to call
.Msg() or .Send() at the end of a chain, the log entry is silently dropped.
The zerolog.Event object is pooled, so a missing terminator also leaks memory.
Another caveat is that zerolog's slog bridge is significantly slower that its native performance and other slog backends. The benchmarks below cover this in detail, but if you need zerolog's speed, use its native API.
3. Zap
Zap is the most widely
deployed high-performance Go logger, running at Uber's scale for years. Its
central design choice is offering two APIs in one package: the zero-allocation
typed Logger for hot paths and the loosely-typed SugaredLogger for
everything else.
123456789101112131415logger, _ := zap.NewProduction()defer logger.Sync()// Typed Logger: zero allocationslogger.Info("request completed",zap.String("method", "GET"),zap.Int("status", 200),zap.Duration("latency", 47*time.Millisecond),)// SugaredLogger: slightly slower, more concisesugar := logger.Sugar()sugar.Infow("request completed","method", "GET", "status", 200,)
Where zap distinguishes itself is the zapcore.Core interface which separates
encoding, output, and level filtering into composable pieces, allowing you to
wire up sophisticated pipelines:
12345678910111213core := zapcore.NewTee(zapcore.NewCore(jsonEncoder, fileOut, zap.InfoLevel,),zapcore.NewCore(consoleEncoder, os.Stderr, zap.DebugLevel,),)logger := zap.New(core,zap.AddCaller(),zap.AddStacktrace(zap.ErrorLevel),)
The zaptest/observer package captures structured log entries for programmatic assertion, so you can verify exactly what your code logs and under what conditions:
12345678910core, logs := observer.New(zap.DebugLevel)logger := zap.New(core)doSomething(logger)require.Equal(t, 1,logs.FilterField(zap.String("event", "login"),).Len(),)
It also provides an slog adapter that makes using zap as an slog backend straightforward:
1234zapL, _ := zap.NewProduction()slog.SetDefault(slog.New(zapslog.NewHandler(zapL.Core())),)
One notable omission is that despite being probably the most extensible logger
in the ecosystem, zap doesn't support custom log levels and there is no built-in
TRACE level.
4. phuslu/log
phuslu/log is the fastest Go logging library
available today. It's also one of the least known, with ~840 GitHub stars to
zerolog's 12,000 and zap's 24,000, likely because searching for a library called
log turns up everything except what you're looking for.
It started as a zerolog-inspired project and then systematically eliminated every remaining allocation. The API will feel immediately familiar to zerolog users:
1234log.Info().Str("foo", "bar").Int("n", 42).Msg("hello world")
It differs from zerolog in three specific ways:
-
Its printf-style logging achieves zero allocations even with
interface{}arguments. -
It ships a capable
FileWriterwith built-in size-based rotation, max backup count, and timestamp-based filenames, saving you the dependency on lumberjack or similar:go123456789logger := log.Logger{Level: log.InfoLevel,Writer: &log.FileWriter{Filename: "/var/log/app/service.log",MaxSize: 50 * 1024 * 1024,MaxBackups: 7,LocalTime: true,},} -
It includes writers for syslog, journald, and Windows Event Log out of the box, plus an
AsyncWriterbacked by a channel for non-blocking writes.
phuslu/log also has built-in slog support through its .Slog() method, so you
can use it as a slog backend without a third-party adapter:
123456slog.SetDefault((&log.Logger{Level: log.InfoLevel,TimeField: "time",TimeFormat: log.TimeFormatUnixMs,Caller: 1,}).Slog())
The main downside is community size: fewer examples, fewer integrations, fewer people to ask, and a single maintainer. For something as important as logging, that's a real risk to factor in.
There's also no built-in sampling, and support for OpenTelemetry is a known gap that has been requested but not yet implemented.
5. Logrus
Logrus taught a generation of Go developers what structured logging could look like. With over 25k GitHub stars and over 249k importing packages, it remains the most-used Go logging library by raw count. But that number reflects historical adoption rather than current momentum.
The project's README is clear: logrus is in maintenance mode, with no new features planned. So if you have an existing codebase with deep logrus integration and a mature hook setup, the best thing is to migrate to slog.
Start by identifying the hot paths, the request handlers and background workers that log most frequently, and move those to slog with a performant backend. The rest of the codebase can continue using logrus until you get to it.
Definitely don't start new code against logrus. The performance gap is too large
(~15x slower than slog and ~50x slower than zerolog), the
map[string]interface{} architecture can't be fixed without breaking the API,
and the Go ecosystem is broadly moving away from it.
6. charmbracelet/log
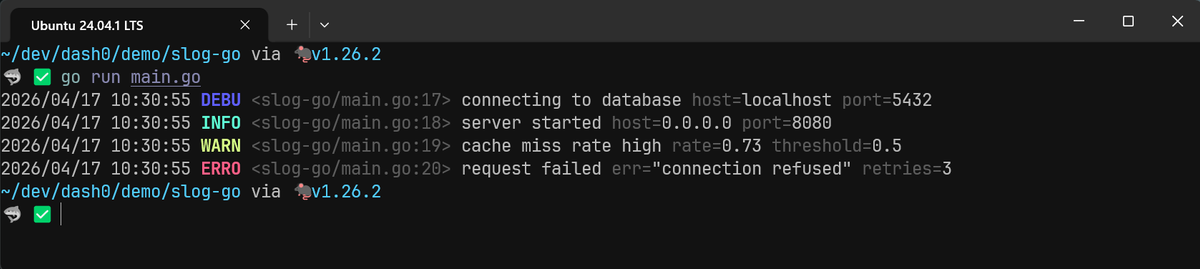
The libraries above are all optimized for production services where logs are consumed by machines. If you're building a CLI tool where a human reads the output directly in a terminal, charmbracelet/log is worth a look.
It's built by the Charm team (the people behind Bubble Tea, Lip Gloss, and the rest of the Charm TUI ecosystem) and it's designed specifically for terminal output that's pleasant to read. Logs get intelligent coloring, icons, and spacing that make them scannable at a glance:
12345678910logger := log.NewWithOptions(os.Stderr, log.Options{ReportTimestamp: true,ReportCaller: true,Level: log.DebugLevel,})logger.Info("starting server", "host", "localhost","port", 8080)logger.Error("connection failed", "err", err,"retries", 3)
The v2 release brought
automatic color downsampling through the colorprofile library, so output
adapts to whatever terminal it's running in. Logs look correct whether you're in
a true-color terminal, a basic 16-color SSH session, or piped to a file.
It also supports text, JSON, and logfmt output formats, and implements
slog.Handler, so you can use it as a slog backend. That means you can still
write your CLI application against *slog.Logger and get Charm's styled output
without coupling your code to their API:
123456789101112import ("log/slog"clog "github.com/charmbracelet/log")handler := clog.NewWithOptions(os.Stderr, clog.Options{ReportTimestamp: true,Level: clog.DebugLevel,})slog.SetDefault(slog.New(handler))slog.Info("using slog with charm output")
It also integrates with Gum for logging
in shell scripts, supports sub-loggers through log.With(), and includes a
custom log.Fatal level that the standard slog deliberately omits.
charmbracelet/log isn't a replacement for zerolog or zap in a production backend. It's the right choice when your audience is a developer staring at a terminal, and you want the output to be as polished as the rest of your CLI.
Performance benchmarks
The following results measure the dominant pattern in production observability:
attach request-scoped fields once, then log many events per request. All
benchmarks were run using the latest library versions on a 16-core machine,
writing to io.Discard to isolate encoding overhead from disk I/O.
Native API
| Library | ns/op | B/op | allocs/op |
|---|---|---|---|
| phuslu/log | 25.32 | 0 | 0 |
| zerolog | 25.77 | 0 | 0 |
| zap | 51.43 | 0 | 0 |
| zap (sugar) | 82.44 | 16 | 1 |
| slog | 101.00 | 0 | 0 |
| logrus | 9126 | 3078 | 55 |
| charm/log | 16786 | 9353 | 61 |
phuslu/log and zerolog lead at ~25 ns with zero allocations, while zap follows
at ~51 ns. The sugared API adds one allocation per call from boxing into a
variadic interface{} argument, a small but consistent cost that compounds
under load.
slog's standard JSON handler lands at ~101 ns, which is the baseline you're
implicitly accepting when you use log/slog without a custom handler. logrus
and charm/log are in a different performance class entirely, both exceeding 9 µs
per call with heavy allocations. The latter is optimized for terminal
readability, not throughput, so this is expected.
As slog backends
The slog.Handler interface lets you keep the standard API while swapping the
encoding engine. These numbers reflect how each library performs when used in
this manner:
| Backend | ns/op | B/op | allocs/op |
|---|---|---|---|
| phuslu/log | 37.91 | 0 | 0 |
| zap | 69.99 | 0 | 0 |
| slog (std) | 101.00 | 0 | 0 |
| zerolog | 1180 | 1442 | 16 |
phuslu/log at ~38 ns is the fastest slog-compatible backend, delivering roughly 2.7x the throughput of the standard JSON handler, and zap's slog adapter only adds modest overhead over its native API.
zerolog is a notable exception. Natively, it's the second-fastest library at ~25 ns with zero allocations, thanks to pre-serializing accumulated context fields into a reusable byte buffer.
That optimization doesn't carry through to its slog bridge which stores
WithAttrs fields as raw []slog.Attr and re-encodes them on every Handle()
call, resulting in a 46x slowdown compared to the native API.
Picking the right Go logging library
Most services should write all application code against *slog.Logger, and
start with slog.NewJSONHandler(). This will usually be fast enough and you
won't need to think about it again.
If profiling shows logging as a bottleneck, then swap in a faster backend. As the benchmarks show, phuslu/log behind slog is 2-3x faster than the built-in JSON handler, and zap's adapter is also a solid upgrade.
If you need maximum throughput and are willing to forgo slog's frontend for a
library-specific API, zerolog offers the best combination of speed and community
size. Zap is the better choice when you value extensibility and production
tooling like AtomicLevel, zapcore.Core composition, and zaptest/observer
for testing.
If you're using OpenTelemetry, slog plus the otelslog bridge gives you the
most straightforward integration. Just ensure to use the Context variants of
the log methods (or LogAttrs()) with active spans to achieve consistent trace
correlation.
And for CLI tools, using charmbracelet/log as the backend for slog gives you
polished terminal output without sacrificing the standard API.
Final thoughts
The library matters less than what you do with it. A bad logging strategy looks the same in production regardless of which encoder is underneath. Get the fields right, wire up trace correlation, and make sure you're sending the logs to an observability platform that actually helps you out when something breaks.
If you're looking for an observability platform that's built around OpenTelemetry and treats logs, traces, and metrics as connected signals rather than separate tools, give Dash0 a try.
