Last updated: June 9, 2026
Serilog Log Levels Explained and How to Use Them
If you're building C# or .NET services that need to run reliably in production, logging is one of the primary ways to understand what the system is actually doing once it leaves your laptop.
Serilog gives you a structured, expressive logging model, and log levels are one of the signals it provides to communicate how important a given message is.
When you choose a level, you're answering a future question:
- Is this something I expect to see every day?
- Is this something I want alerts for?
- Is this something I’ll only enable during active troubleshooting?
Serilog’s level system gives you enough precision to express that intent clearly, as long as you use it consistently.
In this article, we’ll walk through what each Serilog level actually means in practice and how to avoid the subtle mistakes that quietly make logs noisy, expensive, or useless.
Serilog log levels in order
Serilog defines six log levels, ordered from least to most severe. Each level communicates how important an event is and what kind of response it warrants.
| Level | When to use it |
|---|---|
Verbose | Very fine-grained execution detail used for deep troubleshooting. |
Debug | Diagnostic context that explains internal decisions and state. |
Information | Normal, expected business or operational events. |
Warning | Undesirable conditions that may require action if they persist. |
Error | An operation failed and functionality was impacted, but the process continues. |
Fatal | An unrecoverable condition that forces the application to terminate. |
As severity increases, log volume should decrease while urgency and actionability increase.
How to set the log level of an event
In Serilog, you choose the log level at the moment you write the log. That choice should follow a simple operational model: what happened, and what should someone do about it later?
Most of the time, you’ll set the level by calling a level-specific method:
123456Log.Verbose("Entering {Handler} with payloadSize={PayloadBytes}", nameof(ProcessOrder), payloadBytes);Log.Debug("Selected shipping method {Method} because ruleset={Ruleset} matched", method, rulesetName);Log.Information("Order {OrderId} placed by customer {CustomerId} total={Total}", orderId, customerId, total);Log.Warning("Database pool near capacity current={Current} max={Max}", currentConnections, maxConnections);Log.Error(ex, "Payment authorization failed orderId={OrderId} provider={Provider}", orderId, providerName);Log.Fatal(ex, "Required configuration missing: {ConfigKey}. Exiting.", "PAYMENTS_API_KEY");
A useful mental model when choosing a level is to follow these general heuristics:
-
Verbose/Debug: Use these when you’re trying to understand how the system behaves internally. They’re usually disabled by default and only used to surface additional details during active troubleshooting. -
Information: Use this for routine, expected events that describe what the system is doing under healthy conditions. -
Warning: Use this when an event may require investigation if it continues, but doesn’t represent a failure yet. -
Error: Did an operation fail to complete, even though the process continues running? That’s anError, and these events should be monitored for spikes and trends. -
Fatal: Is the system in a state it can’t safely recover from and must exit? That’sFatal.
You can also set the log level by passing it explicitly as an argument, though this is less common in application code:
123456789101112Log.Write(LogEventLevel.Verbose,"Entering {Handler} with payloadSize={PayloadBytes}", nameof(ProcessOrder), payloadBytes);Log.Write(LogEventLevel.Debug,"Selected shipping method {Method} because ruleset={Ruleset} matched", method, rulesetName);Log.Write(LogEventLevel.Information,"Order {OrderId} placed by customer {CustomerId} total={Total}", orderId, customerId, total);Log.Write(LogEventLevel.Warning,"Database pool near capacity current={Current} max={Max}", currentConnections, maxConnections);Log.Write(LogEventLevel.Error, ex,"Payment authorization failed orderId={OrderId} provider={Provider}", orderId, providerName);Log.Write(LogEventLevel.Fatal, ex,"Required configuration missing: {ConfigKey}. Exiting.", "PAYMENTS_API_KEY");
This form is mainly useful when building abstractions or tooling on top of Serilog. In most cases, the level-specific methods are clearer and easier to read.
Mapping Serilog's levels to OpenTelemetry's severity model
Serilog’s six levels line up cleanly with OpenTelemetry’s six named severity categories (TRACE, DEBUG, INFO, WARN, ERROR, FATAL) and their numeric ranges:
| Serilog level | OTel SeverityText | OTel SeverityNumber range |
|---|---|---|
Verbose | TRACE | 1-4 |
Debug | DEBUG | 5-8 |
Information | INFO | 9-12 |
Warning | WARN | 13-16 |
Error | ERROR | 17-20 |
Fatal | FATAL | 21-24 |
A couple of practical notes:
- In OpenTelemetry,
SeverityTextis the level label (TRACE,INFO, etc), whileSeverityNumberis the normalized value used for consistent categorization across languages and logging libraries. - Within a severity category, higher numbers mean “more severe”, but most Serilog setups map each level to a sensible point in the corresponding range.
You can use the official Serilog OpenTelemetry sink to handle this mapping automatically.
Controlling the minimum log level in Serilog
If no minimum level is explicitly configured when setting up a Serilog logger,
it defaults to Information.
This means only Information, Warning, Error, and Fatal messages will be
processed and sent to the configured sinks (outputs), while Verbose and
Debug messages are suppressed.
1234567891011121314using Serilog;Log.Logger = new LoggerConfiguration().WriteTo.Console().CreateLogger();Log.Verbose("This will not appear."); // Lower than InformationLog.Debug("This will also not appear."); // Lower than InformationLog.Information("This will appear by default.");Log.Warning("This will appear.");Log.Error("This will appear.");Log.Fatal("This will appear.");Log.CloseAndFlush();
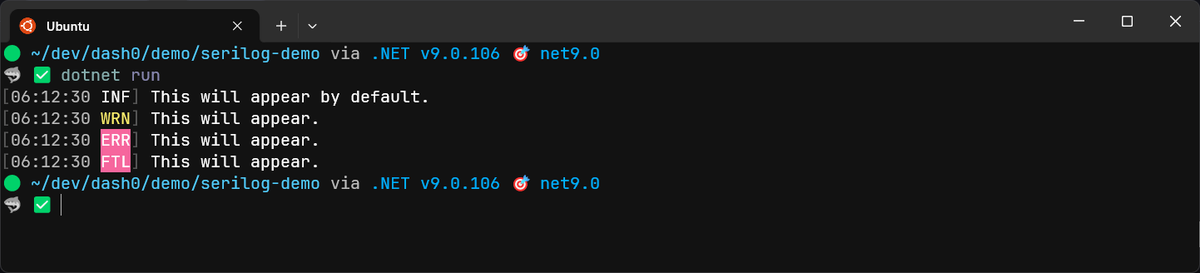
This default behavior prioritizes messages that provide insight into the application’s operational status and critical issues, minimizing log noise in typical production scenarios unless more detailed logging is explicitly enabled.
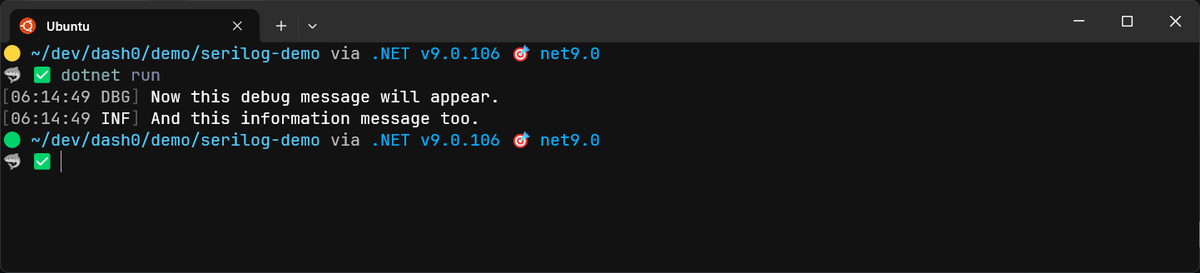
To see Verbose or Debug messages, you must configure Serilog with a lower
minimum level threshold:
123456789Log.Logger = new LoggerConfiguration().MinimumLevel.Debug() // Set the global minimum level.WriteTo.Console().CreateLogger();Log.Debug("Now this debug message will appear.");Log.Information("And this information message too.");Log.CloseAndFlush();
The global minimum level acts as a hard floor. Events below it are never created, which means they incur almost no runtime cost.
Setting levels for specific source contexts
Serilog allows you to override the minimum level for messages originating from specific type or namespace contexts.
This is useful for enabling more detailed logging in certain parts of your application while keeping global logging less verbose.
1234567891011121314151617181920212223Log.Logger = new LoggerConfiguration().MinimumLevel.Information() // Global minimum.MinimumLevel.Override("MyNamespace.MyClass", Serilog.Events.LogEventLevel.Debug) // Override for MyNamespace.MyClass.WriteTo.Console().CreateLogger();// In MyNamespace.MyClassnamespace MyNamespace.MyClass{public class PaymentProcessor{public void Process(string orderId){// This will be loggedLog.ForContext<PaymentProcessor>().Debug("Starting payment processing for order {OrderId}", orderId);}}}// Outside of the overridden class, this will not appear since the global minimum// is InformationLog.Debug("This debug message from elsewhere will NOT appear.");
Setting a different log level for Serilog sinks
Each configured sink can also have its own independent minimum log level.
A message must first pass the logger’s global or context-specific minimum level, and then, if it’s routed to a sink with its own level restriction, it must also pass that sink’s check:
12345678Log.Logger = new LoggerConfiguration().MinimumLevel.Debug() // Global minimum is Debug.WriteTo.Console(restrictedToMinimumLevel: Serilog.Events.LogEventLevel.Information) // Console only gets Info and above.WriteTo.File("log.txt", restrictedToMinimumLevel: Serilog.Events.LogEventLevel.Debug) // File gets Debug and above.CreateLogger();Log.Debug("This will go to the file, but not the console.");Log.Information("This will go to both the file and the console.");
In this setup:
- Debug events go to the file
- Console output stays clean and readable
- Higher-severity events go everywhere
If a sink doesn’t specify restrictedToMinimumLevel, it will capture all events
that pass the logger’s active minimum level.
Configuring Serilog log levels in appsettings.json
Most ASP.NET Core apps configure Serilog log levels in appsettings.json so you
can adjust verbosity without redeploying:
1234567891011121314151617181920{"Serilog": {"MinimumLevel": {"Default": "Information","Override": {"MyApp.Payments": "Debug"}},"WriteTo": [{"Name": "File","Args": { "path": "app.log" }},{"Name": "Console","Args": { "restrictedToMinimumLevel": "Information" }}]}}
Then load it in Program.cs:
12builder.Host.UseSerilog((context, services, cfg) =>cfg.ReadFrom.Configuration(context.Configuration));
Updating the Serilog level at runtime
Serilog also supports changing log levels at runtime, which lets you temporarily increase or decrease verbosity while the system is running.
This is especially useful during an active production incident, when you need to surface lower-level details to investigate a problem without restarting or redeploying the service.
A LoggingLevelSwitch makes this straightforward:
1234567891011121314using Serilog.Core;var levelSwitch = new LoggingLevelSwitch();levelSwitch.MinimumLevel = Serilog.Events.LogEventLevel.Information; // Initial levelLog.Logger = new LoggerConfiguration().MinimumLevel.ControlledBy(levelSwitch).WriteTo.Console().CreateLogger();Log.Information("Standard information message.");// Later, perhaps in response to a command or request:levelSwitch.MinimumLevel = Serilog.Events.LogEventLevel.Debug;
If you keep the switch reachable through configuration reloads or admin endpoints, you’ll gain powerful diagnostic control that lets you surface additional details about your service’s behavior only when they’re needed.
Avoiding performance pitfalls with verbose logging
Verbose and Debug logging are valuable when you need them, but they should
have close to zero cost when they’re turned off.
Most logging frameworks, including Serilog, already avoid writing log events below the active level. The remaining risk is the work you do before the log call: string formatting, object allocation, and expensive property evaluation.
This matters most in hot paths like request handlers, tight loops, and high-throughput background workers. In those cases, it’s worth guarding expensive log statements with a level check:
1234if (logger.IsEnabled(Microsoft.Extensions.Logging.LogLevel.Trace)){logger.LogTrace("Processing item {ItemId}", item.Id);}
The check ensures the message template is never processed and the arguments are never evaluated unless the level is actually enabled.
For occasional logs or cold paths, this extra check is usually unnecessary. The goal isn’t to wrap every log call, but to be deliberate where volume and frequency make the cost visible.
Used this way, verbose logging remains a powerful diagnostic tool without quietly becoming a performance tax in production.
Logging exceptions in Serilog
When something fails, always pass the exception object itself to the logger. This allows Serilog to capture the full stack trace and attach it as structured data:
12345678try{ProcessOrder(order);}catch (Exception ex){Log.Error(ex, "Failed to process order {OrderId}", order.Id);}
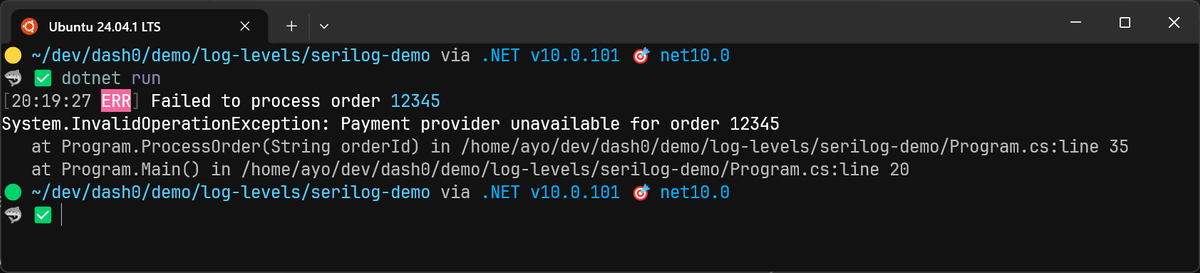
Choosing the right level still matters, but it should follow a clear rule: use
Error when an operation fails but the application can continue running, and
reserve Fatal for unrecoverable conditions where the process must terminate
immediately.
Making Serilog levels actionable with Dash0
Serilog already gives you a strong signal about intent through its log levels. The difference between a useful signal and background noise is whether your tooling knows how to act on it.
Dash0 treats log levels as a first-class input to guide your attention, not just a filter. Higher-severity events naturally rise to the surface, making errors and warnings easier to spot during day-to-day monitoring, while informational and debug logs remain available without overwhelming the view.
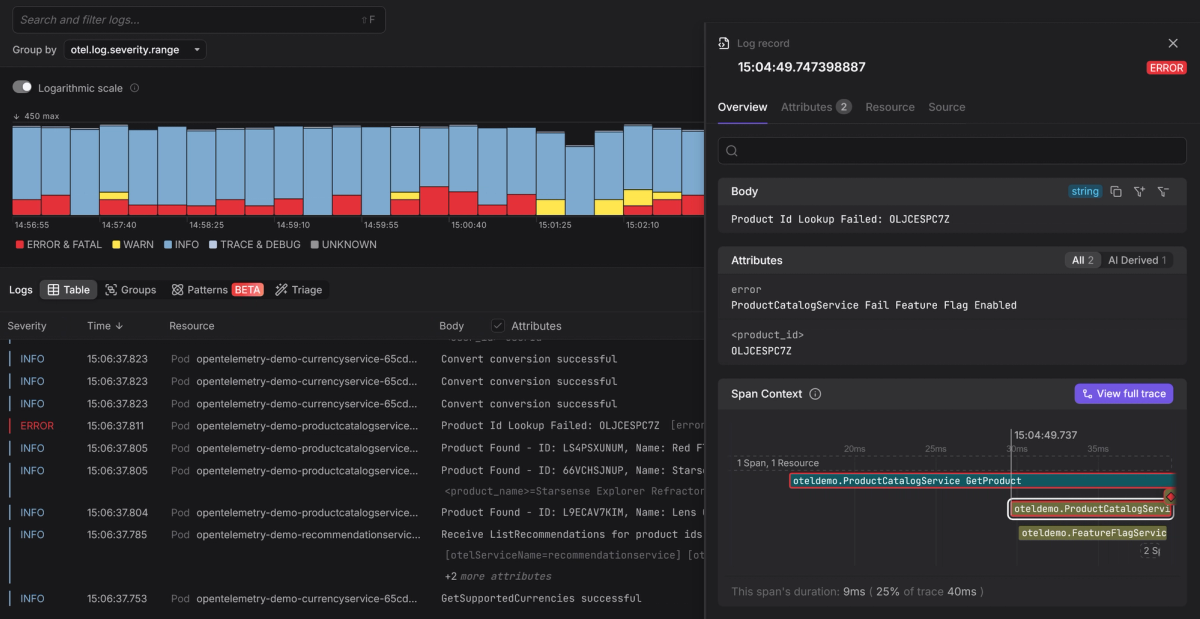
Because Dash0 is
OpenTelemetry-native,
logs are automatically correlated with traces using shared context. That means
you can start from an Error or Fatal log and immediately see the exact
requests and spans involved, then drill into related Debug or Trace logs
only for those executions.
Final thoughts
When you choose levels deliberately, your logs tell a story that’s easy to follow under stress. When you choose them carelessly, your logs become background noise.
If you treat log levels as part of your system design rather than an afterthought, Serilog gives you all the tools you need to build logs that actually help when it matters most.
Try Dash0 today to make log levels actionable, spot problematic trends early, and move from an error log to the root cause behind it in seconds.
