
Last updated: September 14, 2026
OpenTelemetry GenAI Semantic Conventions Explained
Your agent plans a task, calls three tools, hands part of the job to a sub-agent, queries a vector store, and retries twice before it answers. To debug that, you need every step to be a span with a name your backend recognizes. OpenTelemetry's GenAI semantic conventions are that naming standard: span, metric, and event definitions for model calls, tool execution, retrieval, memory, and full agent runs.
This is a reference for what's actually in that vocabulary as of mid-2026, what each operation type models, and what to pin so a spec revision doesn't quietly break your dashboards. It assumes you already know why AI systems need observability at all. If you don't, what is LLM observability covers the discipline, how output quality gets scored, and the security signals worth alerting on. For how semantic conventions work in general, across resources, traces, metrics, and logs, read the semantic conventions explainer first.
One thing to get straight before anything else: none of this is stable yet.
What Development status actually means
Semantic conventions move through three stability levels: Development, Release Candidate, and Stable. Every gen_ai.* span, metric, and attribute in the registry sits at Development, the first rung. That means the convention can change between releases without the compatibility guarantees that apply to settled namespaces like http.* or db.*. Attribute names can be renamed, span shapes can be restructured, and you don't get a deprecation window.
Look at any GenAI span and the only Stable attributes on it are error.type, server.address, and server.port, all inherited from the core conventions rather than written by the GenAI group. Everything with a gen_ai. prefix is Development.
On 12 June 2026, in v1.42.0, the conventions moved out of the core semantic conventions repository into a dedicated one, semantic-conventions-genai, specifically so this area could iterate faster than the core stability bar allows. The Model Context Protocol (MCP) conventions moved with them. The old opentelemetry.io/docs/specs/semconv/gen-ai/ pages are now redirect stubs, so check any bookmark or internal doc still pointing at them.
I think the split is the right call for a domain changing this quickly. It's also a warning label, and it should change how you adopt rather than whether you adopt.
One wrinkle worth knowing before you plan around version pinning: the new repository has published no tagged release. It ships from main against schema gen-ai/1.42.0, and its README still lists the schema URL as TODO. So "pin the convention version" is advice you apply at the instrumentation layer, by pinning the library and recording which schema it targets, not by pointing at a spec release that doesn't exist yet. Keep the raw attribute strings behind a thin mapping layer in your own code, and budget for a dashboard revision when the names shift.
What a single model call looks like
Start with one call to a chat model. The conventions model this as a CLIENT span, and for inference the name is {gen_ai.operation.name} {gen_ai.request.model}, so a call to GPT-4 produces a span literally named chat gpt-4. Other operations substitute their own identifier, which the next section covers.
Two attributes are required on every inference span:
gen_ai.operation.name: what kind of call this was.gen_ai.provider.name: which provider handled it.openai,anthropic,aws.bedrock, and so on.
Below that sits a conditionally required tier, which is easy to miss. gen_ai.request.model belongs to it, required whenever the value is available, and so do error.type when the call fails, gen_ai.conversation.id, and gen_ai.output.type. Capture gen_ai.response.model alongside the request model, because the model you asked for and the model that served the request are not always the same.
Then the recommended tier, which is where most of the useful data lives: gen_ai.usage.input_tokens and gen_ai.usage.output_tokens, temperature, top_p, and finish reasons. The token attributes have grown a lot of relatives worth knowing about, including gen_ai.usage.cache_read.input_tokens and gen_ai.usage.reasoning.output_tokens, both of which matter once you start attributing cost properly.
Notice what isn't in that list: the prompt and the response text. That's deliberate, and it's covered below.
For what this looks like on real traffic, the Spring AI walkthrough shows chat spans carrying these attributes out of the box.
The operation vocabulary
gen_ai.operation.name is the pivot the whole standard turns on. It no longer just describes a call to a model, it describes the agent making the call.
| Operation | What it models | Notable attributes | Span name |
|---|---|---|---|
chat, generate_content, text_completion | A single inference call | gen_ai.request.model, gen_ai.usage.* | {operation} {request.model} |
embeddings | Embedding generation | gen_ai.request.model | {operation} {request.model} |
create_agent, invoke_agent | Agent lifecycle and a single agent run | gen_ai.agent.name, gen_ai.agent.id, gen_ai.agent.version | {operation} {agent.name} |
invoke_workflow | An orchestrated multi-step process | gen_ai.workflow.name | invoke_workflow {workflow.name} |
plan | The reasoning and decomposition step | gen_ai.agent.name | plan {agent.name} |
execute_tool | One tool invocation | gen_ai.tool.name, gen_ai.tool.call.id, gen_ai.tool.type | execute_tool {tool.name} |
retrieval | A vector store or RAG lookup | gen_ai.data_source.id, gen_ai.retrieval.top_k | {operation} {data_source.id} |
create_memory, search_memory, upsert_memory | Persistent memory operations | gen_ai.memory.store.id, gen_ai.memory.record.count | {operation} |
Note the span names. There isn't one universal format. Each operation substitutes whichever identifier is meaningful and low-cardinality for that kind of work, which is why a retrieval span is named after its data source and a tool span after the tool. Memory spans carry store IDs and record counts by default, with the records themselves and the query text available as opt-in attributes, the same treatment message content gets.
The split matters more than it sounds. "The agent gave a bad answer" used to be one unactionable log line. With these operations as separate spans, you can tell whether retrieval returned garbage or the model reasoned badly over good context, and whether a tool failed or was never called at all. A broken internal API shows up as a normal downstream error on a normal child span rather than a mysterious model problem.
An agent run is a trace tree
Put the operations together and a single agent turn looks like this:
1234567invoke_agent "research-assistant"├── chat gpt-4 (the model decides what to do)├── execute_tool "web_search"│ └── (HTTP client span to the search API)├── chat gpt-4 (model reads the results, decides next step)├── execute_tool "summarize_doc"└── chat gpt-4 (model produces the final answer)
That's a normal trace. Root span, children, timing, errors, exactly like a checkout flow calling three microservices. The difference is that the services here are a language model and a tool, identified by gen_ai.agent.name and gen_ai.tool.name rather than service.name. A sub-agent nests as another invoke_agent span, so a multi-agent handoff is a deeper tree and not a different kind of data.
The Goose on Ollama guide walks through a real six-span trace with this shape if you want to see one before instrumenting your own.
Because MCP moved into the same repository in v1.42.0, an agent calling a tool over MCP emits the same execute_tool shape as an agent calling a tool directly. You don't need a separate mental model for MCP observability.
The metrics side
Spans tell you what happened in one run. Metrics tell you the shape of the system over time, and this is the part of the spec I'd argue is furthest ahead of most teams' actual instrumentation:
| Metric | What it measures |
|---|---|
gen_ai.client.token.usage | Token counts by type, tagged with operation and model |
gen_ai.client.operation.duration | End-to-end call latency, including error.type for failures |
gen_ai.client.operation.time_to_first_chunk | Streaming latency to the first token |
gen_ai.invoke_agent.duration | Full agent run duration, by agent name |
gen_ai.invoke_agent.tool_calls | How many tool calls an agent run made |
gen_ai.invoke_agent.inference_calls | How many model calls an agent run made |
gen_ai.invoke_workflow.duration | Full workflow duration, by workflow name |
gen_ai.execute_tool.duration | Per-tool execution time, tagged with tool.name and error.type |
There's a gen_ai.server.* family too, covering request.duration, time_to_first_token, and time_per_output_token, for when you're running inference yourself rather than calling a provider.
Wire gen_ai.client.token.usage against your provider's pricing and you have a real-time cost dashboard without a separate FinOps pipeline. That's one of the clearer arguments for adopting early: cost tracking that falls out of your existing metrics backend instead of a billing export you reconcile by hand every month.
gen_ai.invoke_agent.tool_calls and gen_ai.invoke_agent.inference_calls are the underrated pair. A rising median count per run is usually the first visible symptom of an agent starting to loop, and it shows up well before the cost alert does. The ratio between them is the more interesting signal: model calls climbing while tool calls stay flat means the agent is deliberating without acting, which is a different bug from one that keeps retrying the same tool.
Real systems already emit this
Development status makes these conventions sound theoretical. They aren't. OpenTelemetry's May 2026 walkthrough on GenAI observability shows OpenAI Codex exporting metrics and log events for API requests, tool calls, and sessions, and Claude Code exporting metrics and logs with trace support in beta. VS Code Copilot exports GenAI telemetry with prompt content and tool arguments withheld by default, capturing only model name, token counts, and duration unless you turn content capture on explicitly. All of it lands in the same gen_ai.* shape in any OTLP-compatible backend, and Dash0's Claude Code monitoring guide shows what the coding-agent case looks like end to end.
For a full reference implementation, OpenTelemetry Demo 3.0 now ships an agentic stack built on LangGraph with MCP servers and a chatbot UI, tracing tool calls and reasoning steps end to end.
Message content is opt-in on purpose
Prompts and completions aren't span attributes. They're carried in a separate event, gen_ai.client.inference.operation.details, with gen_ai.input.messages and gen_ai.output.messages. The spec is explicit about why: this content routinely contains personal data, and span attributes are indexed, size-limited, and a poor place to put it. The event conventions are themselves still settling, which is worth knowing before you build on the event payload shape.
How you opt in is not something the conventions settle. The spec names OTEL_INSTRUMENTATION_GENAI_CAPTURE_MESSAGE_CONTENT only as an example of what an opt-in might look like, and leaves the rest to instrumentation authors. In practice that variable behaves differently across libraries: some accept true for the legacy capture path, others take span_only, event_only, or span_and_event once you've opted into a newer attribute shape with OTEL_SEMCONV_STABILITY_OPT_IN. Those are SDK-level knobs, not convention-level guarantees, so read the docs for the instrumentation you're actually running rather than trusting any blog post's syntax, this one included.
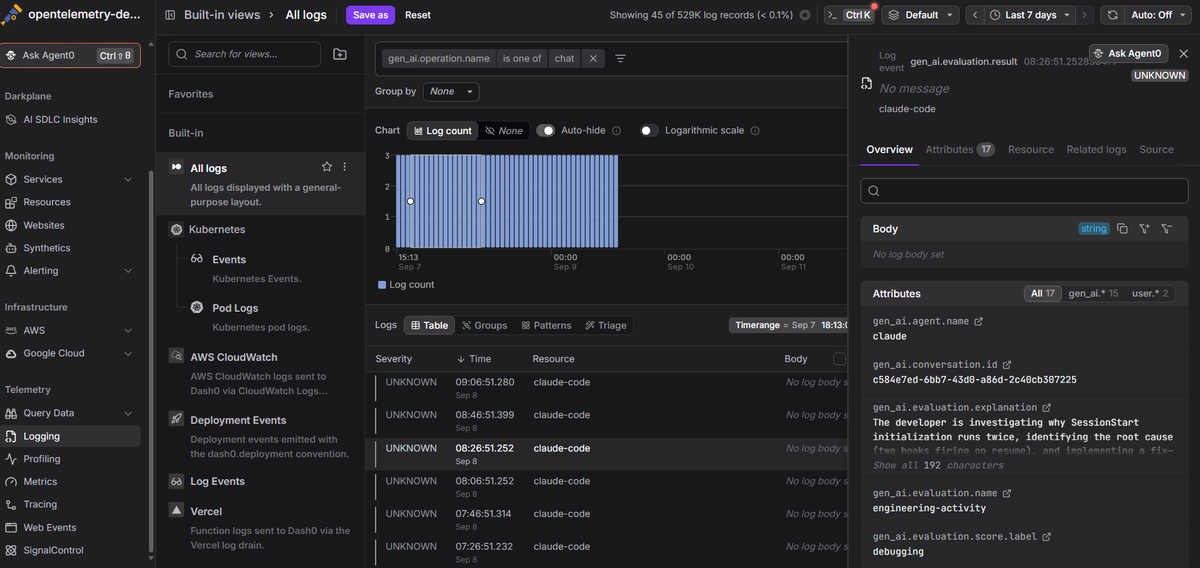
The conventions have also started defining a gen_ai.evaluation.result event, so the evaluation side of this is beginning to get a shared vocabulary too. It's early.
The split gives you a per-environment risk posture. Capture full content in staging and pre-production where you're actively debugging prompt quality, and restrict production to metadata, or route content through redaction before it leaves your infrastructure. Filtering at the source is a much safer place to enforce that policy than hoping every downstream consumer respects a flag.
Metadata alone gets you further than most teams expect. Model, operation, duration, token counts, and error type support a complete cost and latency picture plus most of an error-triage workflow. Content capture then becomes something you reach for on a specific trace once metadata has told you where to look.
Adopting without getting burned
Three things worth doing on day one.
Pin at the library, not the spec. Record which schema version your instrumentation targets, and check whether it offers a stability opt-in for newer attribute shapes. Revisit when you upgrade.
Deal with mixed dialects at ingest rather than in queries. Plenty of instrumentation predates this standardization. Traceloop's OpenLLMetry SDK shipped its own span shape before the GenAI conventions existed and hasn't fully converged, so a mixed-framework setup gives you two vocabularies in one trace. Normally the clean fix for attribute drift is an OpenTelemetry schema file, which lets a backend migrate old names to new ones automatically at ingestion. That doesn't work here yet, because the GenAI repository hasn't published a schema URL. Until it does, a Collector transform processor mapping older attribute names onto their gen_ai.* equivalents is where this belongs. Dash0 also ships a dedicated OpenLLMetry integration for this case, plus a LangChain integration, so your traces read consistently without waiting for every SDK to catch up.
Keep the attribute strings in one place in your own code. When gen_ai.retrieval.top_k gets renamed, you want to change it once.
Final thoughts
An agent run is a trace, a tool call is a span, a model call is a span, and token usage is a metric. That's the whole idea, and the value of the shared vocabulary is that OpenTelemetry and a growing number of the tools you already run agree on the names. It's what makes AI observability an extension of your existing traces rather than a second system you buy and stitch back together.
Read the current conventions before you commit attribute names to a dashboard, because this page will go stale faster than most. For the deeper end, evaluation pipelines, RAG-specific observability, agent SLOs, and security signals, the LLM observability developer's guide picks up where this leaves off. What is agentic observability covers the same ground pointed at the agents writing your code rather than the ones in your product.
Dash0 is an OpenTelemetry-native observability platform built as an AI control plane for production. It ingests gen_ai.* telemetry natively, so agent spans, token metrics, and tool-call errors sit in the same trace as the database query and the HTTP request around them, in the open format, without a separate AI product carrying its own agent and its own bill.
 Start a free trial to see your agent traces and token usage next to the rest of your stack. No credit card required.