Last updated: July 19, 2026
Traces vs Spans in OpenTelemetry
In OpenTelemetry, spans are the data your application actually emits. Each span describes one timed operation such as an HTTP request, a database query, a queue publish, or a background job step.
A trace is not exported as a separate object with its own fields. It's the view your observability backend reconstructs by grouping spans that share a trace ID and arranging them by their parent-child relationships.
That difference matters in production debugging. A trace helps you follow one request through the system from start to finish. Spans let you query operations as a dataset, so you can group, filter, and compare thousands or millions of them to understand latency, errors, and outliers.
This article explains what traces and spans are in OpenTelemetry’s data model, how they relate to each other at the protocol level, and when each mental model helps you debug faster.
If you're already comfortable with the basics and want the deep dive on span anatomy, our companion piece on OpenTelemetry spans covers every field in detail. For the SDK pipeline and instrumentation architecture, see how OpenTelemetry tracing works.
Traces vs spans at a glance
| Dimension | Span | Trace |
|---|---|---|
| What it is | A single timed operation | The set of spans sharing a traceId |
| Exists in OTLP | Yes, as a first-class data type | No; reconstructed from spans by the backend |
| Identifier | spanId (8 bytes) | traceId (16 bytes) |
| Scope | One operation in one service | One request across all services |
| Duration | Wall clock time of the span's start and end time | Wall clock time of the root span |
| Best view for | Aggregate queries, RED metrics, attribute-based filtering | Debugging a single request |
| Contains | Attributes, events, links, status | All spans connected by parentSpanId references |
| Sampling unit | Individual spans are not independently sampled | The entire trace is the sampling unit |
Spans are emitted, traces are reconstructed
If you look at the
OTLP protobuf definitions,
you'll find TracesData, ResourceSpans, ScopeSpans, and Span, but no
Trace message type.
TracesData might look like the candidate, but it's actually just the transport
envelope for an export batch. A single TracesData payload can contain spans
belonging to dozens of different traces, grouped by resource and instrumentation
scope rather than by traceId.
Your application produces spans and each one carries a traceId (a 16-byte
identifier shared across an entire request) and a parentSpanId (pointing to
the span ID that initiated it). Your observability backend then collects these
spans, groups them by traceId, and uses the parentSpanId references to
assemble the tree structure you see in a waterfall view.
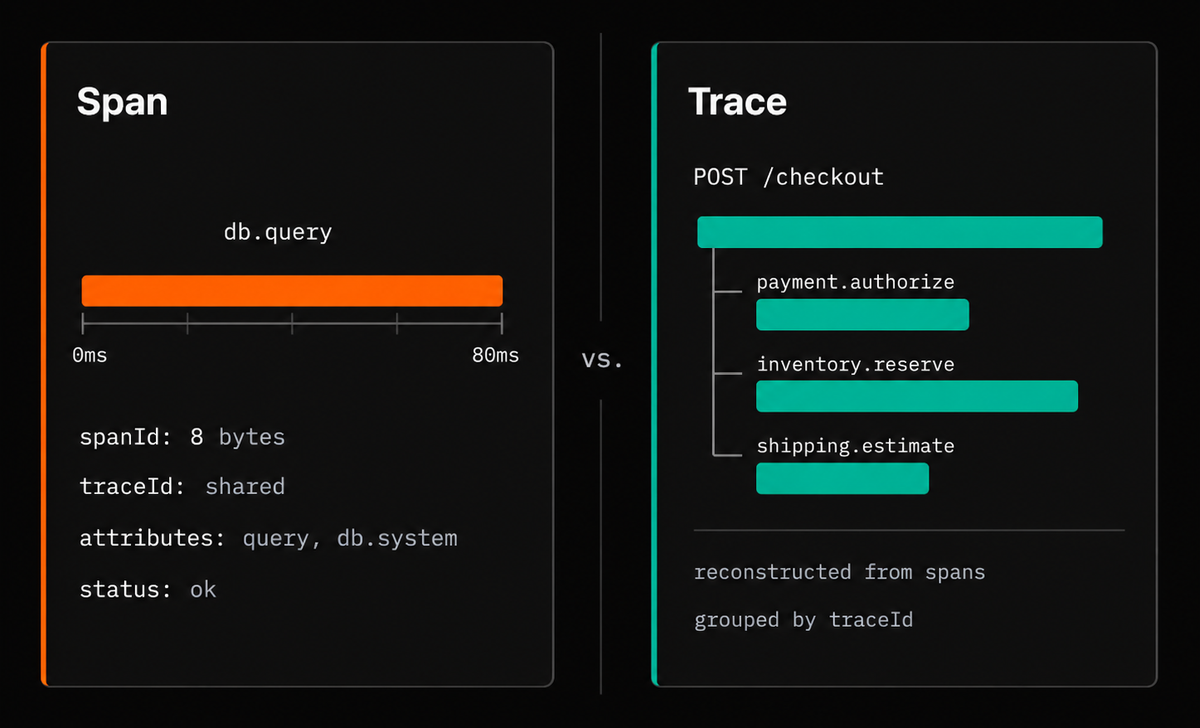
To make this concrete, here's a simplified version of what your application actually exports over OTLP:
123456789101112131415161718192021222324252627{"resourceSpans": [{"resource": {"attributes": [{ "key": "service.name", "value": { "stringValue": "checkout" } }]},"scopeSpans": [{"spans": [{"traceId": "a1b2c3d4e5f6a1b2c3d4e5f6a1b2c3d4","spanId": "1a2b3c4d5e6f7a8b","parentSpanId": "","name": "POST /checkout","kind": 2,"startTimeUnixNano": "1719900000000000000","endTimeUnixNano": "1719900000300000000","status": { "code": 1 }}]}]}]}
The traceId field on each span is the only thing tying related spans together
into a trace, and that has real consequences for how tracing behaves in
production.
When
context propagation
breaks between two services, whether because of a missing traceparent header,
an uninstrumented proxy, or a framework that strips unknown headers, the
downstream service starts a new traceId. Its spans form a separate, orphaned
trace, and the original request's trace now has a gap where that service should
have been.
Similarly, if a span gets dropped through sampling, a crash before the span exports, or a network failure to the collector, any child spans that reference it as their parent will appear orphaned.
It's also worth knowing that a trace can legitimately contain a single span. If a request is handled entirely within one instrumented operation and makes no downstream calls, that one span is the whole trace.
Since traces aren't transmitted as a unit, sampling decisions need to account for all of a trace's spans. With head-based sampling, this decision happens at the root span and propagates through context headers so every downstream service respects it.
Tail-based sampling defers the decision to the OpenTelemetry Collector, which buffers spans and evaluates the complete trace before deciding whether to keep or drop it. Either way, if you sample spans independently, you'll end up with fragments of traces that are generally useless for debugging.
What a span actually contains
Beyond the trace identifiers covered above (traceId, spanId,
parentSpanId), a span carries a name, a start and end timestamp, a status,
attributes, optional span events (timestamped annotations within the span's
lifetime) and span links (references to other spans that don't fit the
parent-child model).
For the full breakdown of every span field and how to use them, see our comprehensive guide on OpenTelemetry spans.
What a trace actually is
A trace is the set of spans that represent one logical operation as it moves through a system. In most web applications, that operation is an incoming request, but it could also be a message being processed, a scheduled job, or any other unit of work you want to follow across service boundaries.
The parent-child relationships between spans form a tree with one root span at the top, and child spans for downstream calls, database queries, cache lookups, queue publishes, and other work performed along the way.
The OpenTelemetry specification describes a trace as a directed acyclic graph of spans, where the edges are parent-child relationships. In practice, the main structure is always hierarchical.
Span links can add non-hierarchical references to other spans, sometimes spans in other traces, but links don't alter the parent-child topology and shouldn't be treated as a substitute for context propagation.
How your backend reassembles the trace
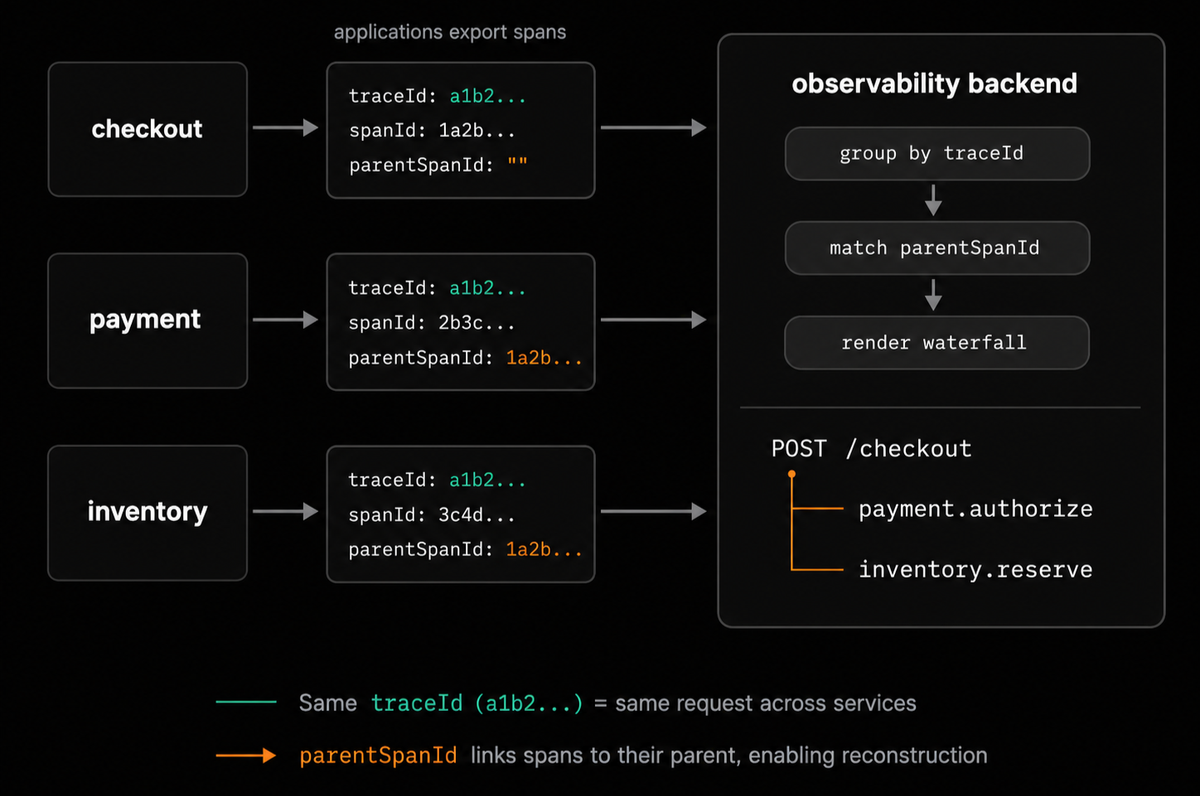
Since spans arrive independently (often out of order, from different services, written in different languages, and sometimes minutes apart), your backend has to do some work to turn them into a coherent trace.
The process is roughly: collect spans, group them by traceId, then for each
group, build the tree by matching each span's parentSpanId to another span's
spanId.
If there are multiple root spans with the same traceId (which can happen due
to propagation breaks), the backend typically shows them as disconnected
subtrees within the same trace view.
Debugging with traces and spans
The distinction between traces and spans has practical consequences for how you debug production issues. When something goes wrong, you're typically in one of two modes, and picking the right one saves you time.
Following one request (trace-level thinking)
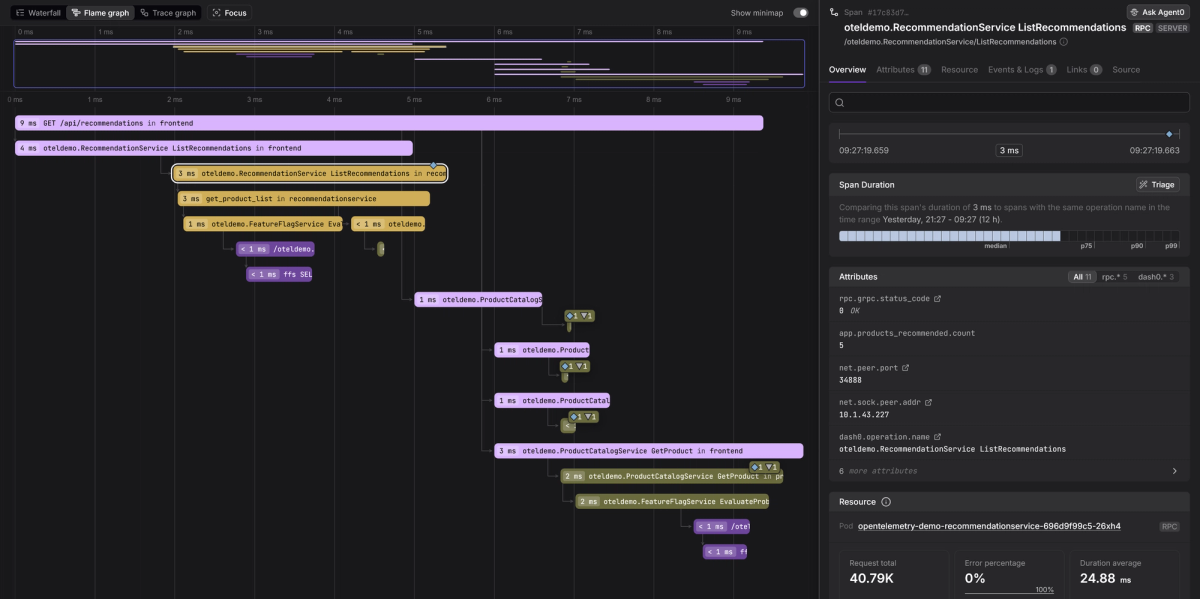
When you have a trace ID, whether from a customer ticket, an alert, or a log line, you can pull up that trace in a waterfall view and see every operation the request touched, laid out on a timeline with parent-child nesting.
You're reading one request's path through the system from start to finish to see which services handled it, how long each step took, where errors surfaced, and where time disappeared into slow downstream calls or uninstrumented gaps.
That's trace-level thinking. The question you're answering is always "what happened to this request?" and the trace gives you the full picture in one place.
Querying many operations (span-level thinking)
If the p99 latency on your payment-service jumped 40% in the last hour,
there's no single request to investigate because the problem is spread across
thousands of requests.
You could open one trace and find a slow request, but you can't tell from a sample of one whether that slowdown is representative or an outlier. So instead of reading one trace, you must query the spans as a dataset.
For example, you might filter to server spans, group them by route, and compare p95 or p99 latency across routes. Or you might look at spans with error status and group them by attributes to see what the failing operations have in common.
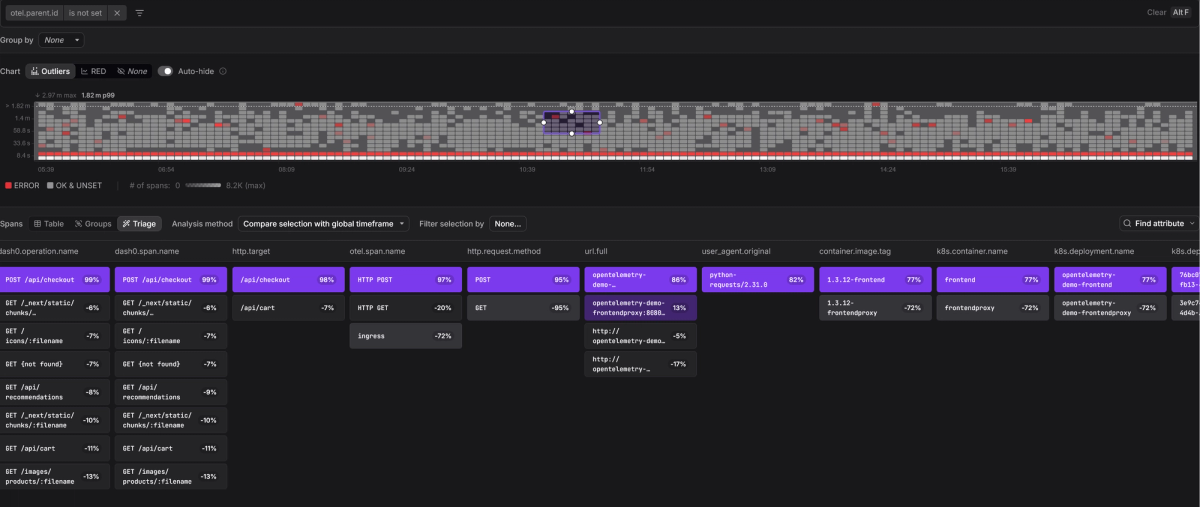
Some observability tools, like Dash0's Triage, automate that comparison. You select a group of anomalous spans, such as errors or high-latency outliers, and compare it against a baseline of normal spans. So instead of manually writing queries and eyeballing distributions, you get the distinguishing attributes in seconds.
In practice, most investigations move between trace-level and span-level views. The same identifiers also make traces and spans useful outside tracing itself.
OpenTelemetry exemplars can attach a traceId and spanId to a metric data
point, so a latency spike on a dashboard can lead you directly to a trace that
contributed to it.
Trace-log correlation uses the same idea for logs. Logs emitted during a span's lifetime can include the span's traceId and spanId, which lets you move from a span in a waterfall view to the log lines produced during that operation (and vice versa).
Metrics, traces, and logs remain separate telemetry signals, but shared trace and span identifiers give you a seamless way to pivot between them during an investigation.
Why request duration isn't the sum of span durations
When you look at a trace waterfall, the end-to-end request time is not the sum of every span shown in the trace. Adding span durations together double-counts work, especially when operations overlap.
Suppose your checkout service makes parallel calls to a payment gateway, an inventory service, and a shipping estimator. Those child spans run concurrently. The parent checkout span covers the elapsed wall-clock time of the operation from its start timestamp to its end timestamp, not the sum of the child spans beneath it.
Two duration concepts matter when you're reading waterfalls:
-
Inclusive duration, sometimes called total duration, is the span's elapsed wall-clock time. A checkout span that starts at 0ms and ends at 300ms has a 300ms inclusive duration, regardless of how many child spans ran during that interval.
-
Exclusive duration, sometimes called self-time, is the portion of a span not covered by its child spans. If that 300ms checkout span has child spans covering 275ms of its timeline, the remaining 25ms is self-time. That time often represents work that is not broken out into more specific spans, such as serialization, request parsing, framework overhead, business logic, or other uninstrumented code.
The critical path is the longest chain of dependent operations that determines end-to-end latency. If three downstream calls run in parallel and call B finishes last, B is on the critical path. Optimizing A or C will not reduce the request's elapsed time unless one of them becomes the slowest dependency afterward.
The waterfall layout makes all of this readable at a glance since overlap, gaps, self-time, and the critical path are all visible in the shape of the chart.
Where span links add value
Parent-child relationships work well when one operation synchronously and hierarchically causes another. A server span handling a request creates a child span for a database query, and the timing, causality, and containment all line up cleanly.
But not every relationship fits that model. Common examples include:
- A consumer processing a batch of messages, where each message originated from a different trace.
- A scatter-gather operation that combines results from multiple upstream operations, none of which is the single parent of the aggregate work.
- A background job triggered by a request but executed later, with its own lifecycle and trace.
A span link is the
right tool in these situations. Links carry the referenced span's traceId and
spanId along with optional attributes for additional context. They're
non-hierarchical, can cross trace boundaries, reference multiple spans, and
don't imply timing containment
Don't use links as a workaround when what you actually need is proper context propagation. If two services participate in the same synchronous request, fix the propagation so parent-child works. Links are only for genuinely non-hierarchical relationships.
Final thoughts
The traces vs spans question sounds like a terminology exercise, but it really comes down to how you use your telemetry data. Traces give you the story of one request, while spans give you a population of operations to measure and query against. Both views come from the same underlying data, since there's only one signal (spans), and the trace is what your backend reconstructs from it.
Dash0 is built on OpenTelemetry from the ground up, so traces, spans, and their relationships are first-class objects in the platform. The waterfall view, span analytics, and Triage (which identifies which span attributes best explain a set of errors or latency spikes) map directly to the trace-level and span-level debugging modes described in this article.
If you'd like to see how these concepts work in an OpenTelemetry-native backend, start a free Dash0 trial today.