Last updated: July 7, 2026
What is Log Management?
It's 2am. Your checkout service is returning 5xx errors. You open your logging tool and find 800 nearly identical PaymentTimeout lines, over and over, no trace context, no service identifiers, three services involved and no clear way to tell which one is actually broken. You scroll. You grep. You ask colleagues in Slack if they touched anything. Thirty minutes later you're still not sure where to look.
That scenario is a log management problem, not a code problem. In this article we'll walk through the principles behind effective modern log management and how to put them into practice.
In monolithic or single-server deployments, log management mostly meant gathering log files from a few servers and making them searchable in one place. That definition is too narrow for modern distributed systems. Today, effective log management also means reducing noise, standardizing structure, preserving context, and keeping the system affordable as log volume grows across containers, services, cloud platforms, and serverless infrastructure.
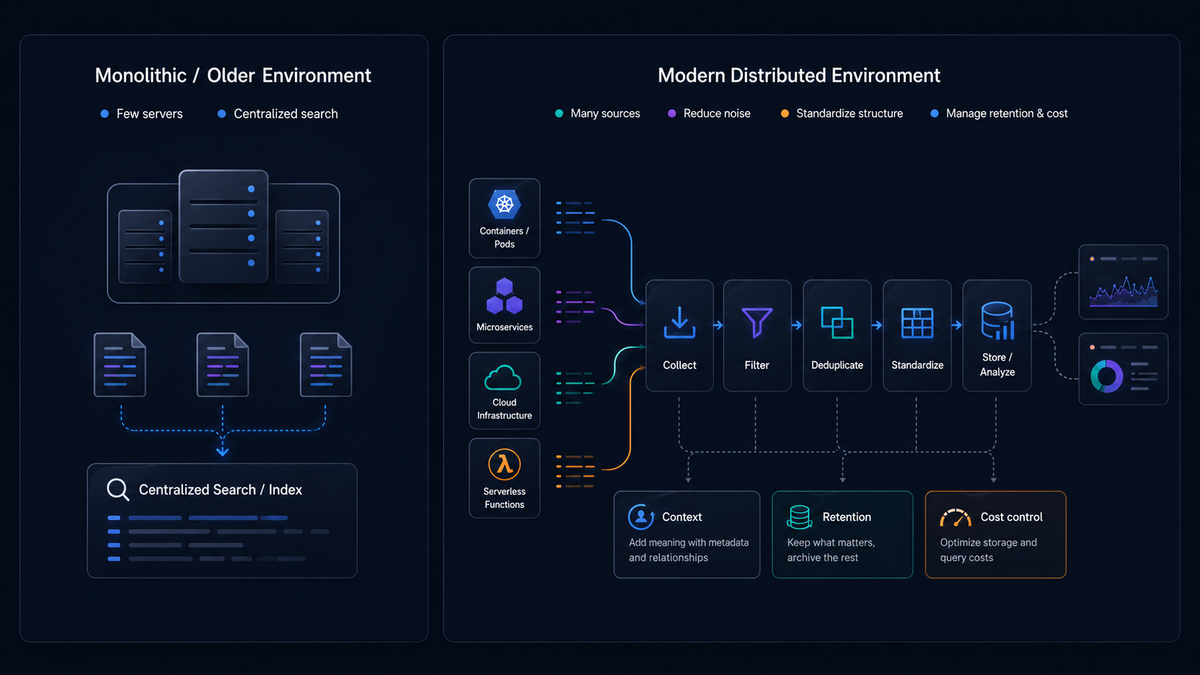
At a minimum, effective log management includes collecting logs from different sources, sending them to a central system, organizing and storing them, and searching and analyzing them when something goes wrong.
In modern environments, it also extends to filtering noisy or low-value logs, deduplicating repeated events, standardizing fields and formats, and managing retention and pricing.
Why log management matters
Logs are still the most widely used record of what happened inside a system. They capture request failures, retries, startup problems, authentication events, background job activity, deployment side effects, and infrastructure issues.
When something breaks, logs are often the first place engineers look because they contain the event-level detail that tells you what happened. The value of log management goes beyond centralization: it's about making those records reliable enough to support debugging, operations, security work, and incident response while you're under pressure and the clock is running.
Types of logs
Most teams aren't managing a single kind of log. They're managing several at once.
Application logs describe what the application is doing: handling requests, validating data, processing business events, and reporting warnings or exceptions.
System and host logs come from the operating system and runtime environment. They help explain lower-level failures like process crashes, disk pressure, or network issues.
Infrastructure and platform logs come from components like proxies, orchestrators, load balancers, databases, and managed cloud services.
Security and audit logs record authentication, authorization, administrative changes, and policy activity.
In distributed systems these categories constantly overlap, so log management needs to work across layers, connecting signals in context rather than stitching together isolated logs after the fact.
Log management starts at the source
You can have the best log management process in the world, but if your logs are bad it won't matter. OpenTelemetry is an observability framework and toolkit that gives you the APIs, SDKs, and Collector you need for accurate, scalable logging.
Adopting OpenTelemetry may take some adjustment in your tech stack, but it doesn't mean rebuilding everything. In many cases, applications already emit logs in JSON format, which is ideal. But even when logs are JSON there's a distinction that matters: structured versus unstructured output.
Unstructured logs are plain text messages that are easy for humans to read but difficult for tools to reliably parse. Structured logs are emitted as well-defined fields with embedded context that systems can process directly.
That difference matters more as volume grows. Plain text may be familiar, but it's much harder to query, enrich, group, and standardize across services. Structured output is what makes logs manageable in high-volume distributed environments.
Below is a simple comparison.
Unstructured:
12[2025-04-13 10:32:01] ERROR Failed to process paymentfor user 8821 — timeout after 3000ms
Structured:
123456789101112{"timestamp": "2025-04-13T10:32:01Z","level": "ERROR","message": "Failed to process payment","user": {"id": 8821},"error": {"type": "PaymentTimeout","timeout_ms": 3000}}
At a glance, both logs contain similar information. The difference is how that information can be used.
In the structured example, each piece of information lives in a dedicated field. You can filter, group, and analyze logs using those fields directly, without relying on fragile text parsing.
To find all payment timeout errors for a specific user, you'd query:
1234service.name = "payment-service"AND error.type = "PaymentTimeout"AND user.id = 8821AND timestamp >= now() - 1h
With unstructured logs, the same query would require a regex against the message body, and would break the moment someone changed the wording. With structured fields, the query is stable and composable.
The OpenTelemetry logs data model
Structure defines how logs are formatted, but consistency is what makes them usable across systems. To get consistency, logs need a shared data model. OpenTelemetry provides one: a vendor-neutral framework for collecting, processing, and transmitting telemetry data.
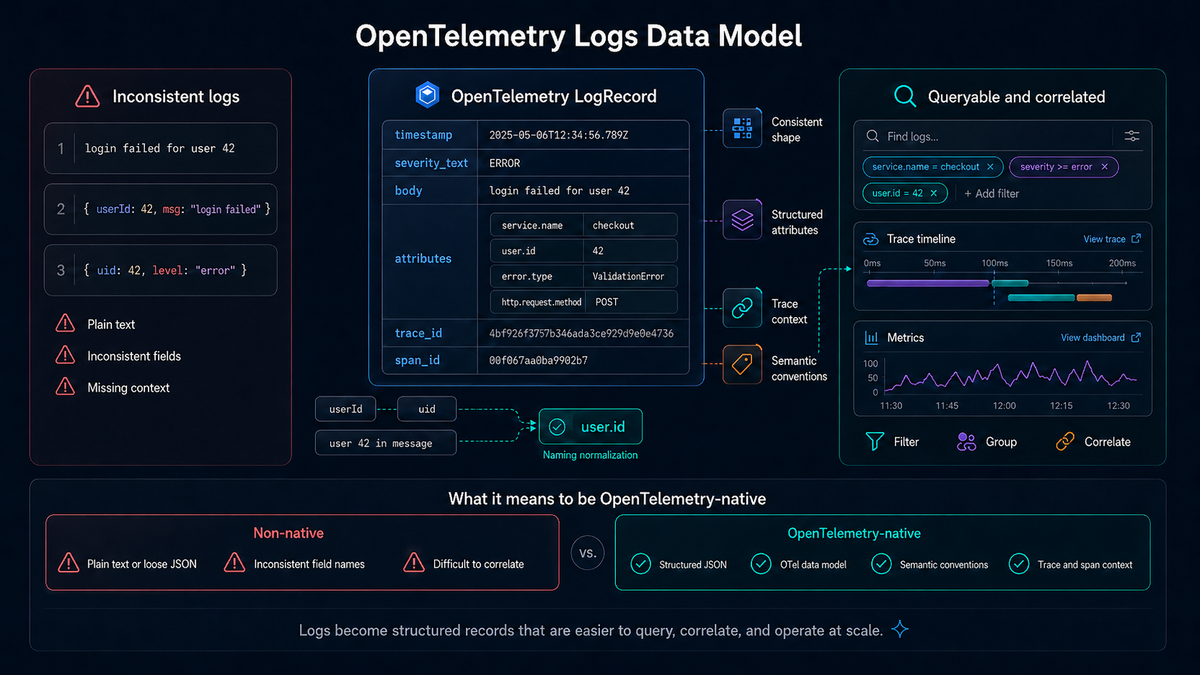
OpenTelemetry defines the logs data model, which standardizes how logs are represented. A LogRecord (an individual entry within this model) includes a timestamp, a severity level, a message body, structured attributes, and trace context, including trace and span identifiers that link the log to the request that produced it.
Fields like trace_id and span_id let logs be connected across services. Logs aren't just strings anymore. They're structured records that can be queried, correlated, and linked to traces and metrics.
Beyond the structure of individual logs, OpenTelemetry also defines semantic conventions: standardized field names and meanings that ensure logs from different services describe the same concepts the same way.
Instead of one service using userId, another using uid, and a third embedding the value inside a message, semantic conventions define a consistent field like user.id. The same applies to attributes like service.name, http.request.method (formerly http.method, now deprecated), or error.type.
Those fields can then be used directly for filtering, grouping, and correlation without any guesswork.
What it means to be OpenTelemetry-native
Adopting OpenTelemetry isn't just about sending logs through a Collector. It requires producing logs that align with the data model, semantic conventions, and context requirements from the start.
In a non-native setup, logs might still be emitted as plain text or loosely structured JSON. They might be missing consistent field naming, lacking trace context, or difficult to correlate across systems.
In an OpenTelemetry-native approach, logs are structured as JSON, aligned with the logs data model, using semantic conventions for field names (service.name, user.id, error.type), and enriched with trace and span context at the time they're created.
This reduces the need for downstream fixes. When logs already follow a consistent structure and naming scheme, collectors and backends don't need to spend as much effort parsing, transforming, or normalizing them later.
Being OpenTelemetry-native isn't binary, and nobody expects perfection on day one. It means designing toward a system where logs are emitted consistently and with enough context to be correlated, queried, and operated at scale.
Log ingestion and standardization in the Collector
Once logs leave your applications, the next step is getting them into a system where they can be processed, standardized, and analyzed.
Logs originate from many places: written to files, printed to stdout, emitted by application libraries, or produced by infrastructure services. In containerized environments, logs are often written to stdout and automatically captured by the platform.
The OpenTelemetry Collector handles this well. It provides a unified way to ingest logs from multiple sources using receivers.
Depending on how logs are produced, different receivers apply. The filelog receiver reads logs from files. The OTLP receiver accepts logs sent over HTTP or gRPC from instrumented applications. Other receivers can ingest logs from system services or streaming platforms.
If you control the application, the ideal approach is to emit structured, single-line JSON logs directly.
But real systems are messier. Some services emit structured JSON, others plain text, and others something in between. The Collector's second role covers this: standardization and enrichment.
Unlike application-level logging (which defines how logs are created), the Collector operates on logs after they've been produced. It can normalize and reshape incoming data so downstream systems receive something more consistent.
The Collector can parse unstructured or semi-structured logs into structured fields (when patterns are predictable), rename inconsistent fields (userId to user.id), map attributes to OpenTelemetry semantic conventions, add missing metadata like service.name, environment, or region, and enrich logs with trace context if that context exists elsewhere in the pipeline.
Even if applications aren't perfectly aligned, whether they're missing structure or using inconsistent field names, the Collector can bring logs closer to a unified format.
At the source, you emit structured JSON logs with intentional context. In the Collector, you normalize, enrich, and align logs across services. Think of the Collector as a force multiplier, not a replacement for good logging practices. It helps enforce consistency at scale, but the quality and usefulness of your logs are still determined upstream.
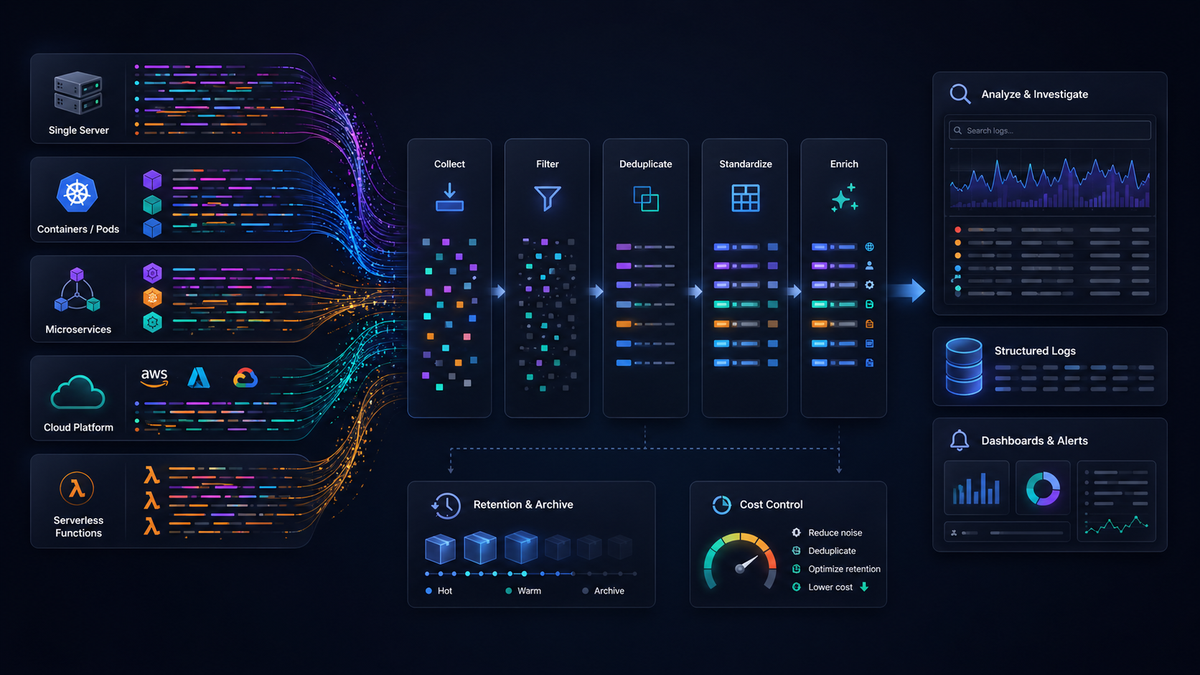
The telemetry pipeline
With the Collector's role established, here's how it fits into the full telemetry pipeline. After ingestion, logs move through a processing pipeline before reaching storage and analysis. Buffering, parsing, enrichment, filtering, routing, and export all happen at this stage.
The pipeline is typically implemented with a collector as the central processing layer. Instead of every service sending raw records directly to a backend in its own format, a collector receives them, applies logic, and forwards them onward.
The OpenTelemetry Collector is built around receivers, processors, and exporters. It gives you a control point for collecting, enriching, redacting, dropping, batching, and routing telemetry before it reaches storage.
A production-ready pipeline includes a few components beyond receivers and exporters. Here's a realistic starting point:
123456789101112131415161718192021222324receivers:otlp:protocols:grpc:endpoint: 0.0.0.0:4317processors:memory_limiter:check_interval: 1slimit_mib: 512batch:send_batch_size: 1000timeout: 5sexporters:otlp:endpoint: https://your-backend:4317service:pipelines:logs:receivers: [otlp]processors: [memory_limiter, batch]exporters: [otlp]
Even in this basic setup, the separation of concerns is clear: logs are received, stabilized by the memory limiter, batched for efficient transport, and forwarded to storage, without each service needing to manage that complexity itself. The memory_limiter processor should always appear first in the processor chain because it protects the Collector from being overwhelmed by sudden volume spikes. This is also where the earlier concepts (structured logging, semantic conventions, context) get enforced consistently at scale.
Reducing signal noise and lowering costs
It seems logical to assume that more logs means better insight. Uncontrolled volume produces the opposite: more noise, higher cost, and slower investigation.
Log levels as the first line of control
Log levels define the importance of events, and they're one of the primary ways systems control how much signal is produced. They determine what stands out, what gets ignored, and how easy it is to work with logs at scale.
Log levels should be used intentionally. Each level represents a different type of event, and in many systems these levels map to numeric ranges that determine how logs are filtered and processed:
- 1-4 TRACE: highly detailed, step-by-step diagnostics
- 5-8 DEBUG: diagnostic information useful during development or troubleshooting
- 9-12 INFO: normal, meaningful application events and state changes
- 13-16 WARN: unexpected or undesirable conditions that don't stop execution
- 17-20 ERROR: failures that prevent a specific operation from completing
- 21-24 FATAL: failures that may cause the system or service to stop
Each level actually contains four sub-variants (such as FATAL through FATAL4), allowing for finer-grained severity within the same category.
These numeric ranges let systems apply thresholds (for example, "log everything at INFO and above"), making it possible to control how much data is emitted or collected without changing the meaning of individual log entries.
In modern systems, log levels don't have to be static. Instead of fixing verbosity at deploy time, they can be adjusted dynamically at runtime. You can temporarily increase detail for a specific service, request, or user when investigating an issue, then return to normal levels once the problem is understood.
This keeps baseline log volume low while still making detailed context available during incidents, without requiring redeployments. If everything is logged at the same level, the system loses its ability to distinguish signal from noise.
Filtering low-value logs
Not every log message is equally useful. High-frequency entries like debug statements, trace messages, health checks, and routine success confirmations add noise without helping engineers understand failures or investigate incidents.
When these low-value logs are forwarded unchanged, they increase ingestion and storage costs, consume indexing resources, slow down searches, and bury the records that actually matter: warnings, errors, failed requests, and dependency issues.
Filtering should happen as early as possible in the telemetry pipeline. The OpenTelemetry Collector can evaluate logs before export and drop records that match predefined conditions, so you reduce noise at the processing layer rather than paying to ship and store everything.
The following example uses the Collector's filter processor to exclude low-value log records:
123456processors:filter:logs:log_record:- severity_number <= SEVERITY_NUMBER_DEBUG4- 'IsMatch(body, "(?i)(debug|trace)")'
This configuration defines filtering rules at the log_record level. Each rule is evaluated against incoming logs, and matching records are dropped.
The first rule:
1severity_number <= SEVERITY_NUMBER_DEBUG4
filters out logs whose severity is DEBUG or lower, removing records at the most verbose end of the severity scale. These logs are often useful during active development or deep troubleshooting, but in production they tend to generate large amounts of noise with limited long-term value.
The second rule:
1'IsMatch(body, "(?i)(debug|trace)")'
filters logs based on their message content. It uses a regular expression to match log bodies containing the words "debug" or "trace." The (?i) flag makes the match case insensitive, so DEBUG, Debug, and trace are all caught. This helps catch logs that don't have a proper severity level assigned but still clearly contain low-value diagnostic output in the message text.
Together, these two rules provide layered filtering. The first removes logs based on structured severity metadata; the second catches noisy messages based on content. This matters because not all applications emit logs consistently. Some services set severity fields correctly, while others place diagnostic clues only in the body text. Using both approaches makes filtering more reliable across mixed workloads.
Applying this kind of filtering in the Collector can significantly reduce unnecessary log volume and improve the usefulness of the data you retain. The result is a logging pipeline that costs less, is easier to search, and stays focused on operationally meaningful events.
You can learn more about filters in the Dash0 OpenTelemetry Filter Processor Guide.
Log deduplication
A single failure rarely produces a single log entry. Retries, cascading errors, and repeated emissions from multiple components can generate dozens or thousands of nearly identical messages. Each entry reflects the same underlying issue, but the volume makes it harder to see patterns and drives up ingestion, storage, and query costs.
Log deduplication groups identical or near-identical entries over a defined time window and represents them as a single event with a count. You preserve the signal that an issue is happening repeatedly without flooding downstream systems with redundant data.
Deduplication depends on defining what "identical" means, typically based on a subset of fields like the message body, error type, or other stable attributes. Choosing the right fields matters: too strict, and you miss duplicates; too loose, and unrelated events get grouped together. Time windows also matter. Short intervals preserve more granularity, while longer ones provide stronger compression but may obscure short-lived spikes.
Where deduplication happens also matters. When applied in the processing pipeline (in a collector, for example), it reduces volume before logs reach storage or indexing. This makes it effective for cost control, since fewer records need to be stored and queried.
With the OpenTelemetry Collector, duplicate logs are handled by the log deduplication processor. Below is an example configuration that deduplicates connection errors while preserving audit logs:
1234567processors:logdedup:interval: 1slog_count_attribute: dedup_countexclude_fields:- attributes.request_id- attributes.timestamp
The processor groups identical logs over a defined interval and emits a single record with a count, making patterns easier to spot without overwhelming the system.
Context is what makes logs useful
Logs without context are just data. A log line becomes far more valuable when it tells you where it came from and what it relates to. Fields like service.name, deployment.environment.name, and other resource attributes describe the system that produced the log. You can group logs by service, filter by environment, and understand exactly which part of your infrastructure an event belongs to.
Not all context belongs directly on the log itself, though. Some attributes describe the entity producing telemetry rather than the individual event. In OpenTelemetry, these are resource attributes. They define things like the service, host, environment, or cloud region that generated the log.
Keeping this information consistent across services matters. If one service reports checkout-service and another reports checkout, or if environments are labeled differently, grouping and filtering become unreliable fast.
The resource processor in the OpenTelemetry Collector handles this well.
It operates at the level of the service or infrastructure rather than individual log records. It lets you define, normalize, and enforce resource attributes across all telemetry flowing through the pipeline: ensuring service.name is consistent across deployments, adding environment metadata like deployment.environment=production, attaching infrastructure context like region or host, and overriding incorrectly set attributes.
Here's an example resource processor configuration that normalizes service identity and attaches environment metadata:
123456789101112processors:resource:attributes:- key: service.namevalue: checkout-serviceaction: upsert- key: deployment.environment.namevalue: productionaction: insert- key: cloud.regionvalue: us-east-1action: insert
The upsert action sets the attribute whether or not it already exists, which is useful for enforcing a canonical value. The insert action only sets the attribute if it isn't already present, which is safer for metadata that services may already provide correctly. A full reference of supported actions is available in the Dash0 OpenTelemetry Resource Processor Guide.
By handling this at the resource level, you avoid repeating the same metadata in every log while keeping identity consistent across the service.
Context also includes how a log relates to other events. Identifiers like trace_id and span_id let logs be connected across services, so instead of seeing isolated messages, you can follow a single request as it moves through different components.
Resource attributes tell you where something happened. Trace context tells you how it connects to other events. When both are present and consistent, logs become part of a larger system of signals that can be grouped, filtered, and explored together.
That's the shift: instead of asking "what does this log mean?", you can ask "what happened across the system?" and use logs, traces, and other signals to find the answer.
Exporting logs
Once logs have been collected, structured, and refined, the final step is exporting them to a system where they can be stored, queried, and analyzed. All the earlier decisions (what to log, how to structure it, how much to keep) have a direct impact here.
Exporting isn't simply about sending data somewhere. It's about deciding where different logs should go and in what form. The OpenTelemetry Collector supports multiple exporters simultaneously, so logs can be fanned out to different destinations in a single pipeline. Security logs might go to a SIEM, high-severity errors to a dedicated alerting backend, and everything else to long-term storage.
The Collector provides exporters for a wide range of destinations: OTLP-compatible backends, object storage, logging platforms, and more. Each exporter can be attached to a pipeline independently, giving teams control over what reaches each system without duplicating instrumentation.
Here's an example that routes logs to two backends simultaneously:
123456789101112exporters:otlp/primary:endpoint: https://primary-backend:4317otlp/siem:endpoint: https://siem-backend:4317service:pipelines:logs:receivers: [otlp]processors: [memory_limiter, batch]exporters: [otlp/primary, otlp/siem]
Both exporters receive the same processed log stream. Your service instrumentation stays unchanged; only the Collector config determines where data lands. This is particularly useful during backend migrations: you can send logs to two platforms in parallel, compare how each surfaces and queries your data, and switch over when you're ready without touching application code.
The earlier pipeline steps matter here too. Log levels reduce unnecessary data at the source. Filtering removes low-value events before they move downstream. Deduplication compresses repeated signals into a single record. By the time logs reach the export stage, they should already be a smaller, higher-quality stream routed to the right destination rather than broadcast everywhere by default.
When logs include trace_id and span_id, exporting them with that context intact preserves their relationship to traces and the broader view of system behavior, regardless of which backend they land in.
Exporting is where log management decisions become concrete. It's where data leaves your control and becomes part of a system you query, monitor, and pay for. Getting this step right means that what reaches your backend is better data, not just more of it.
The tools behind log management
So far we've talked about log management as a set of practices. In production those practices are carried out by tools, and it helps to see that log management is rarely a single product. It's a stack of technologies, each responsible for a different part of the path from source to storage.
You can group most of that stack into five categories.
Collection agents run close to your workloads and gather logs from files, stdout, system journals, or application libraries. The OpenTelemetry Collector in agent mode, Fluent Bit, and the various cloud logging agents all live here. Their job is to read logs reliably, add basic metadata, and forward them onward without losing data during restarts or spikes.
Pipelines and processors sit between collection and storage. This is where logs are filtered, parsed, enriched, deduplicated, and reshaped before they land anywhere. The Collector in gateway mode is a pipeline; so are hosted telemetry pipelines and stream processors. We'll come back to this layer, because it's the one most worth understanding on its own.
Storage backends hold the logs once they arrive. Some are general-purpose databases adapted for logs, others are purpose-built log stores, and others are columnar engines like ClickHouse or search indexes like OpenSearch. The tradeoffs here are about ingestion speed, query performance, retention cost, and how well the store handles high-cardinality data.
Search and analytics engines are what you actually interact with during an incident. They turn stored logs into queries, dashboards, saved views, and alerts. Sometimes this is the same technology as the storage backend; sometimes it's a separate layer on top.
Cloud-native log services bundle several of these categories into a managed offering. You send logs to an endpoint and the provider handles ingestion, storage, and search. That convenience trades away some control, which is a theme worth pulling apart on its own.
Seeing these categories separately makes it easier to reason about a system. A slow search is a storage or query problem, not a collection problem. Runaway cost usually traces back to the pipeline or the storage tier, not the agent. When you know which layer owns which concern, you spend less time guessing.
The pipeline as a first-class layer
Collection and storage get most of the attention, but the pipeline is where modern log management earns its keep. It's easy to treat it as plumbing that moves logs from A to B. Treating it as a distinct layer, with its own responsibilities, is what lets you control cost and quality instead of just accepting whatever your applications emit.
A pipeline transforms raw logs before they reach a destination. The main transformations are filtering out low-value records, routing different logs to different backends, enriching records with metadata they were missing, deduplicating repeated events, redacting sensitive fields, and converting between formats so downstream systems receive something consistent.
Each of those does real work. Filtering and deduplication cut volume, which directly lowers cost. Enrichment and format conversion raise signal quality, so the logs that do reach storage are easier to query and correlate. Redaction keeps personal or sensitive data out of systems that shouldn't hold it, which matters for both privacy and compliance. Routing sends each class of log to the right place instead of paying to store everything in your most expensive tier.
The OpenTelemetry Collector is a good mental model for this layer because its receiver, processor, and exporter design maps directly onto ingest, transform, and route. But the concept is broader than any one tool. Whenever logs pass through a stage that reshapes them before storage, that stage is a pipeline, and it's usually the highest-leverage place to improve your logging without touching application code.
Cloud-native deployment models
Log tools don't just differ in what they do; they differ in where they run. There are three common models, and each makes a different set of tradeoffs.
Self-hosted means you run the storage, search, and pipeline components in your own infrastructure. You get the most control over data residency, retention, and query behavior, and no per-gigabyte vendor bill. The cost shows up as operational overhead: you're now responsible for scaling, upgrades, storage capacity, and keeping the whole thing running at 2am. This fits teams with strict data-control requirements and the platform capacity to operate the stack.
Cloud-hosted means a provider runs those components for you. You send logs to an endpoint and query through their interface. Operational overhead drops sharply, scaling is someone else's problem, and you get features without maintaining them. In exchange you accept a usage-based bill that grows with volume, less control over where data lives, and some risk of lock-in if the provider uses proprietary formats. This fits teams that would rather spend engineering time on their product than on running a log store.
Hybrid splits the difference. A common pattern keeps collection and pipeline processing in your environment, then exports a filtered, enriched stream to a cloud backend. You keep control over what leaves your network and how much of it, while still offloading storage and search. This is where source-side filtering and deduplication pay off most, because everything you drop before export is volume you never pay a provider to ingest.
Portability is the thread running through all three. If your logs are structured with OpenTelemetry semantic conventions and shipped over OTLP, moving between models, or running more than one at once, is a config change rather than a re-instrumentation project. Proprietary agents and formats make that switch expensive, which is worth weighing before you commit.
Interoperability across the observability stack
Logs are one signal among several, and their value grows when they connect to the rest of your observability and operations tooling. Modern log tools are judged partly on how well they integrate, not just on what they do in isolation.
The most important integration is with metrics and traces. Shared identifiers make this work: when a log carries the same trace_id as a span, you can pivot from a log line to the full request trace and back, or line up a spike in an error-log count against a latency metric on the same timeline. A common data model, which OpenTelemetry provides across all three signals, is what makes that correlation reliable instead of best-effort.
Beyond the three core signals, logs feed security and operations tools. Security information and event management (SIEM) systems consume audit and security logs for threat detection and compliance. Alerting systems watch log-derived conditions and fire when error rates or specific patterns cross a threshold. Incident response and on-call tools take those alerts and route them to the right people with context attached.
The mechanics of these integrations are worth knowing. Exporters send logs to multiple destinations in parallel, so the same stream can reach a SIEM and a general backend at once. APIs let other tools query logs programmatically or push events in. Shared identifiers and common schemas let a log in one system be matched to a record in another. When these are in place, log management stops being a silo and becomes part of a connected system where an alert, a trace, a metric, and a log all describe the same event.
Emerging intelligence features
As log volume grows past what any person can read, tools have started to take on work that used to be manual. These capabilities won't replace an engineer's judgment, but they cut down the time spent finding the thing worth judging.
Automated anomaly detection watches log patterns over time and flags deviations from the baseline, so a new class of error or an unusual spike surfaces without someone writing a rule for it in advance. Smart grouping goes further than exact-match deduplication by clustering events that are similar rather than identical, collapsing hundreds of slightly different stack traces or error messages into a handful of patterns you can actually scan. Contextual enrichment automatically attaches related information to a log, such as the deployment that preceded it or the other signals from the same request, so you spend less time assembling context by hand.
The honest framing is that these features help most in large environments where manual inspection has stopped scaling. In a small system you can still read your logs. At scale you can't, and tooling that highlights the anomalous, groups the repetitive, and enriches the isolated is what keeps investigation tractable. Treat these as accelerators for a human investigator rather than a replacement for one.
Data formats and ingestion technologies
Underneath the tools sit the formats and mechanisms that actually move logs around. They're easy to overlook, but they shape how much normalization your pipeline has to do and how cleanly your logs interoperate.
On the format side, JSON is the common structured representation: widely supported, easy to parse into fields, and a good default when you control the application. Syslog is the long-standing standard for system and network device logs, so you'll meet it whenever you ingest from infrastructure you don't control. Plain text still shows up from older or simpler services, and it's the format that costs the most to work with downstream because it has to be parsed before it's useful. The OpenTelemetry logs data model sits above all of these as a shared target: whatever format a log arrives in, the goal is to land it in a consistent, semantically named structure.
On the ingestion side, the question is how logs get from where they're produced to where they're processed. File-based collection tails log files on disk. Streaming collectors receive logs over the network, often via OTLP over gRPC or HTTP, straight from instrumented applications. Message queues and streaming platforms like Apache Kafka buffer high-volume flows so a burst doesn't overwhelm downstream systems. Each mechanism suits a different source, and most real deployments use several at once.
The practical point is that ingestion and normalization are where format diversity gets resolved. A good pipeline accepts logs in whatever shape they arrive, parses and renames fields to a common convention, and transports them onward in a consistent structure. The more of that you can standardize at ingestion, the less every downstream system has to compensate for messy input.
Cost control built into the technology
At scale, log management is as much about controlling cost as capturing data. The instinct to keep everything runs straight into ingestion and storage bills that grow with volume. Modern log technologies build in several mechanisms to keep that growth in check, and most of them are choices you make in the pipeline rather than features you buy.
Filtering drops low-value records before they're stored, so you don't pay to ingest and index logs no one will read. Deduplication collapses repeated events into a single record with a count, turning an 800-line error storm into one entry that still tells you it happened 800 times. Tiered storage keeps recent, high-value logs in fast, queryable storage while moving older or lower-priority logs to cheaper cold storage, matching what you pay to how you actually query. Compression reduces the physical footprint of stored logs. Selective routing sends each class of log to a destination that fits its value, so security logs go to a SIEM, high-severity errors to an alerting backend, and everything else to inexpensive long-term storage.
None of these sacrifice observability when applied well. You keep the signal that matters and stop paying for the noise that doesn't. The recurring theme is that log management technology isn't only about storing more data. A large part of its job is reducing waste, and the tools that do this best make it easy to decide, per log, whether a record is worth keeping and where it should live.
What to look for in modern log management tooling
Pulling the technology threads together, a handful of capabilities separate tooling built for modern distributed systems from tooling that still assumes a handful of servers. This isn't a buying checklist so much as a way to understand what the categories above are really asking of a tool.
Fast search is table stakes. During an incident, the time between a query and an answer is time your system is degraded, and a store that's slow at high cardinality will cost you exactly when it matters most. Structured ingestion means the tool treats logs as fields rather than strings, so you can filter and group without fragile text parsing. Context preservation means trace and span identifiers and resource attributes survive the trip from source to storage, keeping logs correlatable with the rest of your telemetry. Flexible routing lets you send different logs to different destinations based on their value, which is what makes tiered cost control possible. Cloud readiness means the tool fits containerized, dynamic environments where services come and go rather than assuming static hosts. Multi-destination export means you can fan the same stream out to several backends, which keeps you from being locked into one platform and makes migrations a config change.
Read against the earlier categories, these capabilities line up cleanly: structured ingestion and context preservation are properties of your collection and pipeline layers, fast search belongs to storage and analytics, and flexible routing plus multi-destination export are what a good pipeline and exporter give you. A tool that covers all of them lets log management operate as a connected system rather than a collection of parts you stitch together yourself.
This is the model Dash0 is built around. As an OpenTelemetry-native observability platform, it takes logs in their native OTLP form alongside metrics and traces, preserves the trace context and semantic conventions that make correlation work, and filters telemetry at the source so you control volume and cost before data ever leaves your environment. Because everything is built on open standards, the same instrumentation keeps working if your stack changes.
Putting it together: correlation, context, and triage
When an incident starts, correlation is what separates a quick resolution from a long one. Every log emitted during a request carries the same trace_id, so you can follow a single request across every service it touches, moving from a log entry in one service to the full trace, and from there to any other log or span sharing that identifier.
Resource attributes do the complementary work. Fields like service.name, deployment.environment.name, and host.name let you filter down to a specific service, environment, or host without writing complex queries. A deduplicated log showing a connection error 800 times in a one-second window tells you far more, far faster, than 800 identical lines to scroll through.
What this looks like in practice
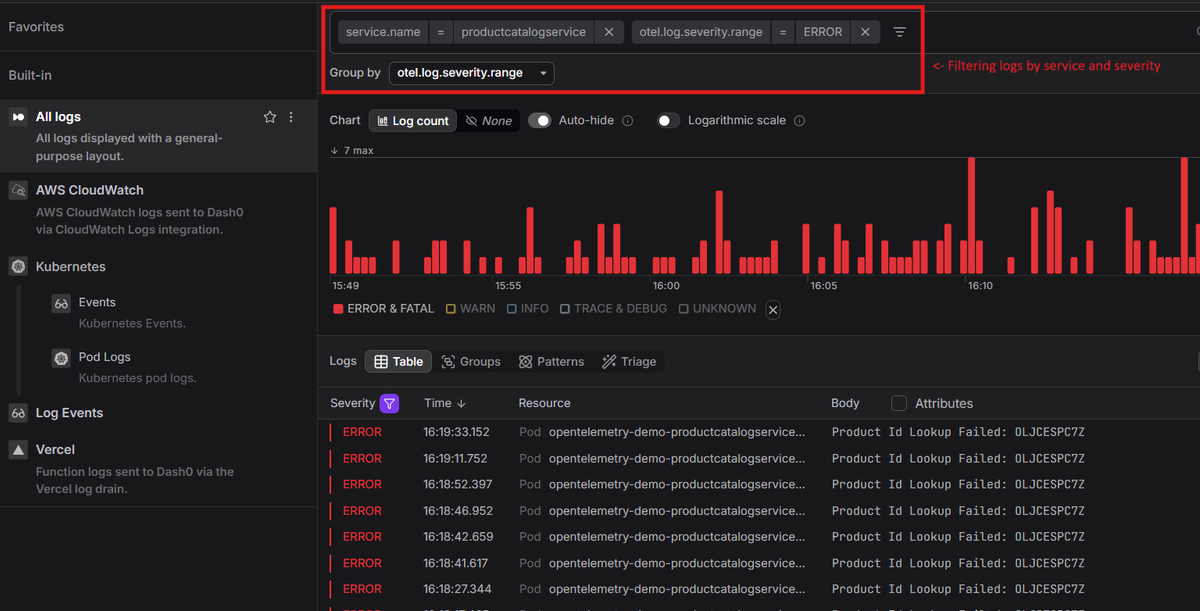
Say your Product Catalogue service starts returning 5xx errors at 2am. Here's how structured, contextualized logs speed up triage:
-
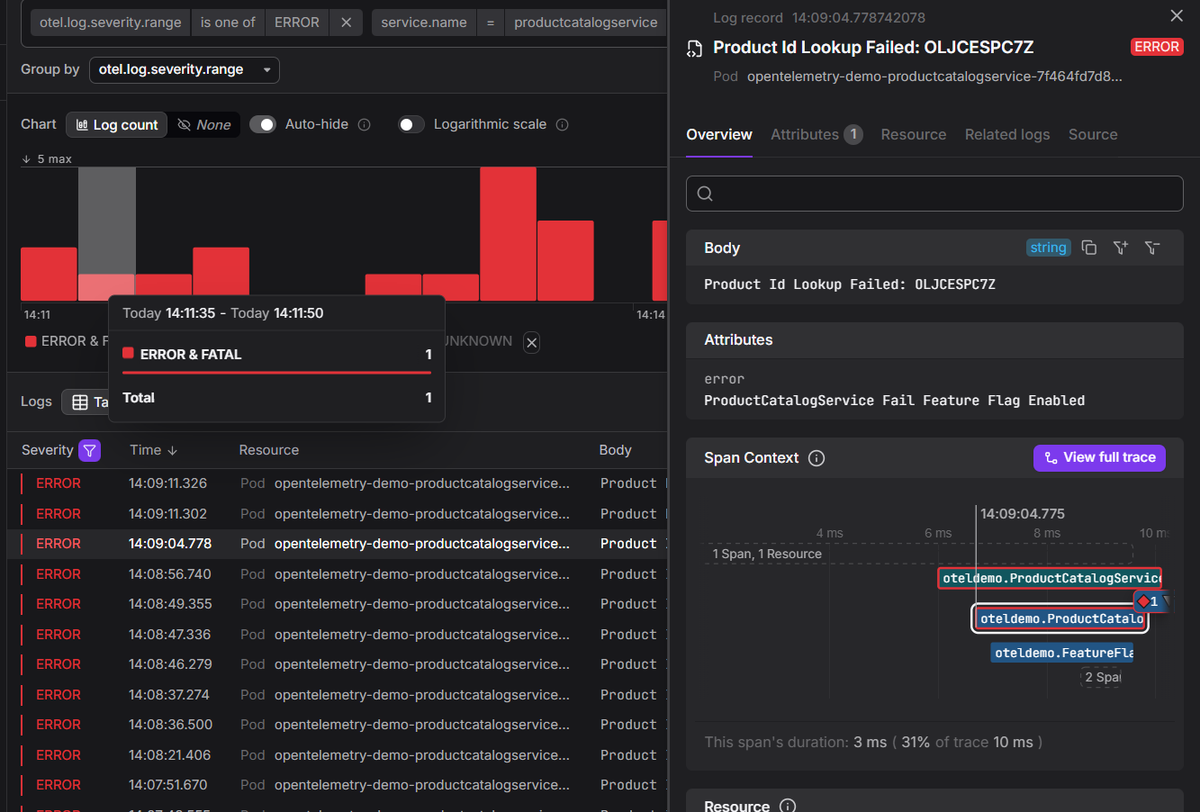
Filter by severity and service. Set
otel.log.severity.range = ERRORandservice.name = productcatalogservice. The log list immediately narrows to error-level entries from that service alone.
-
Open a log record. You can see the log body
Product Id Lookup Failed: OLJCESPC7Z, its attributesProductCatalogService Fail Feature Flag Enabled, and a Span Context section with a mini trace waterfall already visible.
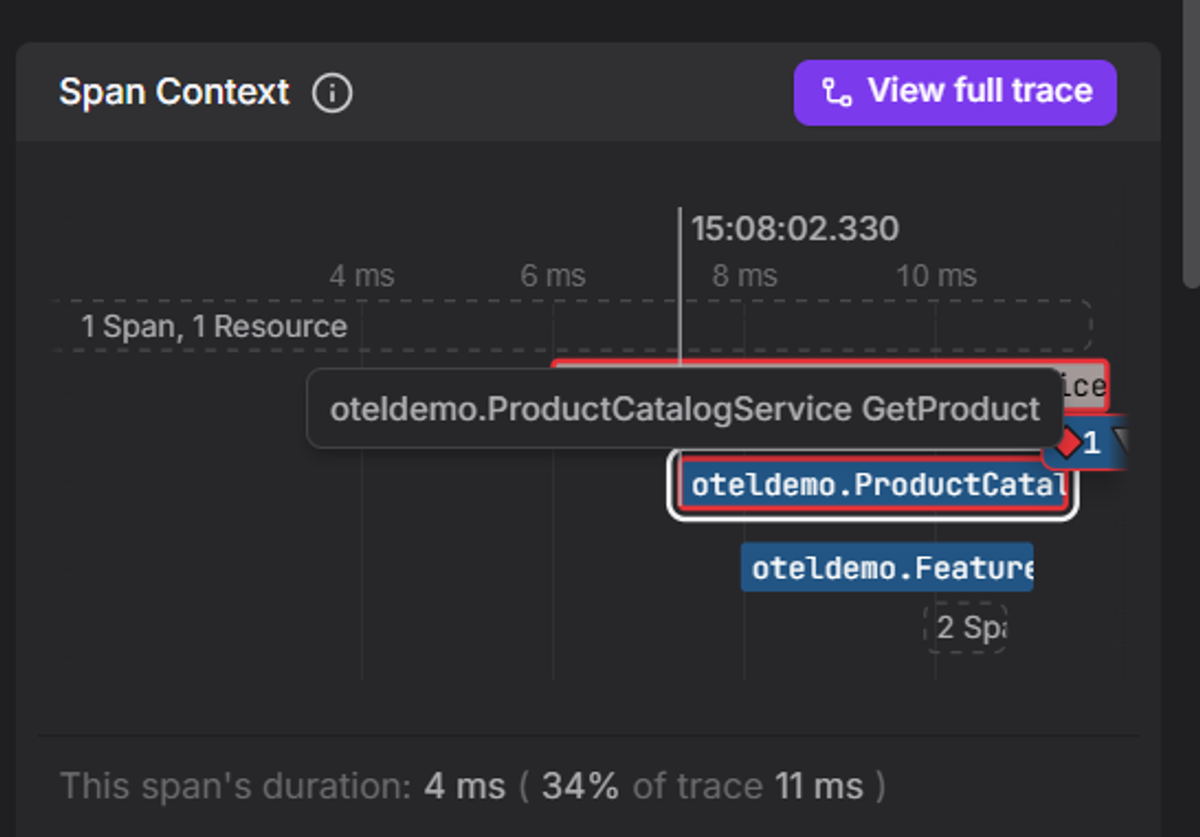
-
Read the span context. Because logs and traces share context identifiers, you can pull up every span from the same request. The span context shows the log was emitted during the
ProductCatalogService GetProductspan, which took 4ms and accounted for 34% of the total 11ms trace.
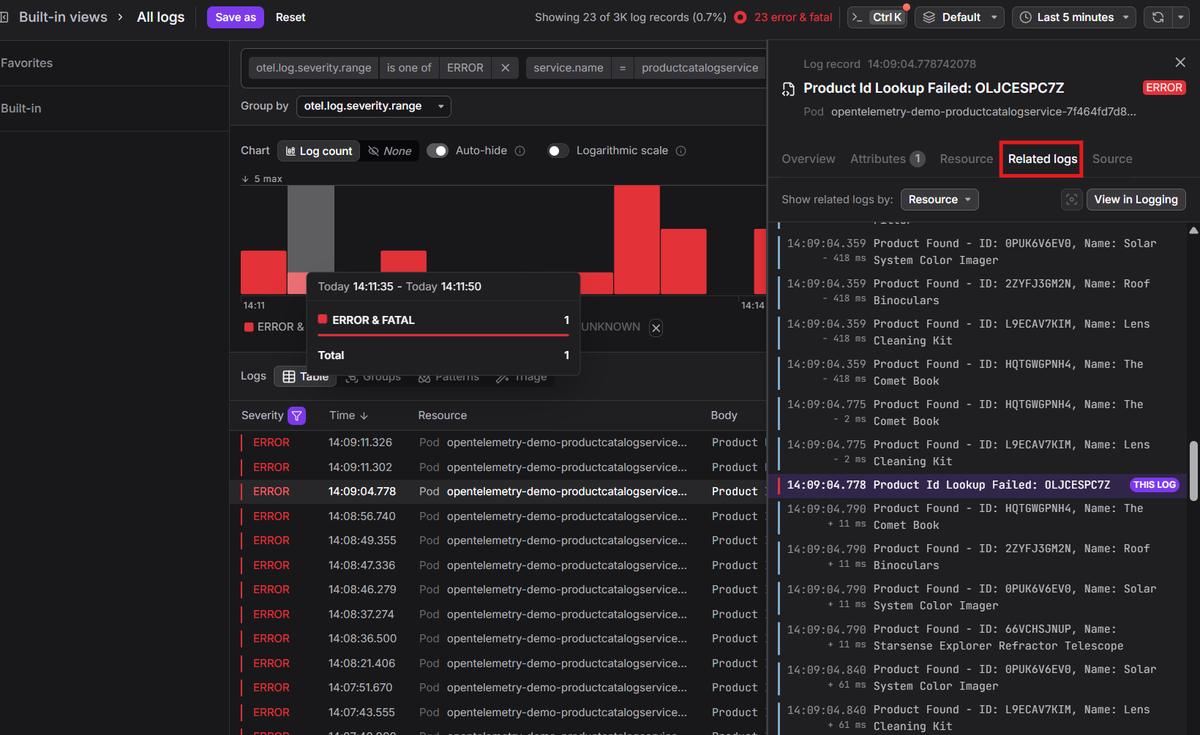
-
Check related logs. Because logs carry resource context, you can view every other log the same service emitted in that time window, threaded chronologically around the error. The active log is pinned at its exact timestamp, with older entries above and newer ones below, each annotated with a relative time offset.
In this case the picture is immediate. Milliseconds before the
Product Id Lookup Failederror, the service was successfully resolving product lookups for multiple items. The failure was isolated, not a cascade. That rules out a broader service outage and points to something specific about this particular product ID.
-
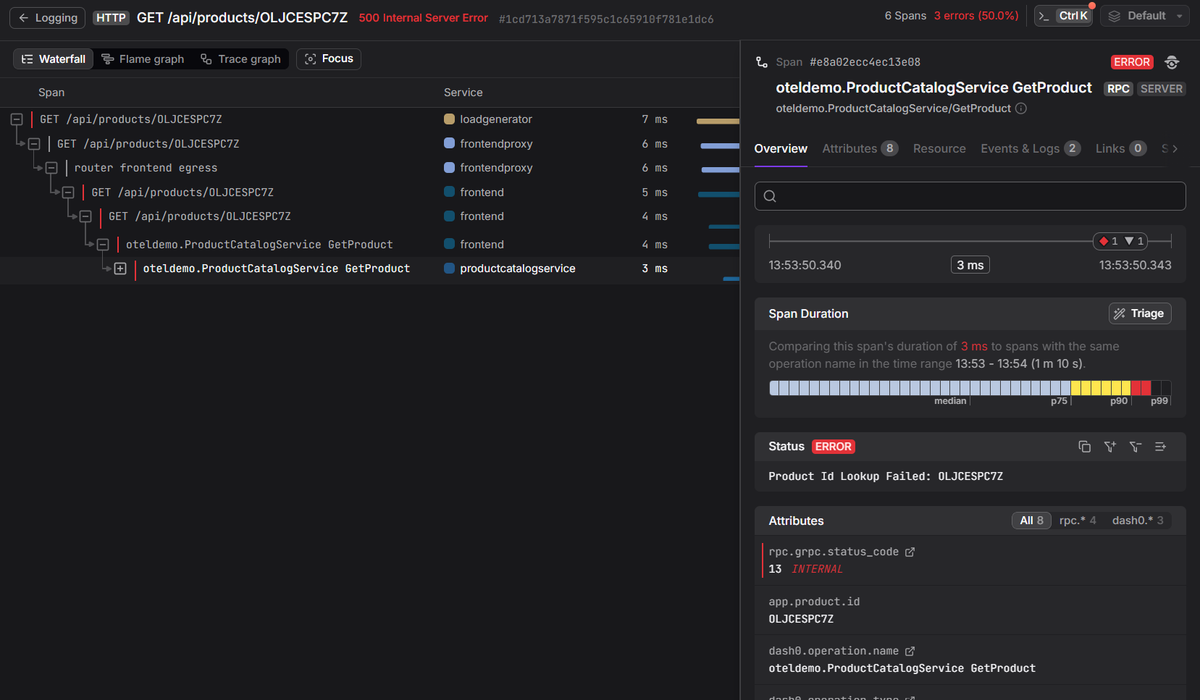
Jump to the full trace. The
trace_idfrom the error log leads to the full request path. The waterfall shows every service the request touched: it entered through a load generator, passed through a frontend proxy, through the frontend, and finally reached the product catalogue service where the failure occurred. Six spans, three errors, 7ms total.The failed span tells you exactly what broke. Status
ERROR,rpc.grpc.status_code = 13 INTERNAL, on a specific product ID. Not a vague 500. A named operation, in a named service, on a named resource.
The entire sequence takes minutes rather than hours, not because the logs are smarter, but because they're structured, carry context, and have been deduplicated before they reach you.
The export stage pays off here too. Because the Collector can fan logs out to multiple destinations simultaneously, you aren't locked into a single observability platform. In our example we've used Dash0, but you could send the same log stream to two or more backends in parallel, compare how each surfaces and alerts on your data, and switch over when you're ready. The instrumentation stays the same regardless of where the data lands.
Final thoughts
Log management still starts with collecting logs from many places and making them searchable in one. But modern systems ask more of the pipeline. Getting it right means designing the full path from source to storage so logs carry enough structure, context, and signal that your team can figure out what happened without spending thirty minutes scrolling through PaymentTimeout lines at 2am.
