
Last updated: September 28, 2026
What Is AI Observability?
AI observability is the practice of collecting telemetry that explains how an AI system behaves in production: the model, the data feeding it, the infrastructure running it, and the decisions it makes on real traffic.
It gets used as a stand-in for "LLM observability," but that undersells it. A fraud model drifting out of calibration, a retriever returning the wrong documents, an agent calling the wrong tool: all AI failures, and only one of those is an LLM problem. Predictive ML monitoring, LLM-specific signals (see what is LLM observability), and agentic execution tracing are all part of the same discipline, and most real systems run all three in the same request path.
Here's what each layer actually needs, how OpenTelemetry ties it together, and what to instrument first if you're starting from nothing.
What each layer actually needs
The practical scope is the entire path a request takes through your AI system. Some of these layers are served well by the observability you already run; others need signals that don't exist in a traditional Application Performance Monitoring (APM) tool.
Infrastructure is the most familiar ground. AI workloads run on the same compute, network, and storage as everything else, plus GPUs. GPU utilization, memory pressure, inference queue depth, and cold-start latency on serverless model endpoints are the metrics to watch, and standard infrastructure monitoring handles most of it.
The model and serving layer is where the request hits a model. For a self-hosted model that means request latency, throughput, error rates, and saturation of the serving runtime. For a managed provider like OpenAI, Anthropic, or Bedrock, you're observing a black box you don't control, so the signals you can capture are latency, token counts, rate-limit responses, and provider-side errors. Instrumenting the call yourself matters here: the provider won't tell you when their model quietly changes behavior.
The data layer is the one teams most often skip, and it's where the expensive failures hide. For predictive models this is feature freshness and distribution drift. For Retrieval-Augmented Generation (RAG) systems it's embedding quality, retrieval relevance, and how many documents you're pulling into context. A retriever that starts returning subtly worse matches degrades answer quality with zero infrastructure symptoms. Nothing alerts. Users just get worse answers.
The orchestration and agentic layer is the control flow: prompt and response pairs, retries, tool-call timing, and the decision branches an agent takes. This is where distributed tracing becomes load-bearing in AI systems, because a coherent agent run only makes sense as a single trace with a span per step.
The application layer is where users actually experience the system, and it's the cheapest quality signal you have. A thumbs-up/thumbs-down ratio, correction rates, and abandonment give you a feedback loop you can alert on long before a formal evaluation pipeline is in place.
How OpenTelemetry ties it together
The temptation is to buy a separate AI-specific tool that captures prompts and token counts in its own proprietary schema, sitting next to the observability stack you already run. That leaves you correlating across two systems by hand every time an agent run touches a database and a downstream service, which is most of the time.
OpenTelemetry is the cleaner path. Its GenAI semantic conventions standardize AI telemetry under the gen_ai.* namespace, so model calls, agent runs, and tool executions are ordinary spans that land in the same trace as the HTTP request, the database query, and the cache lookup around them, correlated by trace context and queryable with the tooling you already use. The conventions are still in development status as of mid-2026, so pin the instrumentation library you build against and record which schema version it targets. OpenTelemetry GenAI semantic conventions explained has the attribute and operation reference.
What to instrument first
You don't need to solve every layer on day one. If you're bolting AI onto an existing product, most of the value comes from a handful of steps, roughly in this order:
- Wrap every model, agent, and tool call in a span, using the GenAI conventions, so it lands in the same trace as the HTTP request that triggered it. This alone turns "the AI feature feels slow" into "step 3 of 7 in the agent loop is stuck waiting on a tool call to the pricing service," which is a ticket you can actually assign.
- Capture prompts and responses, redacted or sampled if you have compliance constraints, so you can reconstruct what the model actually saw when a user reports a bad answer. Without this, "the model said something wrong" is undebuggable after the fact.
- Add a feedback signal, even a blunt thumbs-up/down button, and pipe it into the same telemetry pipeline as everything else. It's the cheapest quality metric available to you, and it flags problems before a formal evaluation pipeline would.
- Track drift on anything predictive, meaning feature and prediction distributions for classifiers, and retrieval relevance for RAG. This layer fails silently, so it needs its own alerts rather than piggybacking on the latency and error-rate thresholds you already have for APIs.
- Alert on token volume and cost, not just latency. A model that's fast and cheap on Tuesday can turn into a runaway bill on Wednesday if a retry loop or a bloated system prompt slips into production, and nothing in a standard APM dashboard will catch that.
That's enough to go from "we have no idea what the AI is doing in production" to "we can reconstruct any specific run and we know when quality is slipping," without a rewrite of the observability stack you already have.
Things that go wrong
Two failure modes show up more than any others.
The first is standing up a beautiful prompt-and-token dashboard for the chatbot while the fraud model or recommender runs with no drift detection at all. The predictive model fails statistically and silently, the dashboards stay green, and the first signal is often a downstream business metric, a revenue dip or a drop in conversion, rather than anything in your observability tooling. If you have classical models in production, they need distribution monitoring regardless of what else you're watching.
The second is watching outputs but not the data layer. Training-serving skew and stale features produce a model that looks healthy on every operational metric while making worse decisions every day. The same is true of a RAG retriever silently returning weaker matches. Output quality is downstream of data quality, and that relationship doesn't show up in latency or error rates.
Worth keeping straight as well: there's a difference between monitoring and observability. A dashboard that alerts when latency crosses a threshold is monitoring. Observability is the ability to answer a question you didn't predict in advance, like why this specific agent run cost ten times the median, which requires capturing enough span-level context to reconstruct any individual execution after the fact. For probabilistic systems where you can't enumerate the failure modes ahead of time, that reconstruction ability is the point.
Final thoughts
The AI observability problem isn't a separate discipline to bolt on next to your existing stack. It's an extension of what you already do, applied to the parts of an AI system that traditional tooling never had to reason about: statistical drift in predictive models, semantic quality in generative ones, execution paths in agentic ones. Start with the checklist above, capture it all as OpenTelemetry spans and metrics, and the rest of the picture builds on top of infrastructure you already run.
Dash0 is an OpenTelemetry-native observability platform that ingests AI telemetry through the same pipeline as your infrastructure metrics, logs, and distributed traces. You can follow a request from a user's thumbs-down click through the agent's decision graph to the GPU it ran on, in one view. Agent0 can investigate what it finds there and act on it, with human review at each stage until you're confident enough to let it run further on its own. The agentic observability guide shows what that looks like in practice.
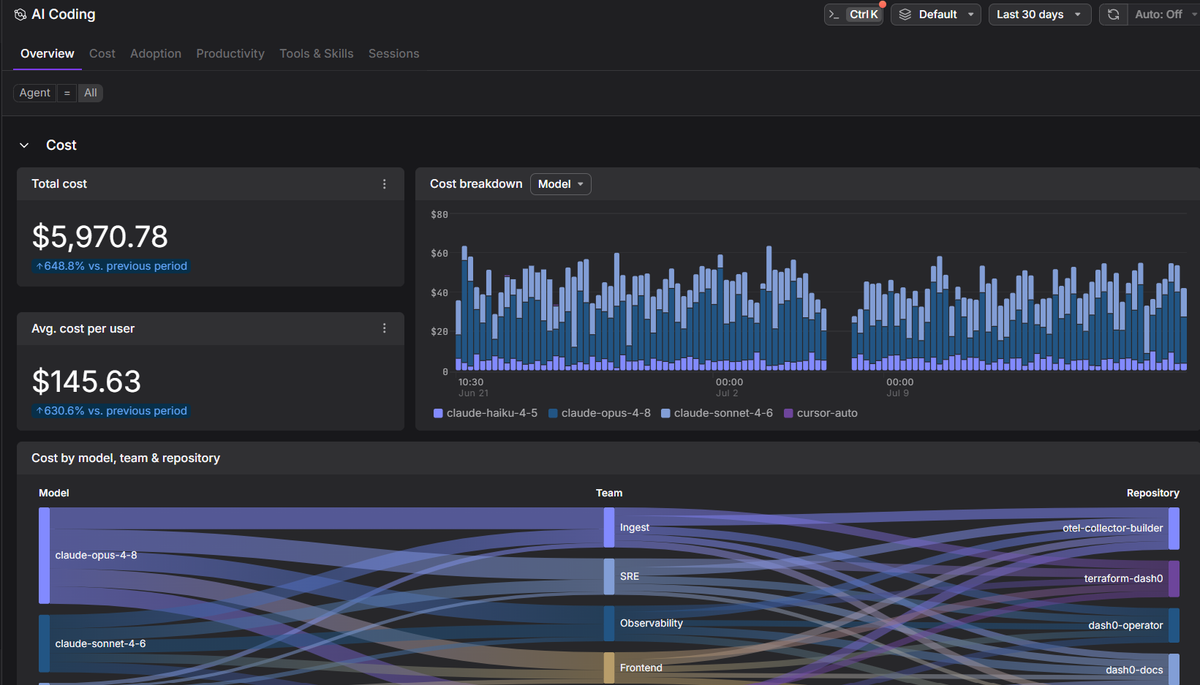 Start a free trial to see your AI traces, token usage, and agent spans alongside the rest of your stack. No credit card required.
