Last updated: January 9, 2026
Winston Log Levels Explained and How to Use Them
If you're running Node.js services in production, logging is still one of most valuable tools you have to figure out problems when something goes wrong at 3 a.m.
Winston is one of the most widely used logging libraries in the Node.js ecosystem as it's flexible and unopinionated enough to adapt to almost any environment. That flexibility is powerful, but it also makes it easy to misuse log levels and quietly sabotage your own observability.
Every time you pick a log level, you're answering a question for your future self:
- Is this expected under normal operation?
- Is this something I want alerts or dashboards for?
- Is this detail only useful when I'm actively debugging?
In this article, we'll walk through Winston's log levels, what they actually mean in practice and how they map to modern observability standards.
Let's get started!
Winston log levels in order
Out of the box, Winston ships with several predefined level sets. By default, it
uses the npm levels, which look like this, ordered from least to most severe:
| Level | Numeric severity | When to use it |
|---|---|---|
silly | 6 | Extremely detailed execution traces, almost never enabled in production. |
debug | 5 | Diagnostic details about internal decisions and state. |
verbose | 4 | Additional context beyond normal operation, often transitional or noisy. |
info | 2 | Normal, expected application behavior. |
warn | 1 | Something unexpected happened, but the system can continue safely. |
error | 0 | An operation failed and functionality was impacted. |
Winston considers lower numeric values more severe internally, but the important thing is conceptual ordering, not the numbers.
Using Syslog levels
Winston also includes a predefined set of levels compliant with the Syslog
protocol, which is common in Unix-like systems. To use these levels, you
configure your logger with winston.config.syslog.levels:
12345import winston from "winston";const logger = winston.createLogger({levels: winston.config.syslog.levels,});
This configuration provides the following logging methods, in increasing order of severity:
12345678logger.debug("detailed debugging information");logger.info("standard informational message");logger.notice("user logged in");logger.warning("disk space running low");logger.error("an application error occurred");logger.crit("a critical system component failed");logger.alert("database is down, immediate action required");logger.emerg("system has crashed and is unusable");
Winston custom log levels and OpenTelemetry alignment
Winston allows you to define custom level sets which is helpful if you'd like align your application with more widely used severity categories such as OpenTelemetry's.
A common setup looks like this:
12345678910111213141516const logger = winston.createLogger({levels: {fatal: 0,error: 1,warn: 2,info: 3,debug: 4,trace: 5,},level: "info",transports: [new winston.transports.Console()],});logger.trace("Entered request handler");logger.info("Request completed");logger.error("Database query failed");
Even though Winston's internal numeric ordering differs from OpenTelemetry's
SeverityNumber, the named levels map cleanly to TRACE, DEBUG, INFO,
WARN, ERROR, and FATAL
when exported through proper instrumentation.
How to set the log level of an event
In Winston, log levels are chosen when you emit the log. Most applications use the level-specific helpers, which keeps intent clear and readable.
12345678910import winston from "winston";const logger = winston.createLogger({transports: [new winston.transports.Console()],});logger.debug("Selected payment provider", { provider: "stripe" });logger.info("Order placed", { orderId: "ord_123", total: 4999 });logger.warn("Retrying database connection", { attempt: 5 });logger.error("Payment failed", { orderId: "ord_123", reason: "timeout" });
A practical way to think about the levels:
silly,debug,verbose,trace: Internal behavior. These explain how the system made a decision. They're usually off in production.info: Business-as-usual. If everything is healthy, most of your logs live here.warn: Something is off. Not broken yet, but worth investigating before it becomes an actual problem.error: A failure occurred. This should be actionable and measurable.fatal: Your application is about to terminate due to an unrecoverable error.
If you're hesitating between two levels, ask yourself whether this event should
trigger investigation if it spikes. If yes, it probably isn't info.
Winston's default log level behavior
If you don't explicitly configure a level on a Winston logger, it defaults to
info. This means that anything less severe is dropped:
12345678const logger = winston.createLogger({transports: [new winston.transports.Console()],});logger.debug("This will not appear");logger.info("This will appear");logger.warn("This will appear");logger.error("This will appear");
This default is intentional as it keeps production logs focused on operational signal instead of internal chatter.
To enable more verbose output, you must lower the threshold explicitly:
1234567const logger = winston.createLogger({level: "debug", // change the minimum log level heretransports: [new winston.transports.Console()],});logger.debug("Now this debug message is visible");logger.info("So is this");
Think of the configured level as a hard floor. Logs below it don't exist, which means they cost almost nothing at runtime.
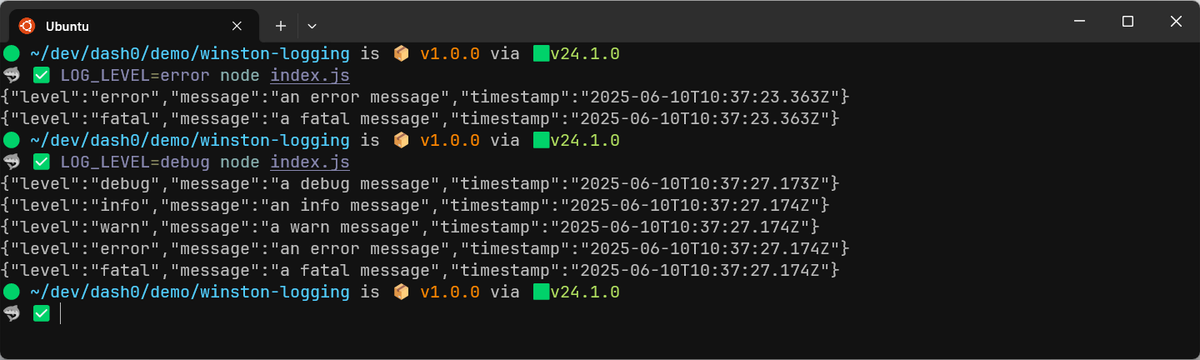
Overriding Winston log levels by environment
In Node.js applications, log level is commonly controlled through environment variables. This lets you adjust verbosity without changing code:
1234const logger = winston.createLogger({level: process.env.LOG_LEVEL || "info",transports: [new winston.transports.Console()],});
Then when starting the application, use:
1LOG_LEVEL=debug node index.js
This pattern is simple, predictable, and works well with containers and orchestration systems.
Using different log levels per Winston transport
Winston routes logs through transports, and each transport can have its own level threshold. This lets you keep noisy logs out of places where they don't belong.
123456789101112131415const logger = winston.createLogger({level: "debug",transports: [new winston.transports.Console({level: "info",}),new winston.transports.File({filename: "app.log",level: "debug",}),],});logger.debug("Written to file, not console");logger.info("Written to both");
In this setup:
- Debug logs go to disk for later inspection
- Console output stays readable
- High-severity logs go everywhere
This is one of Winston's strongest features, but it only works if your levels are chosen consistently.
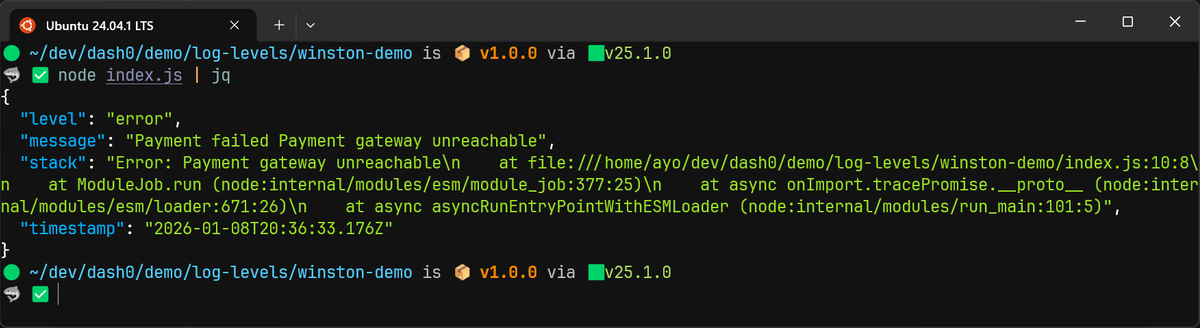
Logging exceptions correctly in Winston
Unlike some other frameworks, Winston requires explicit configuration to capture
error stack traces correctly. Without the errors formatter, you'll lose
critical context:
123456789101112const { combine, timestamp, json, errors } = winston.format;const logger = winston.createLogger({format: combine(errors({ stack: true }), timestamp(), json()),transports: [new winston.transports.Console()],});try {throw new Error("Payment gateway unreachable");} catch (err) {logger.error("Payment failed", err);}
This produces structured logs that include both the message and the stack trace, which is essential for debugging and correlation.
Performance considerations with verbose logging
Winston does not evaluate log messages below the active level, but any work you do before calling the logger still happens. This matters in hot paths like request handlers or tight loops.
Avoid patterns like this:
1logger.debug(`Computed result: ${expensiveComputation()}`);
Even if debug is disabled, you'll still pay for the computation. Instead, pass
data lazily or guard explicitly when needed:
123if (logger.isLevelEnabled("debug")) {logger.debug("Computed result", { result: expensiveComputation() });}
You don't need to do this everywhere. Just focus on high-volume paths where the cost adds up.
Making Winston levels actionable with Dash0
Log levels are just labels until your observability tooling uses them for prioritization, filtering, and alerting.
At Dash0, severity is shown as a clear visual hierarchy so that errors and warnings stand out immediately, while less severe logs stay in the background unless you deliberately drill in.
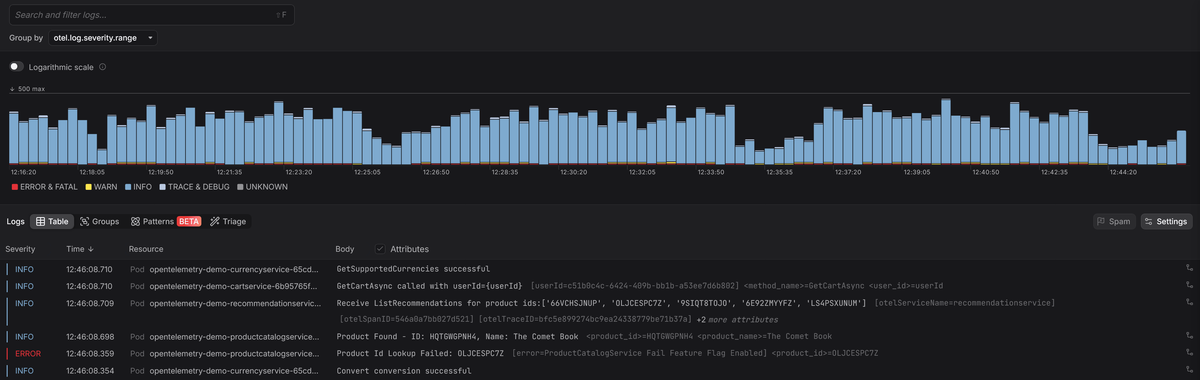
Since Dash0 is OpenTelemetry-native, it automatically correlates logs with traces using shared context. You can jump from an error straight to the affected requests and inspect lower-level logs only where they’re actually relevant.
Final thoughts
Log levels are part of your system's contract. If everyone uses them differently, filtering and alerting stop working.
Winston gives you a lot of freedom, but that freedom cuts both ways. Used deliberately, log levels turn your logs into a clear operational narrative. Used carelessly, they turn into background noise that nobody trusts.
Treat log levels as a design decision, not a cosmetic one. If you do, Winston will scale with your system and still be useful when things go sideways.
Try Dash0 today to make log levels actionable, spot error and warning trends early, and move from a failing log line to the root cause behind it in seconds.
