Last updated: February 15, 2026
Rails Log Levels Explained and How to Use Them
If you're running Ruby on Rails applications in production, logs are still the most reliable way to understand what your system is doing once it leaves your laptop.
Rails ships with a built-in logging system that is simple on the surface, but surprisingly subtle in practice. Log levels are the main tool Rails gives you to communicate intent to whoever reads those logs later.
That might be you in the middle of the night, another engineer on call, or an automated system trying to decide whether something deserves attention.
Every time you pick a log level, you are answering a question: Is this normal behavior, or is this a problem?
This article walks through Rails log levels in practical terms, how they behave at runtime, and how to use them without quietly sabotaging your observability.
Rails log levels in order
Rails uses Ruby's standard Logger class under the hood which defines six
severity levels, ordered from least to most severe:
| Level | What it represents |
|---|---|
DEBUG | Detailed internal behavior used during active troubleshooting. |
INFO | Normal, expected application behavior. |
WARN | Something unexpected happened, but the app can continue safely. |
ERROR | An operation failed and user visible behavior was impacted. |
FATAL | An unrecoverable condition that forces the process to exit. |
UNKNOWN | A catch-all for events that do not fit any other level. |
As severity increases, log volume should decrease and actionability should increase.
What each Rails log level really means
Rails exposes a logger at Rails.logger. By default, this is an instance of
ActiveSupport::Logger, which wraps Ruby's Logger and adds tagging,
formatting, and environment aware defaults.
You choose the log level at the moment you emit the log with the following level methods:
12345Rails.logger.debug("Entered payment authorization flow")Rails.logger.info("Order placed successfully")Rails.logger.warn("Retrying database connection attempt=#{attempt}")Rails.logger.error("Payment failed for order")Rails.logger.fatal("Missing DATABASE_URL. Shutting down.")
A useful mental model is to ask what someone should do if this message appears frequently.
DEBUG
DEBUG is for surfacing internal details when troubleshooting. Use it to
explain how the system made a decision, which branch was taken, or what
intermediate values looked like.
1Rails.logger.debug("Selected shipping_method=#{method} ruleset=#{ruleset.name}")
These logs are disabled in production by default and enabled temporarily during an investigation so that those details provide additional context about the issue you're debugging.
INFO
INFO is the backbone of healthy production logs. It describes normal, expected
behavior. If everything is working, most of your logs should live here.
1Rails.logger.info("User #{current_user.id} signed in from ip=#{request.remote_ip}")
WARN
WARN means something is off, but not broken yet. It is an early signal that
indicates that something needs investigation before it becomes an outright
failure.
1Rails.logger.warn("Database connection pool nearing capacity")
ERROR
ERROR means an operation failed and user facing behavior was impacted, even if
the process keeps running.
1Rails.logger.error("Failed to charge card order_id=#{order.id} error=#{e.class}")
Normally, errors can happen from time to time. But if your error log spikes, someone should care.
FATAL
FATAL is reserved for unrecoverable conditions. If you log at FATAL, the
process is usually about to exit, and the reason is documented through the
level.
1Rails.logger.fatal("Encryption key missing. Refusing to boot.")
If the app continues running normally after a FATAL log, that's a smell.
UNKNOWN
UNKNOWN exists mostly for compatibility. Rails almost never emits it
intentionally. If you see UNKNOWN logs, it usually means something bypassed
normal logging APIs or raised an object that did not map cleanly to a severity.
In most applications, you can safely ignore this level.
Default log level behavior in Rails
Rails automatically sets the default log level based on the environment. In
development, the default is DEBUG and it is upped to INFO in production:
1234Rails.logger.debug("This will not appear in production")Rails.logger.info("This will appear")Rails.logger.warn("This will appear")Rails.logger.error("This will appear")
This default keeps production logs focused on operational signal instead of internal chatter which just increases noise and cost.
Configuring Rails log levels
You usually configure log level per environment in the appropriate configure fie:
12# config/environments/production.rbconfig.log_level = :info
12# config/environments/development.rbconfig.log_level = :debug
You can also control log level via an environment variable:
1config.log_level = ENV.fetch("RAILS_LOG_LEVEL", "info").to_sym
Logging exceptions correctly
When something raises, always log the exception object itself. Do not flatten it into a string:
12345beginprocess_payment(order)rescue => eRails.logger.error(e, "Payment failed order_id=#{order.id}")end
This preserves the backtrace and error class, which is critical for debugging and for downstream tooling.
Choosing the level still follows the same rule:
- If the operation failed but the app keeps running, use
ERROR. - If the app cannot safely continue, use
FATAL.
Performance considerations
Rails will not emit log messages below the active log level, but that does not mean the code inside the log statement is free.
Anything you compute before calling the logger still runs, even if the message is ultimately discarded.
This usually does not matter, until it does. Hot paths like request handlers, background job loops, or tight iterations can turn a harmless looking log line into real overhead.
Avoid patterns like this:
1Rails.logger.debug("Computed result #{expensive_computation}")
If DEBUG is disabled, the message will not be written, but
expensive_computation still runs.
In places where volume is high or the work is costly, guard the log explicitly:
123if Rails.logger.debug?Rails.logger.debug("Computed result #{expensive_computation}")end
You do not need to do this everywhere since most log lines are cheap enough to leave alone. Focus on the few paths where logging happens frequently enough that the extra work adds up.
Common mistakes with Rails log levels
The same few mistakes show up in most Rails codebases.
A common one is logging real failures at INFO because "the error is handled".
The code may recover, but the failure still happened. When those events blend in
with normal traffic, it becomes much harder to spot real problems.
Another is using ERROR for user driven outcomes like validation failures or
bad input. These are expected conditions, not system failures. Treating them as
errors inflates error rates and slowly trains teams to ignore error logs
entirely.
And then there is the classic: leaving DEBUG logging enabled in production. At
scale, this drives up log volume, ingestion and storage costs, and adds real CPU
and I/O overhead. In severe cases, it leads to meaningful financial and runtime
penalties, while burying the signals you actually need during an incident.
Log levels only work when they are applied consistently and with intent. If everything is an error, nothing is.
How Rails log levels map to OpenTelemetry
When Rails logs are exported through an OpenTelemetry pipeline, their severity is normalized into OpenTelemetry’s standard severity model. This normalization is what allows logs from Ruby, Java, Go, and other runtimes to be analyzed together.
Rails uses Ruby’s built in Logger levels, which map cleanly onto
OpenTelemetry’s severity categories. A typical mapping looks like this:
| Ruby / Rails level | SeverityText | SeverityNumber |
|---|---|---|
DEBUG | DEBUG | 5–8 |
INFO | INFO | 9–12 |
WARN | WARN | 13–16 |
ERROR | ERROR | 17–20 |
FATAL | FATAL | 21–24 |
UNKNOWN | UNSPECIFIED | 0 |
A few practical notes:
-
Rails does not have a dedicated
TRACElevel butDEBUGtypically fills that role when exported to OpenTelemetry. -
UNKNOWNis treated as an unspecified severity and is usually a sign that something bypassed normal logging APIs.
Without this normalization, a Rails WARN and a Java WARNING would look
unrelated, even though they express the same intent.
With OpenTelemetry, SeverityNumber is what makes logs carry the same meaning
regardless of which language ecosystem produced it.
Centralizing Rails logs in Dash0
Rails logs become far more useful once they leave the local file and land in a system designed for investigation, not just storage.
When Rails logs are sent to Dash0 through an
OpenTelemetry pipeline, log levels are preserved and normalized across services
and languages. A WARN from a Rails app carries the same meaning as a WARN
from a Java or Go service, which makes cross service analysis possible instead
of confusing.
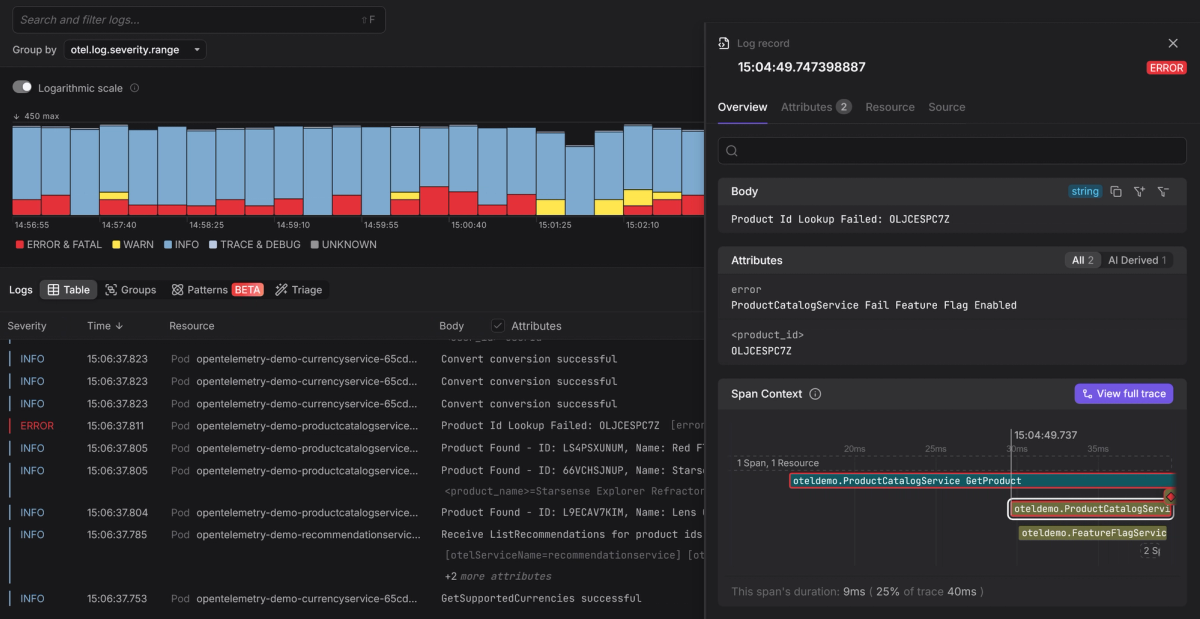
Because Dash0 is OpenTelemetry-native, Rails logs are automatically correlated
with traces using shared context like trace and span IDs. That means you can
start from an ERROR log and immediately see the exact request path, spans, and
related log lines that led up to it, without jumping between tools or guessing
what is connected.
Centralizing Rails logs this way turns log levels into a workflow. Instead of grepping through noise, you move from symptom to cause with context already in place.
Final thoughts
Log levels are important for signalling which events are routine, which ones signal risk, and which ones mean something actually failed.
When they're treated as a core part of your observability strategy, logs tell a clear, trustworthy story under pressure. But when treated merely as decoration, your logs turn into noise that everyone learns to ignore.
If you find yourself outgrowing Rails’ built-in logger, Semantic Logger exists as a more structured alternative that gives you finer control over log output while preserving familiar log level semantics.
Once your logs are structured and consistent, centralizing them is the natural next step. Try Dash0 today to bring Rails logs into a clear investigation workflow instead of just another stream of text in a generic storage backend.
