
Last updated:
What Is Frontend Monitoring?
Frontend monitoring is how you see what your application does after it leaves your servers: inside the user's browser, on their device, over their network. Backend monitoring stops at the response your API sends. Frontend monitoring picks up everything that happens next, from how fast the page paints to whether a button click actually does anything.
That gap is where most user-facing problems live. Your API can respond in 40ms while the user stares at a blank screen for four seconds because a render-blocking script hasn't finished parsing. Your server logs look clean while a null reference in a bundled component silently breaks checkout for everyone on Safari.
 This article covers what frontend monitoring actually measures, the two ways the data gets collected, and how to instrument the browser with OpenTelemetry so a slow interaction links straight to the backend span behind it.
What frontend monitoring measures
The signals fall into four groups, and each answers a different question about the user's experience.
Core Web Vitals are Google's field metrics for how a page feels. Largest Contentful Paint (LCP) measures loading, with a "good" threshold under 2.5 seconds. Interaction to Next Paint (INP) measures responsiveness, good under 200 milliseconds. Cumulative Layout Shift (CLS) measures visual stability, good under 0.1. INP replaced First Input Delay in March 2024, so any guide still telling you to optimize FID is out of date. Google grades these at the 75th percentile of real visits over a rolling 28-day window, which has direct consequences we'll come back to in the pitfalls.
JavaScript errors are the uncaught exceptions and unhandled promise rejections thrown in the browser. A good frontend monitor captures the error, the stack trace, the browser and device, and the sequence of actions that led to it, so you can reproduce a bug you never saw in your own testing.
Resource and network timing is the browser's view of every asset and API call: DNS lookup, TLS handshake, time to first byte, content download. This is latency as the user experiences it, including the parts your backend APM can't see, like a slow third-party analytics script or a CDN edge that's having a bad day.
User interactions and sessions tie the rest together. Which pages a user visited, what they clicked, where they rage-clicked, and where they abandoned the flow. This context is what turns "an error happened" into "an error happened to 3% of mobile users right after they hit the payment step."
Real user monitoring vs synthetic monitoring
There are two ways to collect this data, and you generally want both. Real user monitoring (RUM) instruments your live application and reports telemetry from real browsers in production, so it captures the messiness you'd never think to script: the flaky network, the ad blocker that breaks your checkout, the one device where a layout collapses. The tradeoff is that RUM has no data until a real user shows up, so it can't tell you a 3 a.m. deploy is broken before morning traffic finds out.
Synthetic monitoring fills that gap by running scripted checks from controlled locations on a schedule, which is what catches a regression on a critical path like login or checkout before users hit it. Use synthetic checks to guard the flows you care about most, and RUM to understand what's actually happening in the wild. For a deeper look at how RUM works on its own, including its data collection model and privacy surface, see what is real user monitoring.
Instrumenting the browser with OpenTelemetry
The vendor-neutral way to collect frontend telemetry is OpenTelemetry. Worth knowing up front: browser instrumentation in the OpenTelemetry JavaScript SDK is officially experimental, and a dedicated Browser SDK is still being built out. The setup below works today and is portable across any OTLP backend.
Install the web SDK, the auto-instrumentations bundle, and an exporter:
npm install \
  @opentelemetry/sdk-trace-web \
  @opentelemetry/auto-instrumentations-web \
  @opentelemetry/exporter-trace-otlp-http \
  @opentelemetry/context-zone \
  @opentelemetry/resources \
  @opentelemetry/semantic-conventions \
  @opentelemetry/core \
  @opentelemetry/instrumentation
Create a tracing file and import it before any other application code, so instrumentation is active from the first paint. This configures a tracer, wires up automatic instrumentation for document load, fetch, XHR, and user interactions, and registers the propagators that let trace context flow to your backend:
// tracing.js
import {
  WebTracerProvider,
  BatchSpanProcessor,
} from '@opentelemetry/sdk-trace-web';
import { OTLPTraceExporter } from '@opentelemetry/exporter-trace-otlp-http';
import { ZoneContextManager } from '@opentelemetry/context-zone';
import { registerInstrumentations } from '@opentelemetry/instrumentation';
import { getWebAutoInstrumentations } from '@opentelemetry/auto-instrumentations-web';
import { resourceFromAttributes } from '@opentelemetry/resources';
import { ATTR_SERVICE_NAME } from '@opentelemetry/semantic-conventions';
import {
  CompositePropagator,
  W3CTraceContextPropagator,
  W3CBaggagePropagator,
} from '@opentelemetry/core';

const exporter = new OTLPTraceExporter({
  url: 'https://<your-otlp-endpoint>/v1/traces',
  headers: { Authorization: 'Bearer <your-token>' },
});

const provider = new WebTracerProvider({
  resource: resourceFromAttributes({
    [ATTR_SERVICE_NAME]: 'storefront-web',
  }),
  spanProcessors: [new BatchSpanProcessor(exporter)],
});

provider.register({
  contextManager: new ZoneContextManager(),
  propagator: new CompositePropagator({
    propagators: [
      new W3CTraceContextPropagator(),
      new W3CBaggagePropagator(),
    ],
  }),
});

registerInstrumentations({
  instrumentations: [
    getWebAutoInstrumentations({
      // Propagate trace context to your own API domains
      '@opentelemetry/instrumentation-fetch': {
        propagateTraceHeaderCorsUrls: [/https:\/\/api\.example\.com/],
      },
      '@opentelemetry/instrumentation-xml-http-request': {
        propagateTraceHeaderCorsUrls: [/https:\/\/api\.example\.com/],
      },
    }),
  ],
});
Once this loads, you'll see spans for page loads, fetch and XHR requests, and user interactions flowing to your backend. The BatchSpanProcessor matters here: it buffers spans and sends them in batches instead of firing a network request per span, which keeps the instrumentation from competing with your application for the main thread.
Correlating frontend and backend
The reason to go through OpenTelemetry rather than a standalone RUM script is the propagateTraceHeaderCorsUrls option above. When the browser sends a request to a URL that matches, it attaches a W3C traceparent header. If your backend is also instrumented with OpenTelemetry, it continues that same trace instead of starting a new one.
The result is a single trace that begins at the user's click and runs all the way to the database query. Instead of "this page is slow," you get "this page is slow because this API call spent 1.8 seconds waiting on a query." That is the difference between a dashboard that shows you a red number and a tool that shows you the cause. If you're new to how backend traces work, distributed tracing is the other half of this picture.
One detail people miss: propagateTraceHeaderCorsUrls should only match your own API domains. If you propagate headers to third-party endpoints, you'll trigger CORS preflight failures and leak trace identifiers to services that have no idea what to do with them.
Common pitfalls
Trusting lab data over field data. A perfect Lighthouse score on your laptop tells you almost nothing. Google scores Core Web Vitals from real Chrome users at the 75th percentile, so a page that feels instant on your fiber connection can still fail if a quarter of your visitors are on slow phones. Lab tools are for debugging a specific run; only field data tells you whether you're actually passing.
Sampling blindly to control cost. RUM tools that bill per session push you toward sampling a small slice of traffic, and a naive random sample drops exactly what you need. Errors and rage-clicks are rare by definition, so uniform sampling throws them out along with the healthy sessions. If you sample at all, bias toward keeping the sessions that hit errors or slow interactions rather than a flat percentage.
Errors that resolve to minified gibberish. Production JavaScript is minified, so an uncaught error reports a location like main.a3f9.js:1:48210. That's not something you can act on. Uploading source maps to your monitoring backend maps it back to the original file, function, and line, which is the difference between an error report you can open a ticket from and one you ignore.
Treating every browser event as a span. OpenTelemetry models telemetry as spans, but a user session isn't naturally a span, and firing a span for every scroll and mouse move adds real overhead on the client. Be deliberate about what you instrument, lean on the batch processor, and don't turn the user's device into a telemetry firehose.
Final thoughts
Frontend monitoring closes the visibility gap between the response your server sends and the experience your user actually gets. The pieces are the signals worth capturing (Core Web Vitals, errors, network timing, sessions), the two collection methods (RUM and synthetic), and the OpenTelemetry instrumentation that connects a browser interaction to the backend trace behind it. Get those right and you can debug from the user's click down to the offending query instead of guessing.
If you'd rather not hand-roll the browser SDK setup shown above, Dash0 Website Monitoring does it for you in two lines of JavaScript. It's OpenTelemetry-native, so the traceparent propagation described here works out of the box: a slow interaction in the browser links straight to the backend distributed trace behind it, and billing is per event rather than per session, so you're not forced to sample away the sessions that matter. The website monitoring guide walks through the full setup.
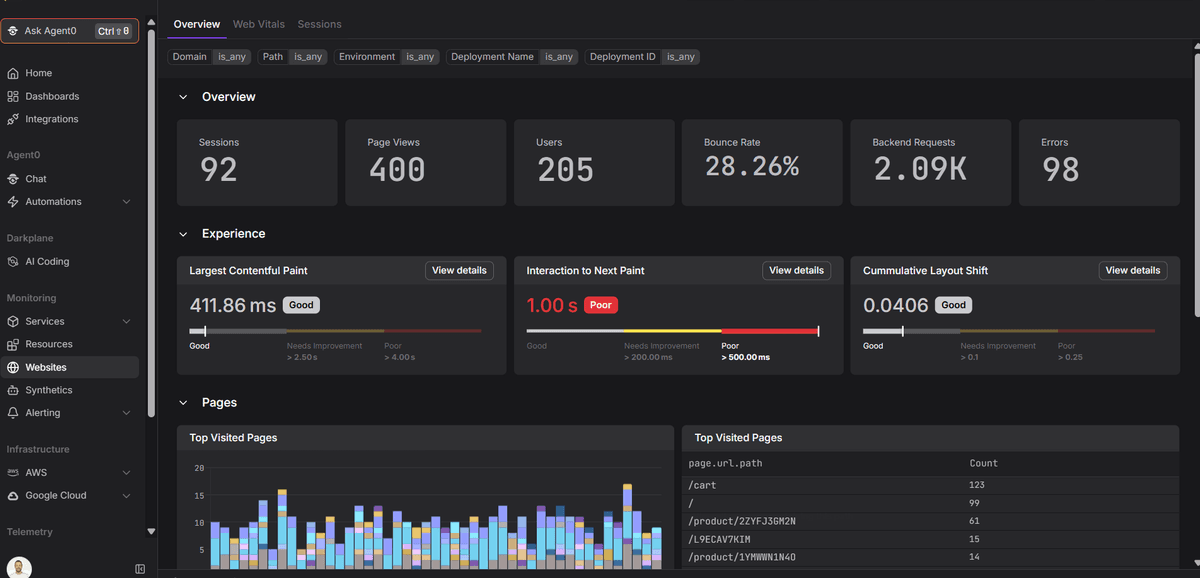 Start a free trial to see your frontend sessions, Core Web Vitals, and backend traces in one view. No credit card required.
