
Last updated: September 28, 2026
What Is Real User Monitoring (RUM)?
Real user monitoring (RUM) is the collection of performance, interaction, and error data from the browsers and mobile devices of the people actually using your application in production. It exists because your backend can look completely healthy while a user in another country stares at a blank screen for four seconds, waiting for render-blocking JavaScript to finish. RUM is the layer that tells you what the request felt like on the other end of the wire.
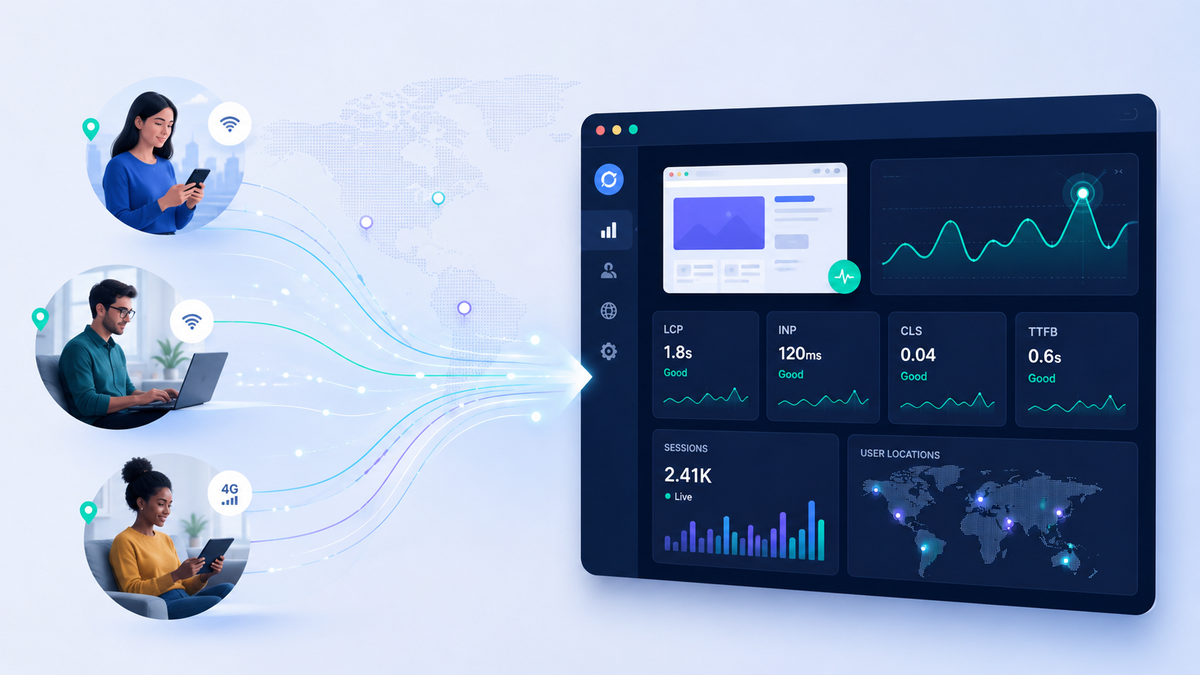 This article covers what RUM measures, how it collects data, where it fits alongside your other observability signals, and the failure modes that make RUM numbers misleading if you don't know what you're looking at.
How RUM actually works
RUM starts with a small piece of code that runs in the client. On the web that's a JavaScript SDK loaded early in the page so it can observe everything from the first navigation onward. On mobile it's a native SDK compiled into the app. Either way, the collector hooks into browser APIs that already exist for this purpose: Navigation Timing and Resource Timing for load performance, PerformanceObserver for paint and layout events, and global handlers for uncaught errors and promise rejections.
Every user session generates events. A session groups the page views, requests, interactions, and errors that belong to one person's visit, so you can reconstruct what they did instead of staring at disconnected averages. Those events get batched and sent to an ingestion endpoint, usually over HTTP, where they're aggregated into metrics and made searchable.
The browser makes this harder than backend telemetry, and it's worth knowing why. Users close tabs and navigate away mid-request, so buffered events can be lost before they're sent. Well-built RUM SDKs handle this by flushing on the page-hide event and using fetch with keepalive, which gives in-flight exports a chance to survive the page unload. If your RUM tool drops the last event of every session, you're systematically blind to rage-quits and crashes, which are the sessions you most want to see.
What RUM measures
The headline metrics for web RUM are Google's Core Web Vitals, because they track user-perceived experience and because Google uses them as a search ranking signal:
- Largest Contentful Paint (LCP): how long until the largest visible element renders. This is the reader's proxy for "did the page load."
- Interaction to Next Paint (INP): how quickly the page responds to input like clicks and taps. It replaced First Input Delay as the responsiveness metric in 2024.
- Cumulative Layout Shift (CLS): how much the layout jumps around during load. This is the reason you tap the wrong button when an ad pushes everything down.
Beyond the vitals, RUM captures time to first byte, first contentful paint, full page load time, resource load timings, and JavaScript errors with stack traces. It also captures contextual dimensions: device type, browser version, geography, network conditions. Those dimensions are the point. A p75 LCP of 2 seconds is just a number, but slice it by device and you find out your desktop users are fine while your mobile users on 4G are suffering.
One thing to watch on the vitals: report at the 75th percentile, not the average. Google evaluates Core Web Vitals at p75, and averages bury the tail. A page with a great median and a terrible p95 has a real problem for a real slice of users, and the mean will quietly average it out of sight.
RUM vs. synthetic monitoring
These two get conflated constantly, and they solve different problems.
Synthetic monitoring runs scripted checks from controlled environments on a fixed schedule. It hits your site from a known location, on a known device, at known intervals. That consistency is the strength: it catches outages during off-hours when nobody's around, and it validates a new deploy before real traffic reaches it. RUM can't do either, because RUM has no data until real users show up. Deploy a new version at 3 a.m. and you'll have nothing on it until customers start hitting it in the morning.
RUM's strength is the inverse. It sees the messiness you'd never think to script: the browser extension that breaks your checkout, the CDN edge that's slow only in São Paulo, the specific device-and-network combination that falls over. Synthetic tells you the site works under lab conditions. RUM tells you whether it works for the people paying you. Most serious teams run both.
Where RUM fits in observability
Traditional monitoring over-indexes on the backend, and it's an easy trap. Infrastructure dashboards are green, error rates are low, everything looks fine, and users are still unhappy. Backend health and user experience are not the same measurement. A service can return a 200 in 40 milliseconds while the browser spends three seconds parsing a bloated bundle before anything paints. RUM is the signal that closes that gap.
The real payoff comes from correlating RUM with your backend traces. When frontend telemetry and backend spans share the same trace context, a slow interaction in the browser links straight to the distributed trace behind it. Instead of "this page is slow," you get "this page is slow because this API call spent 1.8 seconds waiting on a database query." That view, from the user's click down to the offending query, is what turns RUM from a dashboard into a debugging tool.
This is where OpenTelemetry matters. RUM used to mean adopting a proprietary vendor SDK and accepting the lock-in that came with it. OpenTelemetry's client instrumentation lets you capture browser telemetry with an open, vendor-neutral data model, propagate trace context across the frontend-backend boundary, and send it anywhere that speaks OTLP. The browser instrumentation is still maturing, and the dedicated OpenTelemetry Browser SDK is an active work in progress, but production-ready OTel-native web SDKs already exist that capture sessions, Core Web Vitals, errors, and trace correlation without custom code.
Common pitfalls
Sampling away the interesting sessions. Many RUM tools price per session and nudge you toward sampling a low single-digit percentage of traffic. But errors and rage-clicks are rare by definition, so aggressive sampling drops exactly the sessions worth investigating. If you have to sample, sample intelligently: keep the sessions with errors and slow interactions, and thin out the boring healthy ones.
Treating vitals as bare numbers. Collecting Core Web Vitals as plain metrics tells you a page has poor LCP but not why. Without attribution data pointing at the element that caused the slow paint, you're guessing. Good RUM instrumentation attaches that causal context, so the metric is something you can act on rather than just something that turns red.
Ignoring the privacy surface. RUM runs in your users' browsers, and it can pick up user IDs, URLs with sensitive query parameters, and input data. That's subject to privacy regulation. Plan for data minimization, attribute redaction, and consent handling up front, rather than finding PII in your telemetry after the fact.
Forgetting the SDK is itself a performance cost. The code you added to measure performance gets downloaded and executed in the browser like everything else. A heavyweight RUM agent can measurably degrade the very metrics it reports. Favor a lightweight SDK and check its bundle size against what it actually gives you back.
Final thoughts
Once RUM is in place, the goal is to stop treating the frontend and backend as separate worlds. The insight that pays off is following one user interaction the whole way through: from the layout shift or slow click the user felt, through the HTTP request, down to the backend span and the query that caused it. Start with the Core Web Vitals at p75, wire up trace context propagation so frontend events link to backend spans, and be deliberate about sampling so you keep the sessions that actually went wrong.
Dash0's website monitoring is OpenTelemetry-native RUM. It captures real user sessions, Core Web Vitals at p75, page views, and JavaScript errors with source-map resolution, then links every frontend event to the backend distributed trace behind it through OpenTelemetry trace context propagation. Because it's built on open standards, your instrumentation stays portable, and pricing is per event instead of per session, so you're not forced to sample away the sessions that matter.
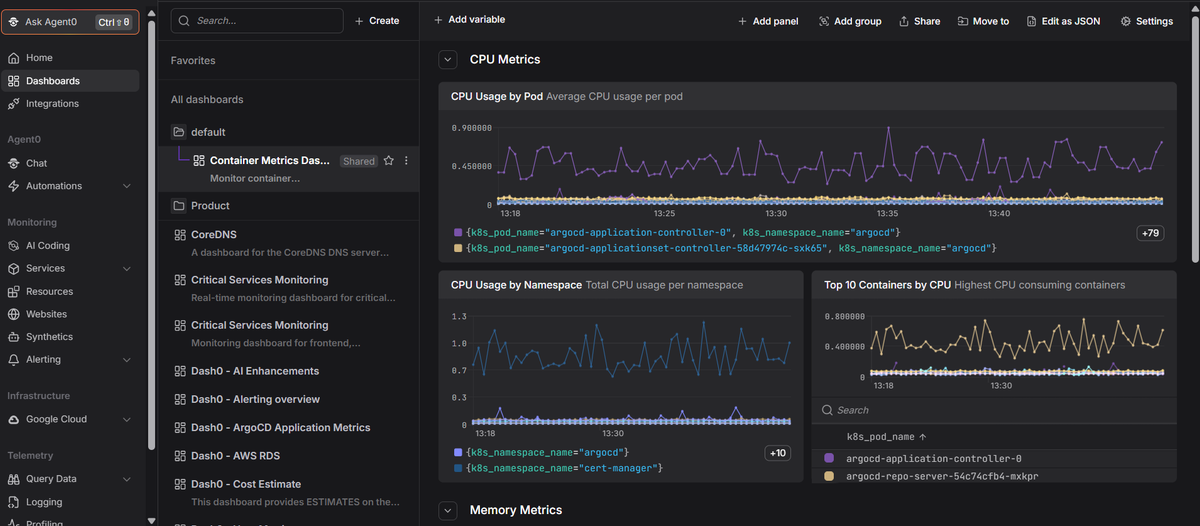 Start a free trial to see your real user sessions, web vitals, and backend traces correlated in one view. No credit card required.
