Last updated: July 17, 2026
About Metrics
The Metric Explorer lets you browse, filter, and investigate all metrics across your services and infrastructure — and is the starting point for deeper analysis in the Query Builder.
It is organized into the following areas:
Global Controls
- Filter — narrows the metric data shown across all views. More here...
- Command Menu — provides quick access to common actions and navigation. More here...
- Time Picker — sets the time range for all views. More here...
Metric Visualizations
- Tree Map — a proportional area chart that sizes each metric by a selected dimension (Cardinality, Resources, Score, or Data Points), making it easy to identify outliers at a glance. More here...
Metric List Modes
- Grouped — organizes metrics into a collapsible namespace hierarchy (e.g.
app.ads,argocd), making it easy to explore metrics by origin. More here... - Flat List — displays every metric as a single row, each annotated with its type, unit, data point count, cardinality score, cardinality count, and associated resource count. More here...
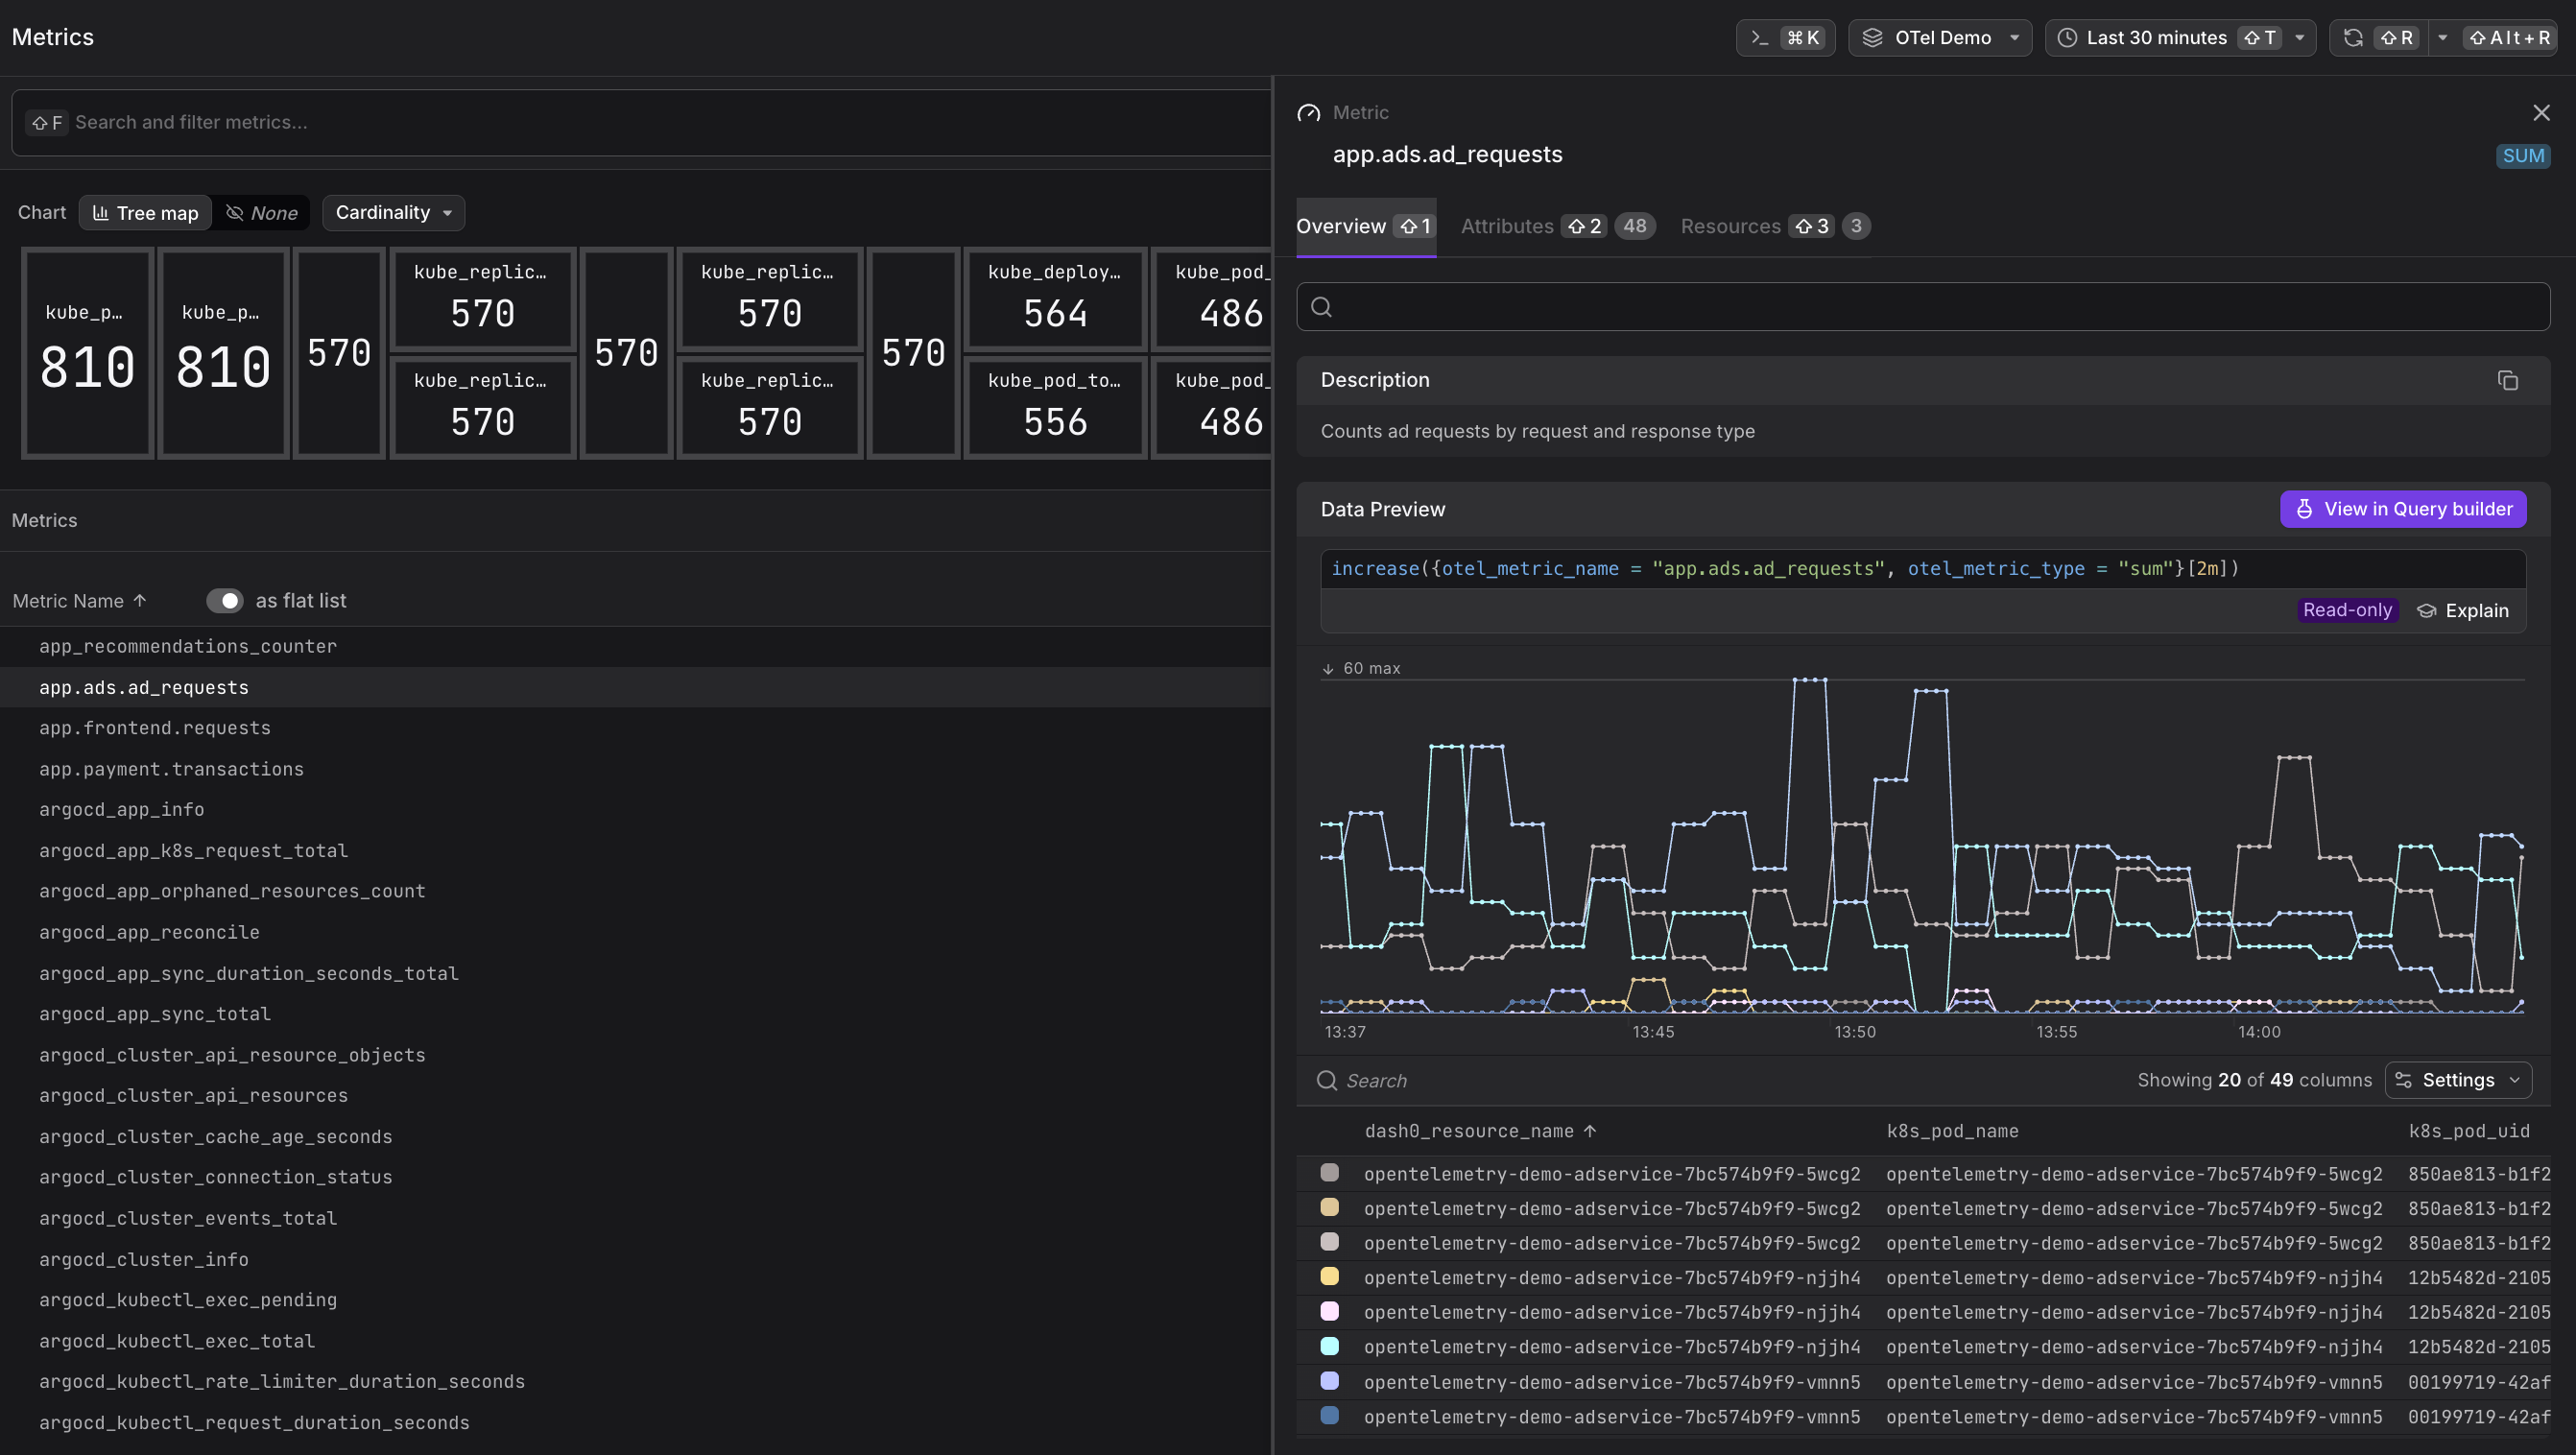
Metric Detail Panel
- Metric Sidebar — a context-sensitive detail panel that opens when a metric is selected, surfacing a description, a live data preview with the underlying PromQL query, and tabs for all observed attributes and associated resources. More here...
Supported Metric Types
Dash0 supports all OpenTelemetry metric data model types:
- Sum — a scalar value computed as the sum of all reported measurements. A Sum can be monotonic (only increases — produced by the OTel Counter instrument) or non-monotonic (can increase and decrease — produced by UpDownCounter). Displayed as
SUMin the Metric Explorer. - Gauge — a point-in-time measurement that can change arbitrarily, such as current memory usage or temperature. Displayed as
GAUGE. - Histogram — distributes observations into configurable buckets, useful for measuring request durations or response sizes. Displayed as
HIST. - Exponential Histogram — distributes observations into dynamically sized exponential buckets for more efficient storage. Displayed as
EXP HIST. - Summary (legacy) — similar to histograms but with client-side calculated quantiles. Displayed as
SUMMARY.
Reference: OTel Metrics Data Model
Synthetic metrics query the raw underlying signal data on demand, so they share the same retention as their respective signal (e.g., 30 days for spans and logs). Pre-computed metrics that are sent directly to Dash0 have a 13-month retention. See Optimize PromQL Query Performance for details.
From Metrics to Dashboards, Check Rules, and Agent0
Once you have the view you want, use the buttons at the top of the Metric Explorer, for the following.
![]()
- Click Add to dashboard to add the current query as a panel to a new or existing dashboard.
- Click Create check rule to open the check rule editor with this query pre-filled as the rule expression.
- Click Analyze with Agent0 to analyze the metrics, within the selected time range, with Agent0.
Control Costs with Spam Filters
High-cardinality metrics can generate significant telemetry volume and storage costs. Use spam filters to drop low-value metrics at ingestion time and reduce your observability spend.
For full context on cost control including spam filters, monthly budgets, and cost forecasting, see About Billing & Cost Control.
Common use cases for spam filtering metrics include:
- High-cardinality metrics — drop metrics with excessive label combinations that provide marginal value but consume disproportionate storage, such as metrics labeled with user IDs, session tokens, or IP addresses.
- Unused metrics — filter out metrics that are collected by default but never queried or monitored, such as overly granular system metrics or deprecated instrumentation.
- Development environments — exclude metrics from non-production services to focus your observability budget on production traffic.
- Noisy exporters — drop specific metric series from third-party exporters that generate high volume without adding diagnostic value.
To create a spam filter for metrics:
- Navigate to the Metric Explorer and define filter criteria that match the metrics you want to exclude (e.g.,
__name__ =~ "debug_.*"or use the Tree Map to identify high-cardinality metrics). - Click the Spam button in the toolbar.
- Review the filter definition and click Flag as spam to activate it.
Once active, matching metrics will be dropped at ingestion and will not count toward your storage costs or dataset quotas.
Data dropped by spam filters cannot be recovered. Test your filter criteria carefully before activating a spam filter, especially in production datasets. For metrics, consider the impact on existing dashboards and alerts that may depend on the filtered data.
Further Reading
-
Query Metrics in the Query Builder. Explains how to slice and dice metric data visually using the Query Builder's metric tab, and how to write arbitrary PromQL queries for advanced aggregations, joins, and threshold comparisons.
-
Understand Synthetic Metrics. Describes what synthetic metrics are, how Dash0 derives them on demand from raw logs, spans, and web events, why they default to the
increase()function, and how grouping controls the dimensions they expose. -
Understand OpenTelemetry Metric Names. Covers the
otel_metric_nameattribute, the standardized OpenTelemetry-to-Prometheus name mapping, and when to use each when writing PromQL queries in Dash0.