
Last updated: September 8, 2026
About Tracing
The Trace Explorer lets you investigate distributed traces — the records of how requests travel through your services.
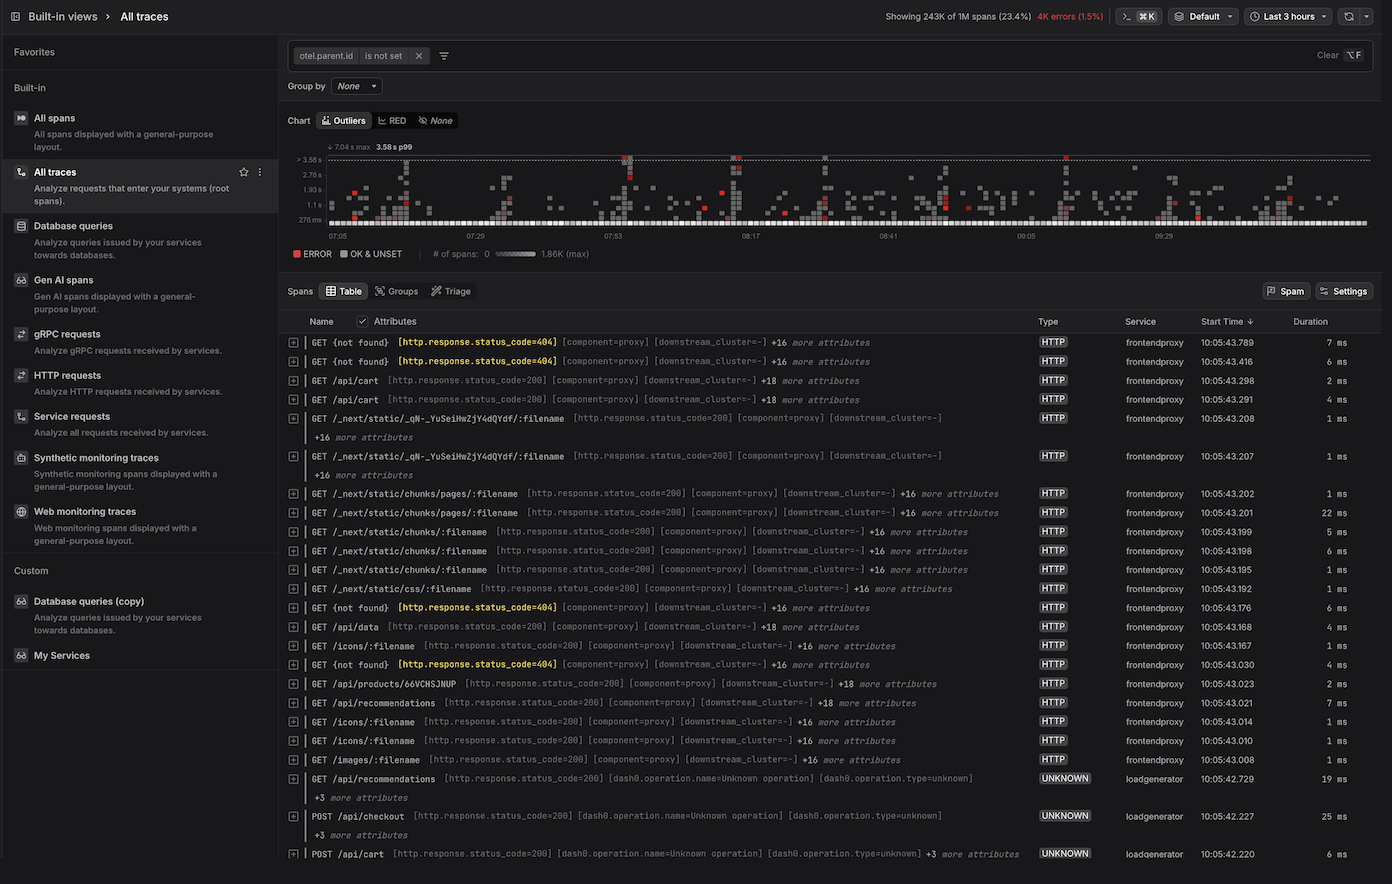
It is organized into the following areas:
Global Controls
- Filter — narrows the span data shown across all views. More here...
- Command Menu — provides quick access to common actions and navigation. More here...
- Time Picker — sets the time range for all views. More here...
Span Visualizations
- Outliers Map — a four-dimensional visualization that encodes time, duration, span concentration, and error rate simultaneously, making it easy to spot performance outliers and error spikes at a glance. More here...
- RED Metrics — a three-panel time series dashboard showing span throughput, error counts, and duration percentiles over time, based on the RED monitoring methodology. More here...
Span List Views
- Table — displays spans as a tree that reflects parent-child relationships within a trace, with configurable columns and durations expressed relative to a reference span. More here...
- Groups — aggregates spans by a selected attribute (e.g.,
service.name) and displays per-group ERROR metrics (count and percentage) and DURATION metrics in a sortable table. Each row is drillable, allowing you to navigate into the spans for that group. More here... - Triage — performs automated comparative analysis to identify attribute values that are disproportionately concentrated in erroneous or slow spans versus a baseline group. More here...
Span Detail Panels
- Span Sidebar — a context-sensitive detail panel that opens when a span is selected, surfacing attributes, resource metadata, related logs & events, span links, and raw OpenTelemetry payload data across dedicated tabs. More here...
- Trace View — provides a detailed look at a single trace in three visualizations: a waterfall, a flame graph, and a trace graph that shows how requests flowed across services. Supports navigating cross-trace span links. More here...
- Trace Views Explorer — the vertical navigation panel running along the left of the Trace Explorer that organizes saved span views into Favorites, Built-in, and Custom sections, providing quick access to pre-configured and user-defined perspectives on span data. More here...
From Spans to Dashboards, Check Rules, and Agent0
Once you have the view you want, use the buttons at the top of the Trace Explorer, for the following.

- Click Add to dashboard to add the current query as a panel to a new or existing dashboard.
- Click Create check rule to open the check rule editor with this query pre-filled as the rule expression.
- Click Analyze with Agent0 to analyze the spans, within the selected time range, with Agent0.
Control Costs with Spam Filters
Distributed traces can generate significant telemetry volume, especially for high-traffic services. Use spam filters to drop low-value spans at ingestion time and reduce Index costs.
For full context on cost control including spam filters, monthly budgets, and cost forecasting, see About Billing & Cost Control.
Common use cases for spam filtering traces include:
- Health check requests — drop spans for monitoring endpoints that generate high volume but provide little diagnostic value.
- Internal probes — exclude spans from synthetic monitoring or load balancer health checks that don't represent real user traffic.
- Development environments — filter out spans from non-production services to focus your observability budget on production traffic.
- Noisy dependencies — drop spans for specific external services or endpoints that generate excessive noise without adding value.
To create a spam filter for traces:
- Navigate to the Trace Explorer and define filter criteria that match the spans you want to exclude (e.g.,
http.route = /healthorservice.name = synthetic-monitor). - Click the Spam button in the toolbar.
- Review the filter definition and click Flag as spam to activate it.
Once active, matching spans will be dropped at ingestion and will not count toward your Index costs or dataset quotas.
Data dropped by spam filters cannot be recovered. Test your filter criteria carefully before activating a spam filter, especially in production datasets.
Further Reading
-
Visualize the Full Trace. Explains how to navigate the Trace View's waterfall, flame graph, and trace graph visualizations, and how to follow requests across trace boundaries using span links.
-
Understand Span Events. Describes what span events are, how they differ from regular spans, and how Dash0 can automatically convert span events to log records during ingestion.
-
Interpret Span Colors. Covers how span colors throughout the UI are derived from OpenTelemetry semantic conventions, including HTTP status codes, RPC status codes, and span types.