Last updated: May 16, 2026
Query Metrics in the Query Builder
The Query Builder is where you move from browsing to analyzing. While the Metric Explorer shows you what metrics exist, the Query Builder lets you slice, aggregate, and compare the underlying time-series data.
Open the Query Builder from the main vertical navigation on the left, or by clicking View in Query builder from the Metric Sidebar.
Two Ways to Query
The Query Builder offers two complementary modes, available as tabs:
Visual Query Mode (Services, Tracing, Logging, Metrics, Web Events tabs)
The visual tabs let you build queries by clicking, without writing any query language. They are the recommended starting point for most users.
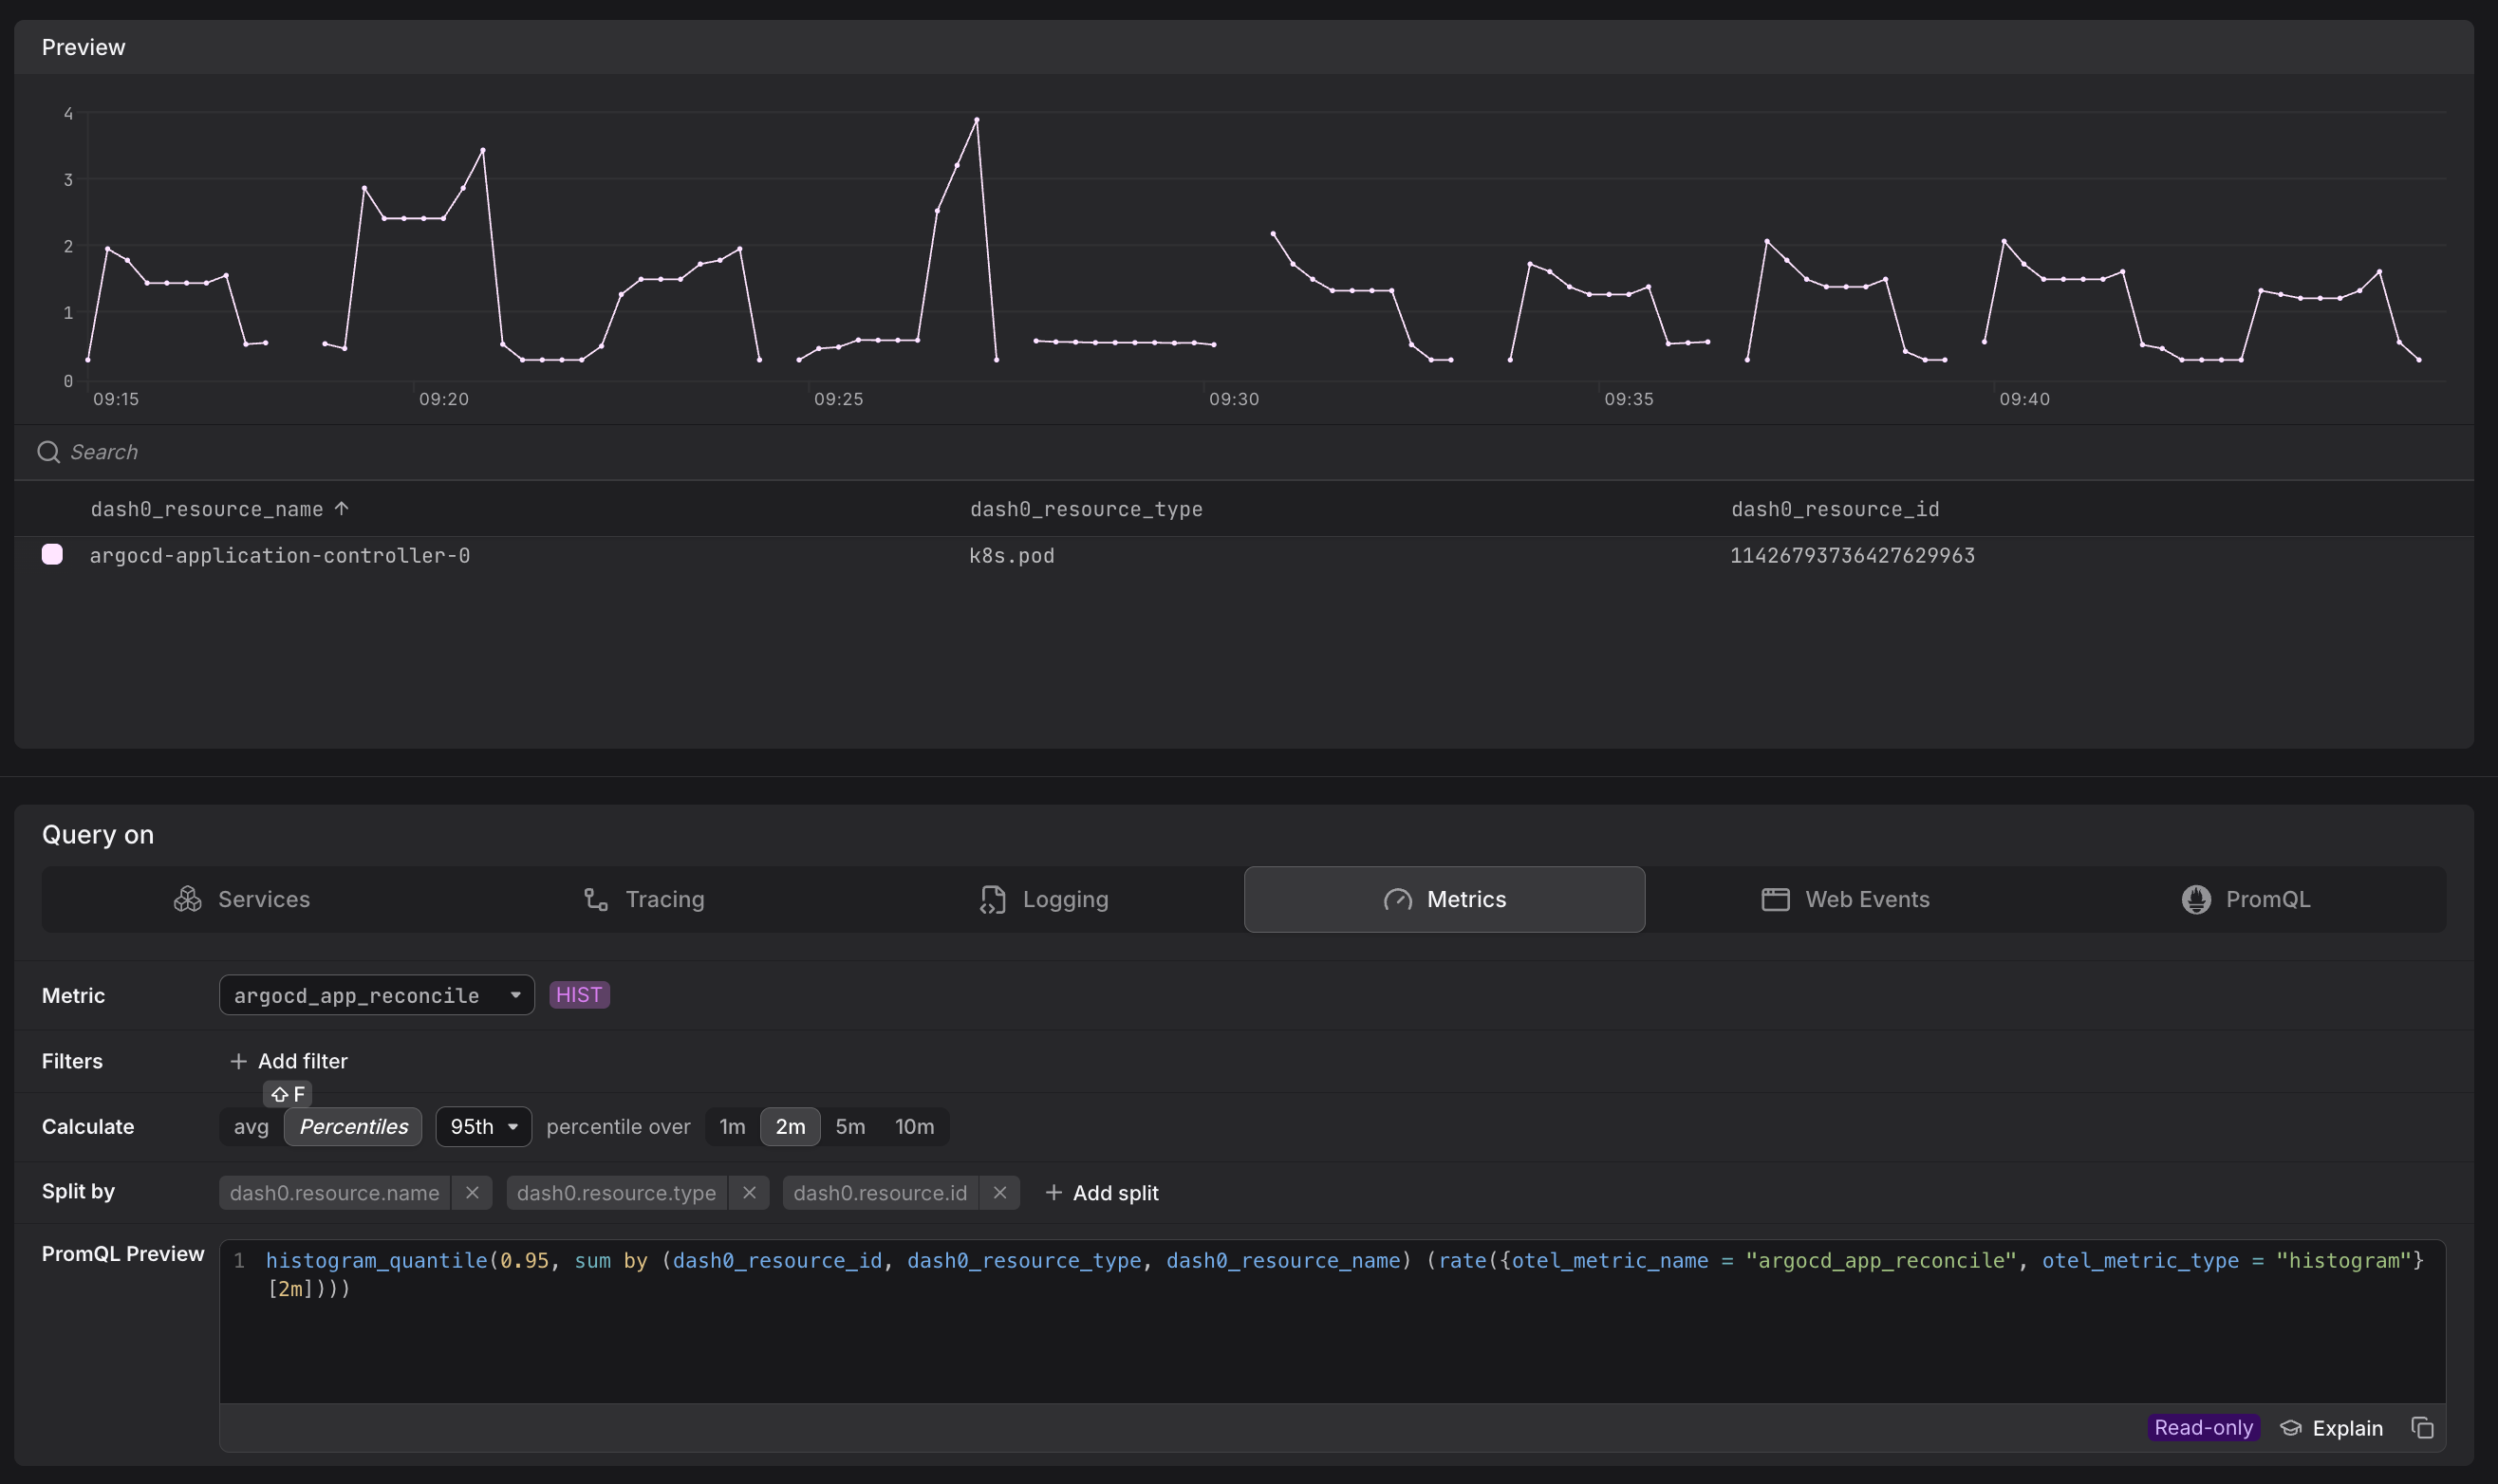
On the Metric tab, you can:
- Select any metric by name.
- Add filters to narrow the time series returned.
- Choose an aggregation function (e.g. sum, average, max) and a group-by attribute to break the result down by a specific dimension — for example, summing
app.frontend.requestsgrouped byservice.name.
The other tabs (Services, Tracing, Logging, Web Events) expose pre-defined query scenarios tailored to each signal type — for example, request rates and error rates for services, or log-pattern counts for logs. These are backed by synthetic metrics and use the same visual interface.
PromQL Mode
Switch to the PromQL tab to write raw Prometheus Query Language queries.
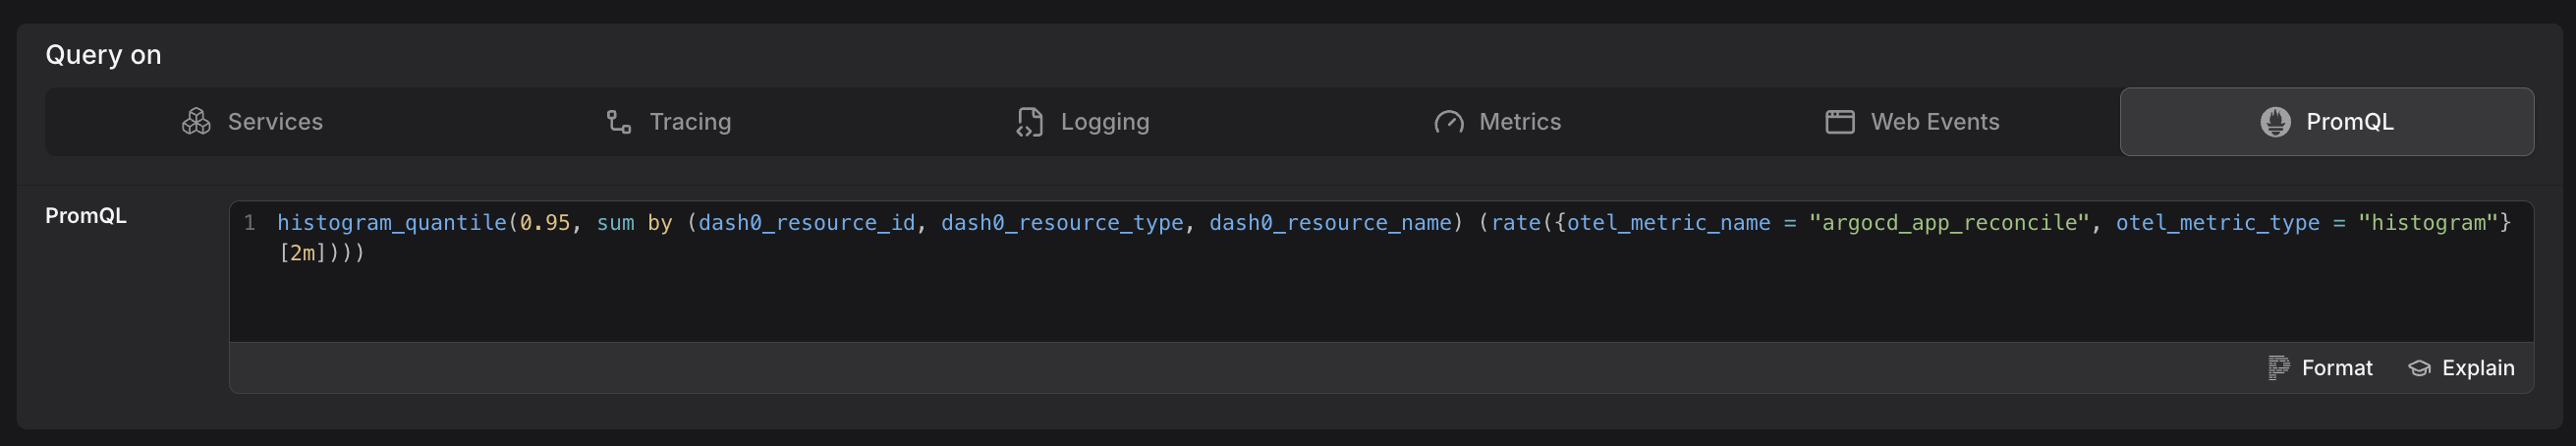
This mode is appropriate when you need capabilities the visual tabs do not expose:
- Joins — correlating two metric streams.
- Advanced aggregations — e.g.
topk,bottomk, histogram quantiles. - Threshold filters — keeping only values above or below a threshold (e.g.
> 10). - Metric comparisons — comparing the current value to a time-shifted baseline.
Dash0 runs a standard PromQL implementation with minor adjustments. See Understand OpenTelemetry Metric Names for guidance on using otel_metric_name label matchers instead of translated Prometheus metric names.
Two Ways to Promote Queries
The Query Builder isn't only for exploration. Once a query is working the way you want, you can push it directly into an alert or a dashboard without leaving the page.
From Query to Alert
Once you have a query that captures the signal you want to monitor, you can turn it directly into a check rule without leaving the Query Builder.
Click Create check rule in the top-right corner of the Query Builder. Dash0 transfers your current query — whether built visually or written in PromQL — into the check rule editor with the expression pre-populated.
From there you configure thresholds, evaluation frequency, and notification channels.
See Configure Alert Checks for the full setup.
The Create check rule button is available to organization admins. If you don't see it, ask an admin to create the rule or adjust your permissions.
From Query to Dashboard
Once you have a query worth keeping, you can save it as a dashboard panel without leaving the Query Builder.
Click Add to dashboard in the top-right corner of the Query Builder.
Dash0 saves your current query — visual or PromQL — as a new panel, which you can place on an existing dashboard or use to start a new one.
See Create Dashboards for the full setup.
Common PromQL Pitfalls
PromQL is expressive, but several patterns can silently return incomplete data, degrade performance, or behave differently in alerting contexts than they do in the Query Builder. The issues below are the most frequently encountered — understanding them upfront will save you significant debugging time.
Misaligned Range Selectors and Step Sizes
The most subtle and impactful PromQL mistake is using a range selector that doesn't match your chart's step size. If your chart step is 2 minutes but your query uses [1m], each evaluation only sees half the data — spikes that fall in the uncovered window go undetected.
Use $__rate_interval for all rate() and increase() queries. This variable automatically calculates the optimal range based on your scrape interval and chart step:
12345# Correct — adapts automatically as you zoom in or outrate(http_requests_total[$__rate_interval])# Risky — may return "No data" when zoomed inrate(http_requests_total[30s])
For avg_over_time() and similar aggregation functions, use $__interval directly. This issue also affects alert rules: if a check rule has a range of 30s but evaluates every 1m, it will always miss 30 seconds of data. See Common Metric Query Issues for a detailed walkthrough with diagrams.
Cumulative Counters Need rate() or increase()
Raw counter values only go up. Use rate() for per-second rates or increase() for total change over an interval. Dash0 applies increase() automatically in the visual tabs and data previews for cumulative metrics, but in PromQL mode you must apply it explicitly.
High-Cardinality Selectors Slow Queries
Selecting a metric without any label filters can return thousands of time series. Add otel_metric_name, otel_metric_type, or resource-level filters to constrain the result set before aggregating. See Optimize PromQL Query Performance for a full guide.
Step Size Affects Check Rules
A query that looks correct in the Query Builder may behave differently in a check rule, because check rules evaluate the query at a fixed step size rather than over a selected time range. Always validate the step size when moving a query from exploration to alerting.