Last updated: March 11, 2026
About Logging
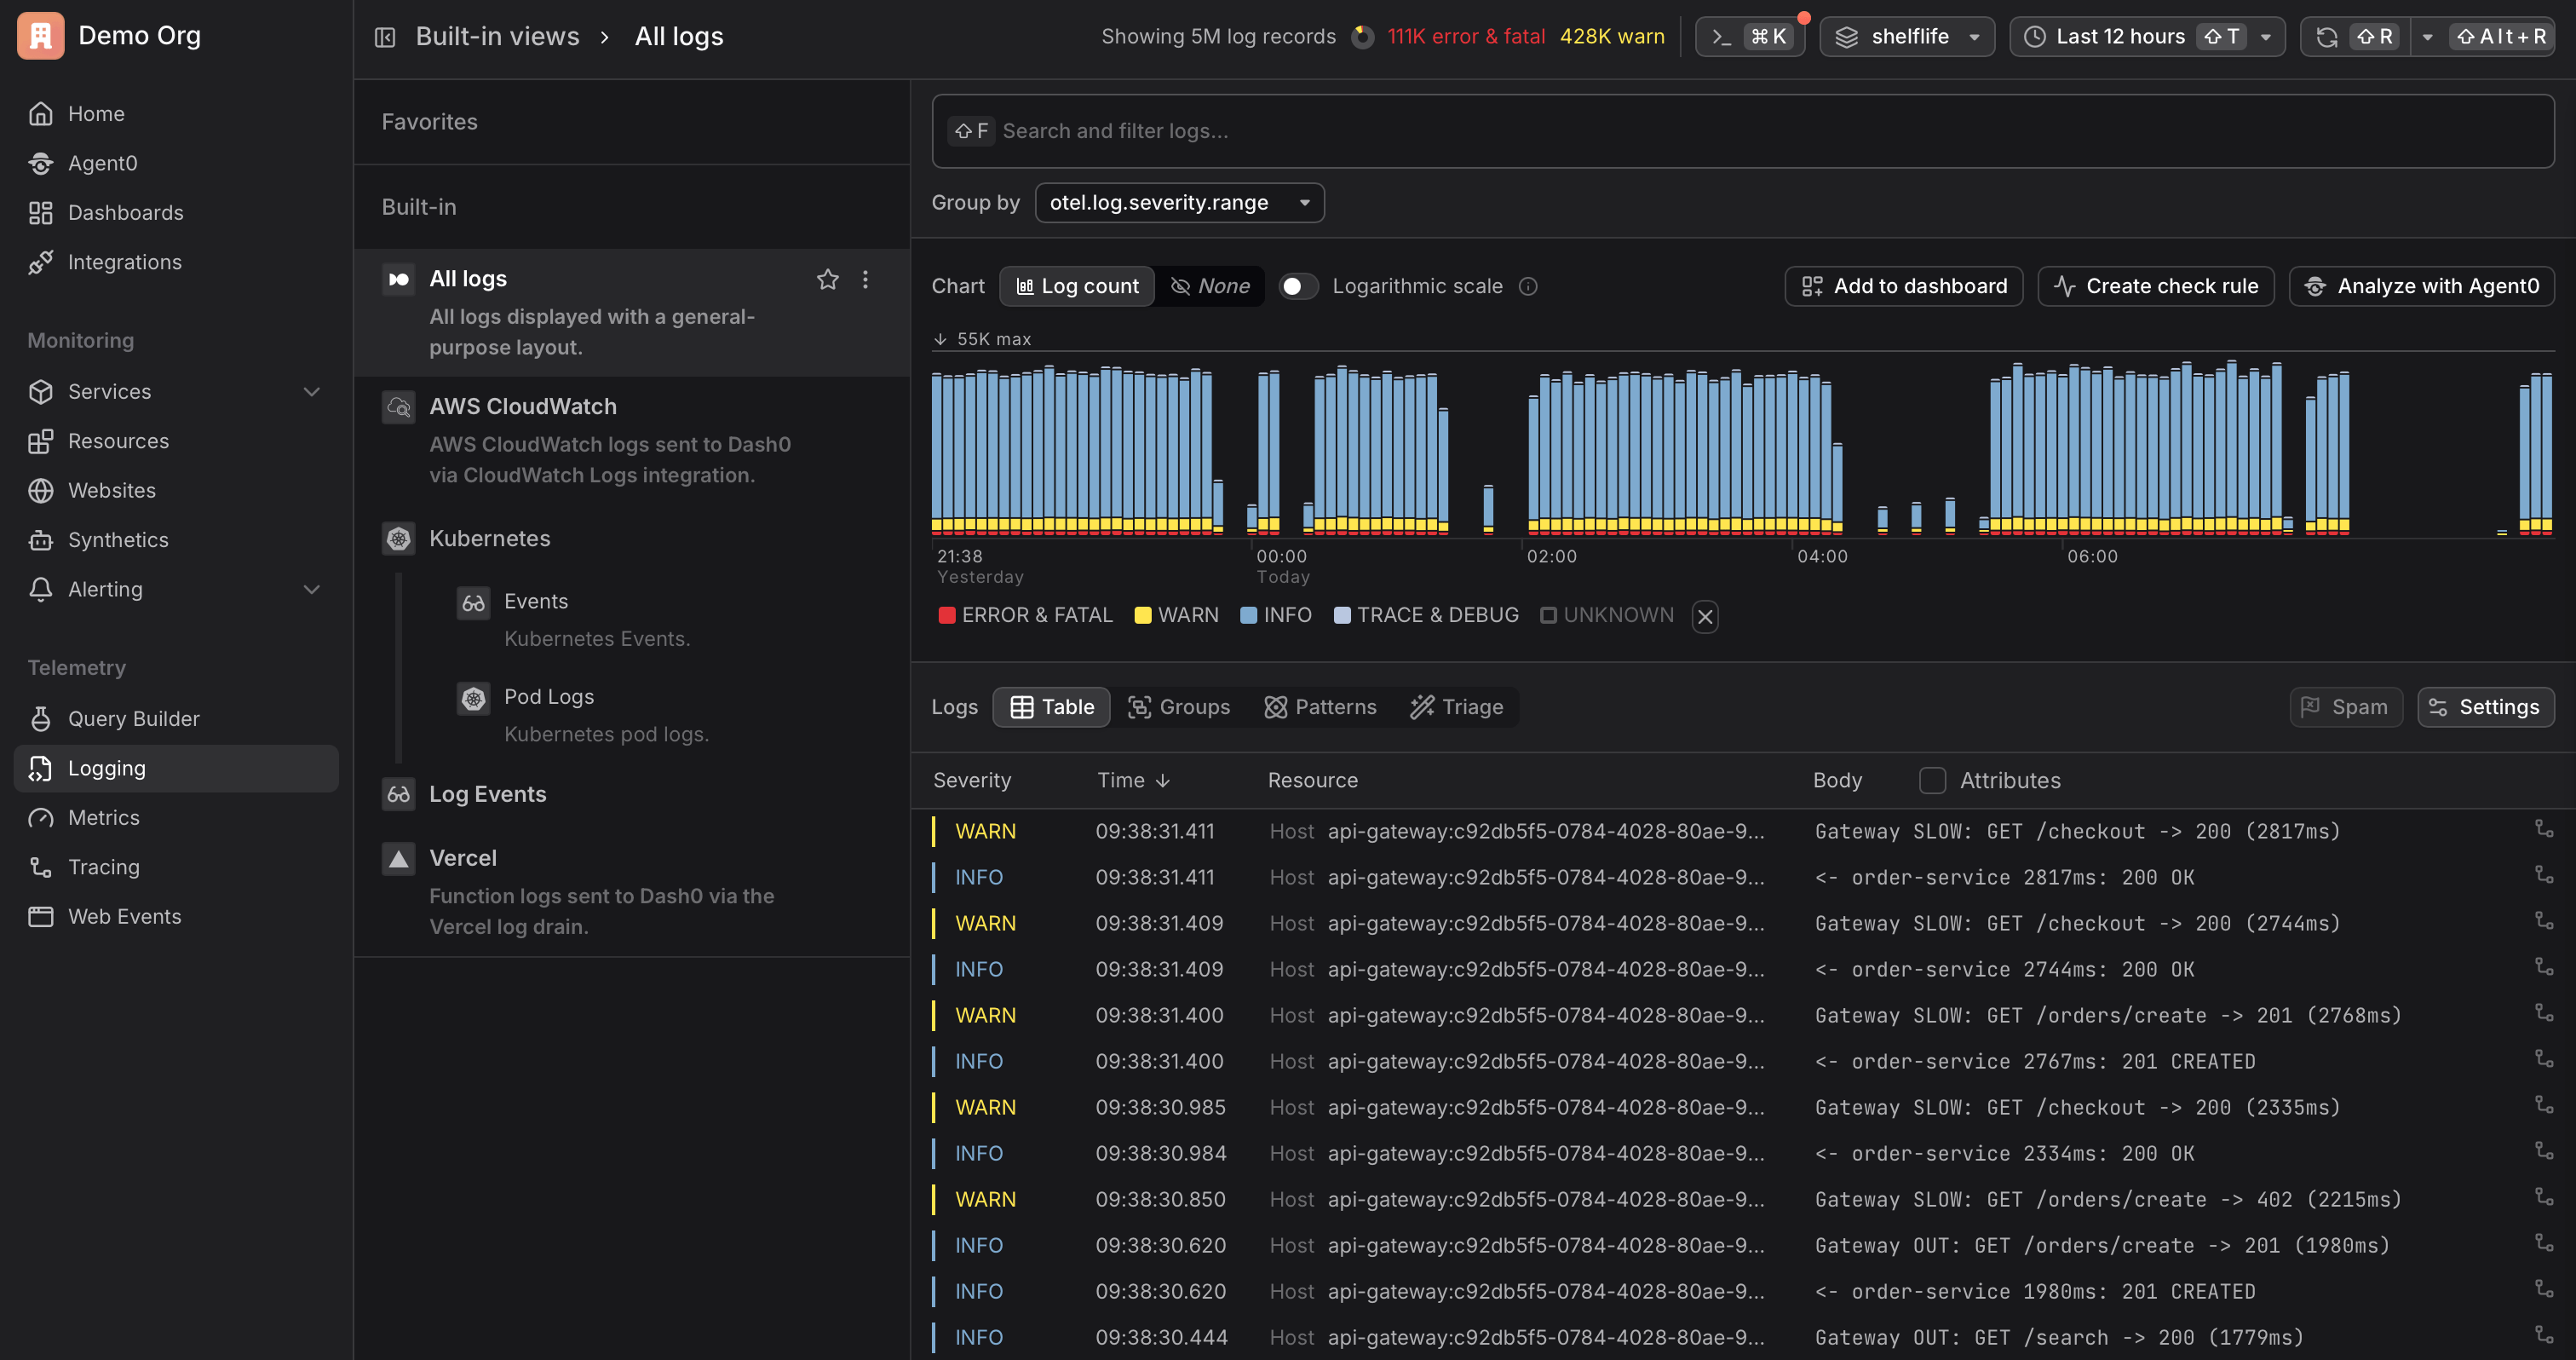
The Log Explorer is the central point to look at logs inside Dash0, allowing you to filter, sort, and analyze them further, and serving as a launch point for creating alerting rules and dashboards.
As with other explorers in Dash0, you have a time picker and filtering functionality to identify the subset of logs of relevance to you.
Severity Chart
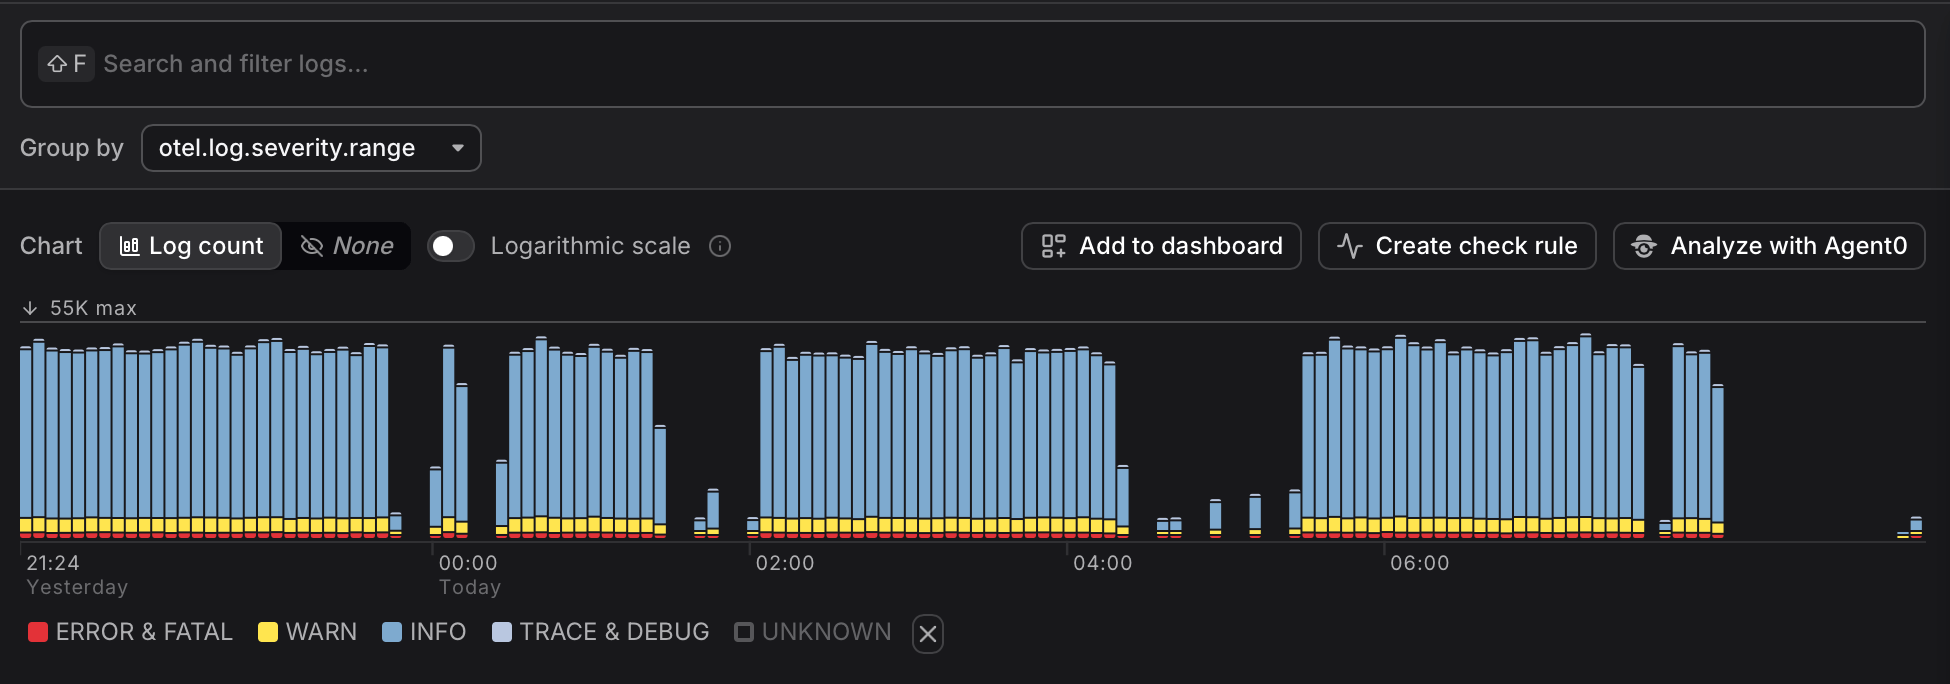
At the top of the Log Explorer, the Severity Chart shows the number of log records available in each time slot.
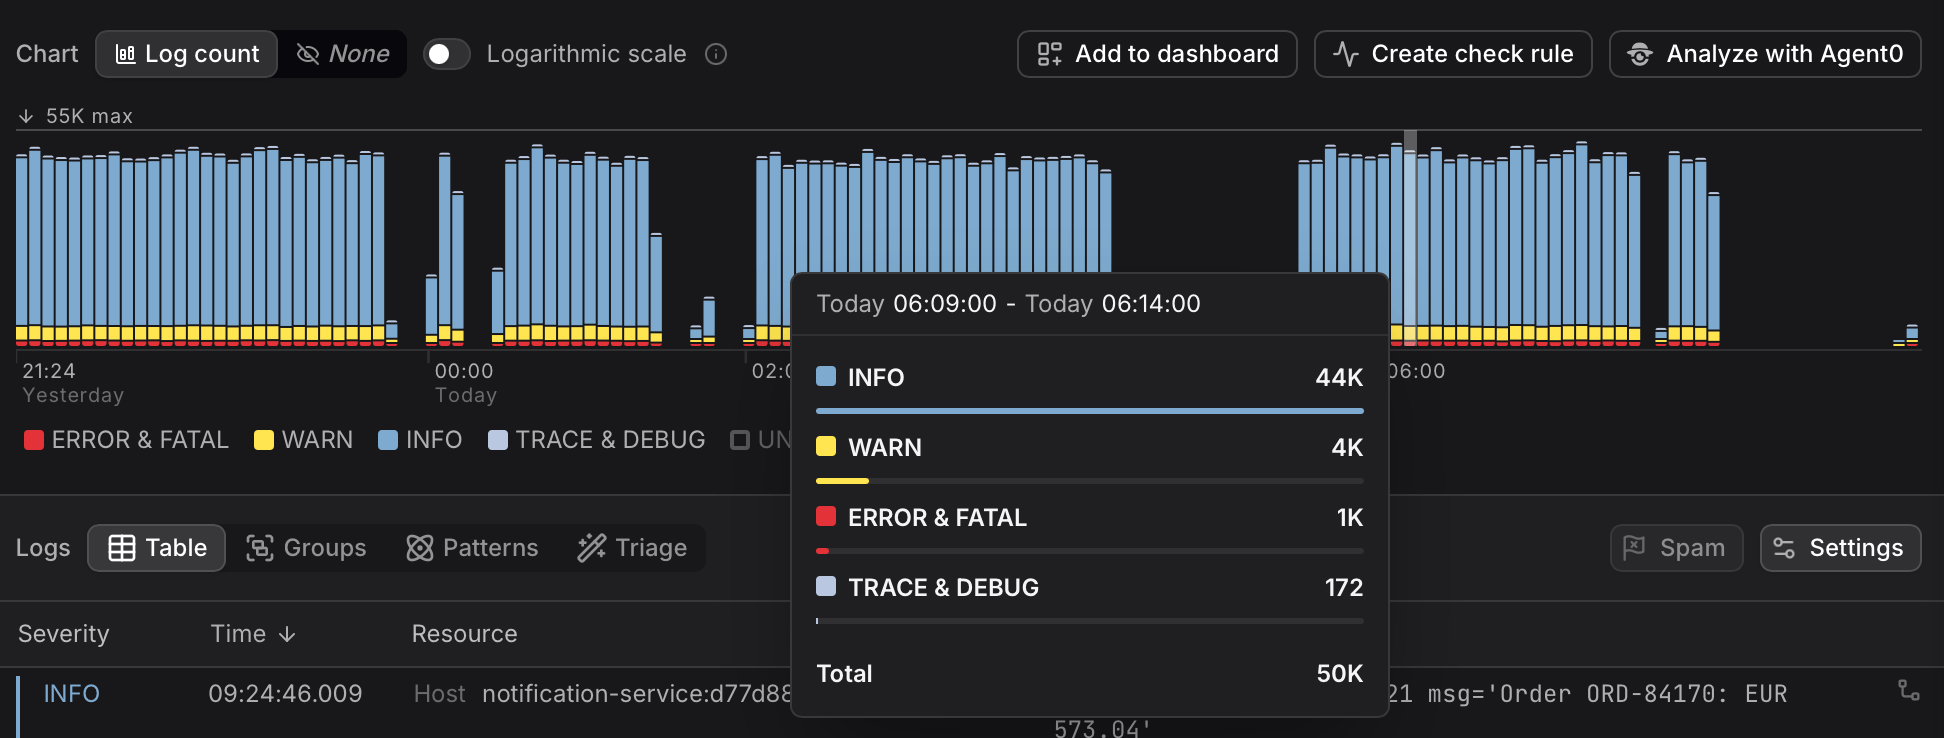
The color of the bar indicates the number of records per severity group, which you can see while hovering over the bars in the chart.
- You can add the current chart view directly to a dashboard. Click Add to dashboard above the severity chart to select an existing dashboard or create a new one. The resulting panel preserves your current filters and grouping, so you can monitor the same log view over time without rebuilding the query.
- You can create a check rule based on your current log view. Click Create check rule above the severity chart to open the check rule editor with the current log query pre-filled as the rule expression. This lets you quickly set up alerting on log patterns you've identified, such as error spikes or unexpected severity changes, without having to manually configure the rule from scratch.
- You can ask Agent0 to analyze your current log view. Click Analyze with Agent0 above the severity chart to open a conversation with Agent0, which automatically picks up your current time range and filters as context. You can ask it to investigate patterns, identify issues, or correlate errors across your logs.
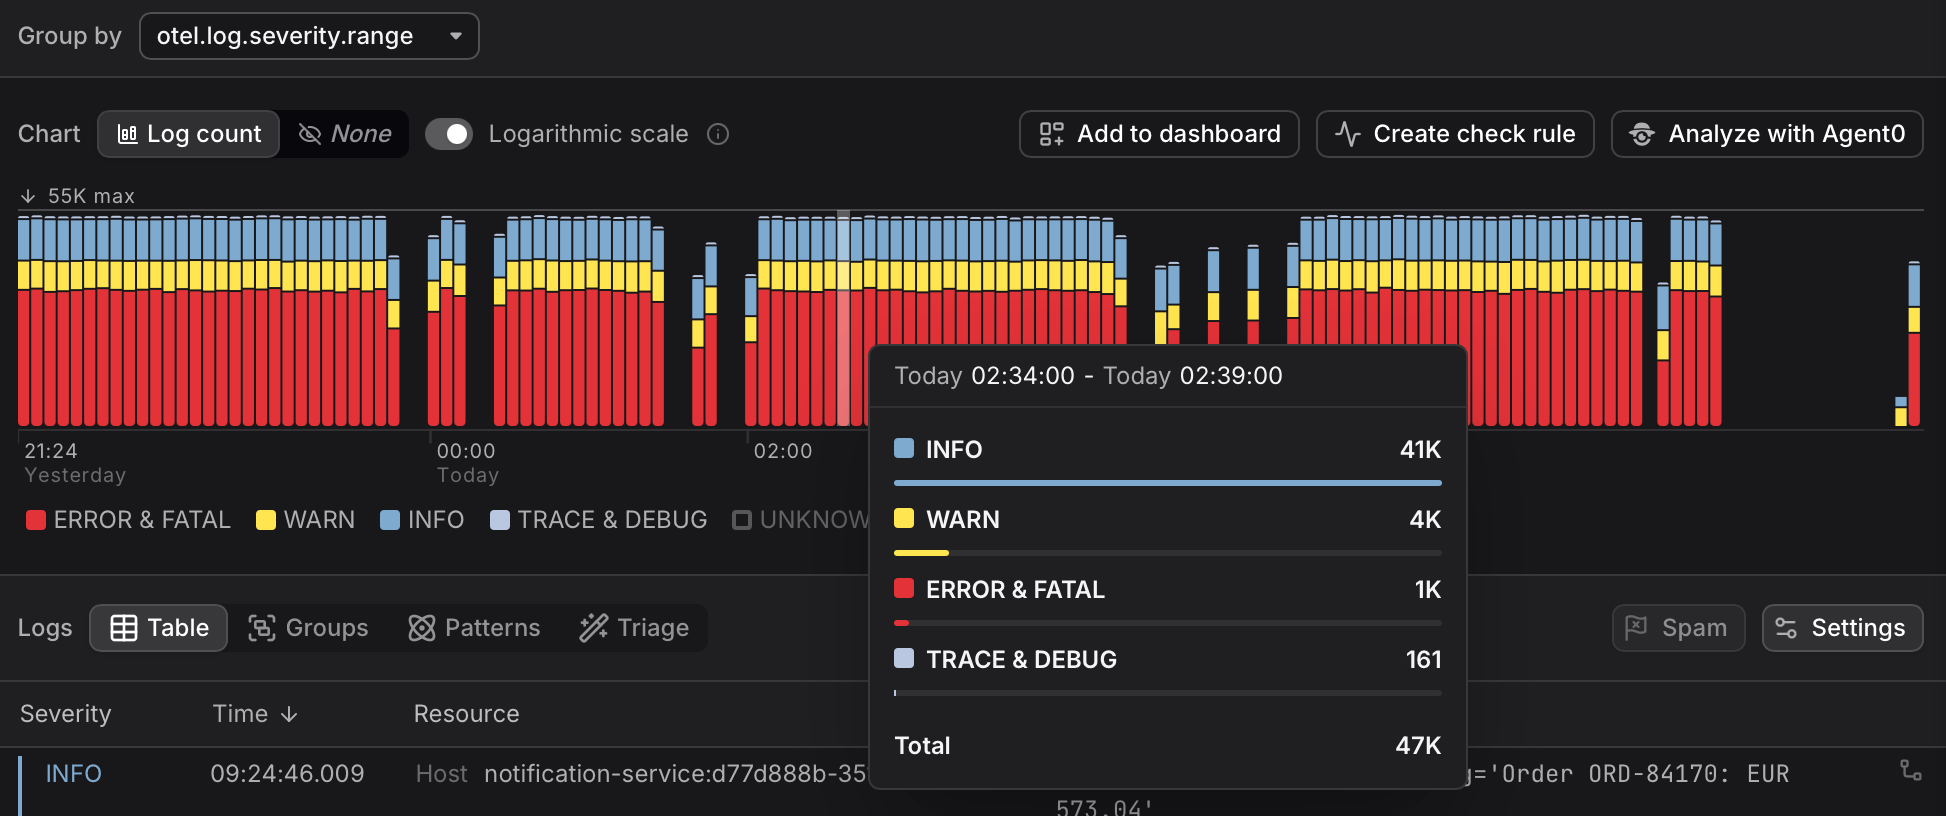
Enabling Logarithmic scale provides a better overview in case the severity groups have a very high difference in value.
Log Record Table
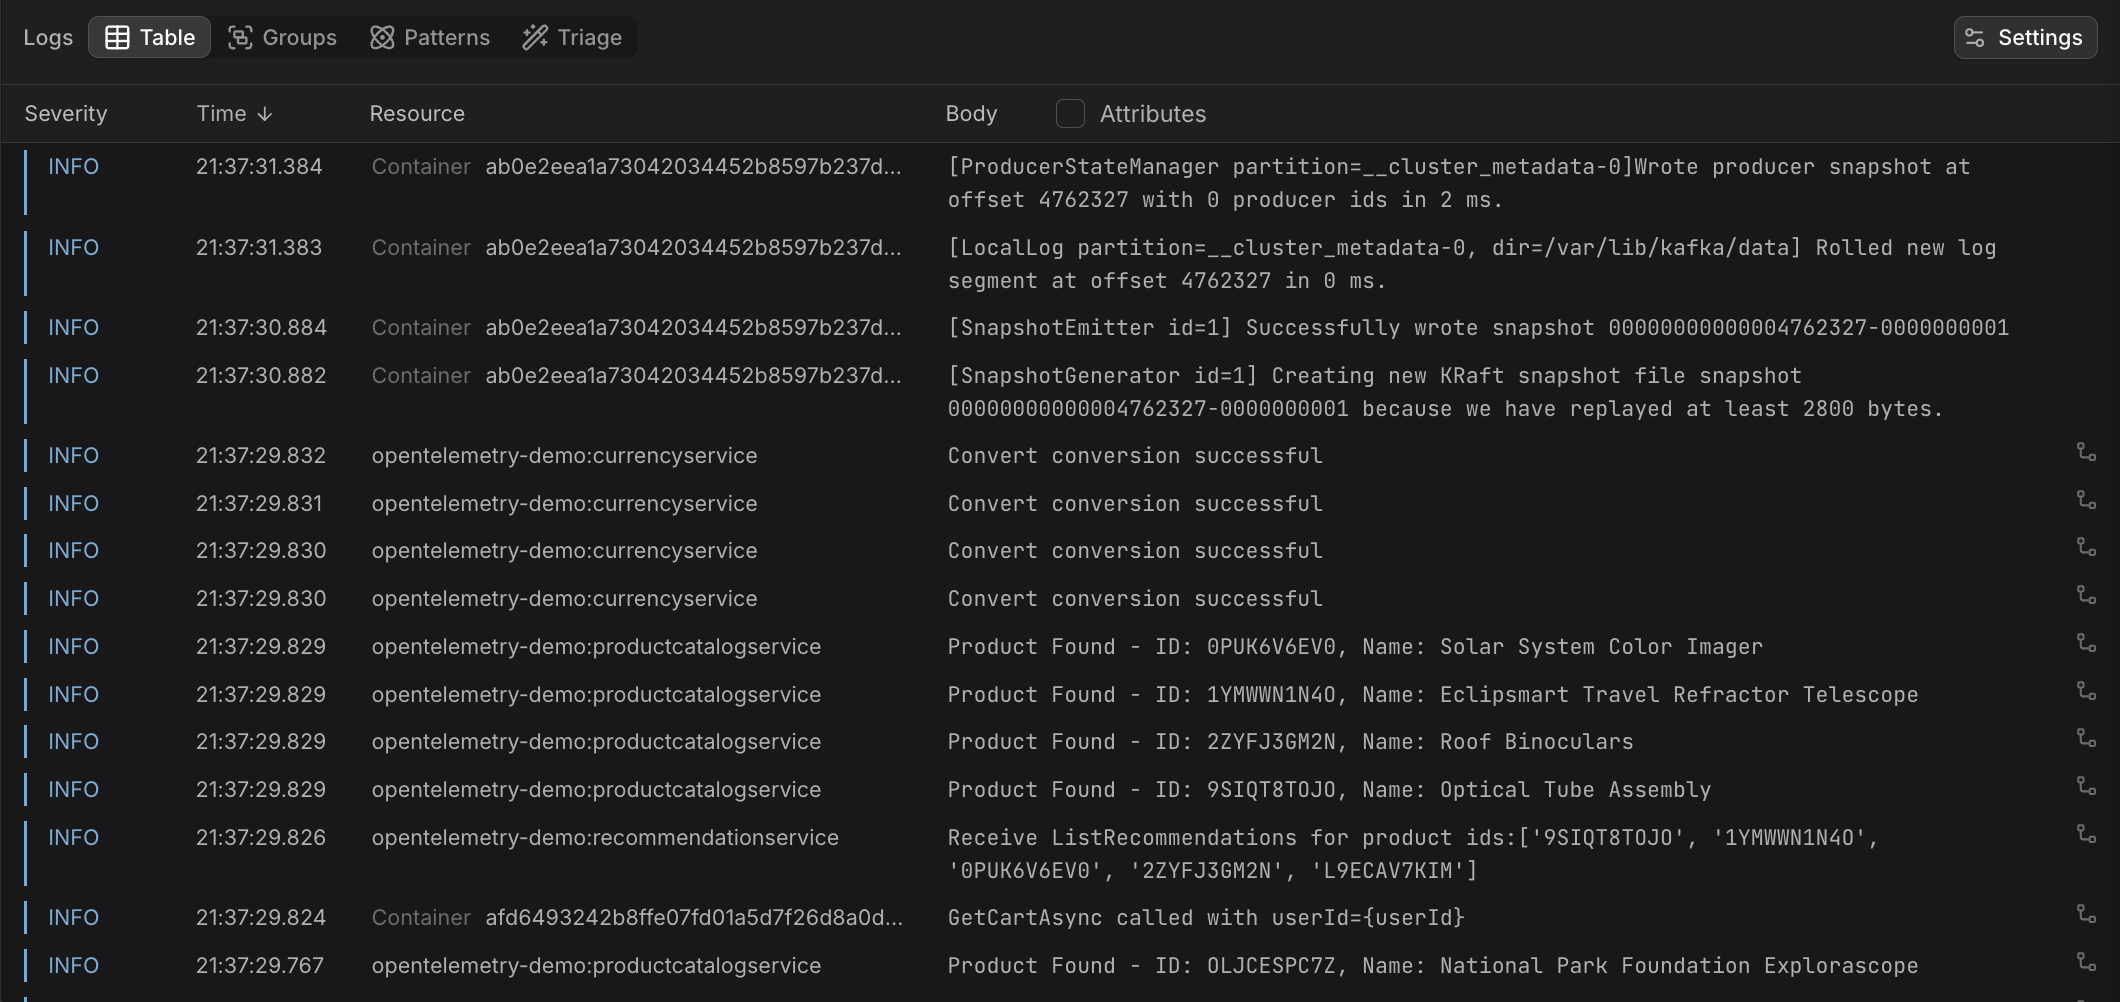
The log record table lists all log records sorted by time.
The table includes the following columns:
- Severity shows the severity level of the log record, grouped into categories like error, warning, info, and debug. The color coding matches the severity chart at the top of the page.
- Time shows when the log record was created.
- Resource identifies where the log record came from, typically showing the service name and instance. This helps you distinguish logs from different services or deployments at a glance.
- Body (+ Attributes) shows the main content of the log record along with any additional attributes. For structured logs, this includes extracted key-value pairs; for unstructured logs, this is the raw message text, potentially enriched by Log AI with inferred patterns and severity.
- Trace Indicator shows whether the log record is associated with a trace. If a trace context is present, you can click through to the corresponding trace to see the log in the context of the full request.
Use the Settings button in the top right of the table to select the columns that are displayed.
Severity Filter
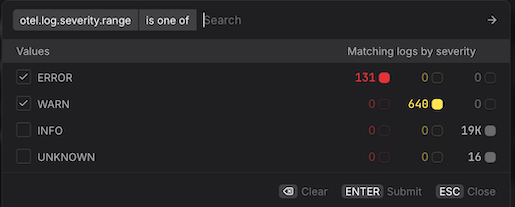
To filter the log table based on severity levels, click the Severity column header. Select the values of relevance to you, and note the number of matching logs per severity level are shown.
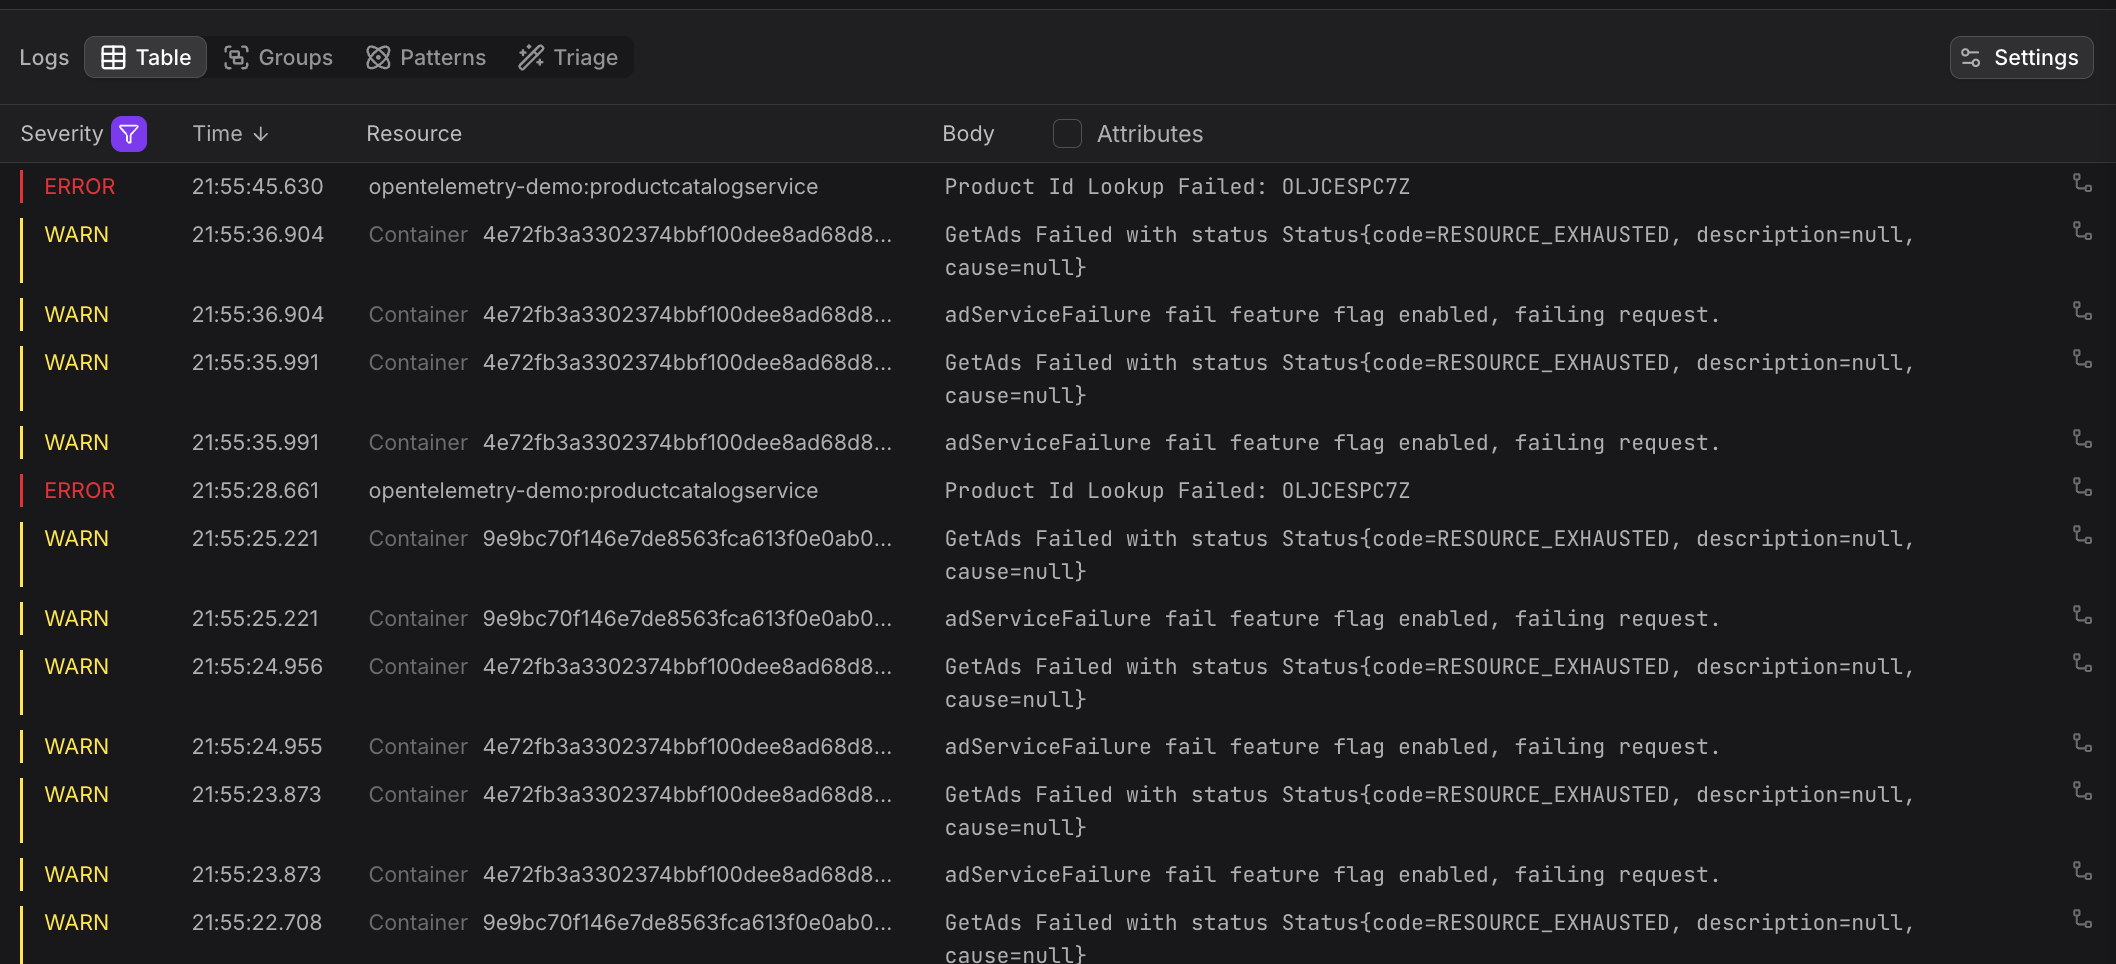
For example, in this way you can filter out log records that are not problematic and focus on those that indicate errors and warnings.
Value Filter
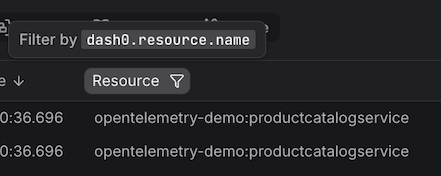
To quickly filter for specific values, hover over the column header to see the quick filter icon. The to-be-applied filter key is visible.
Clicking on the icon opens the quick filter dialog. The selected column has already been selected as a key for the filter.
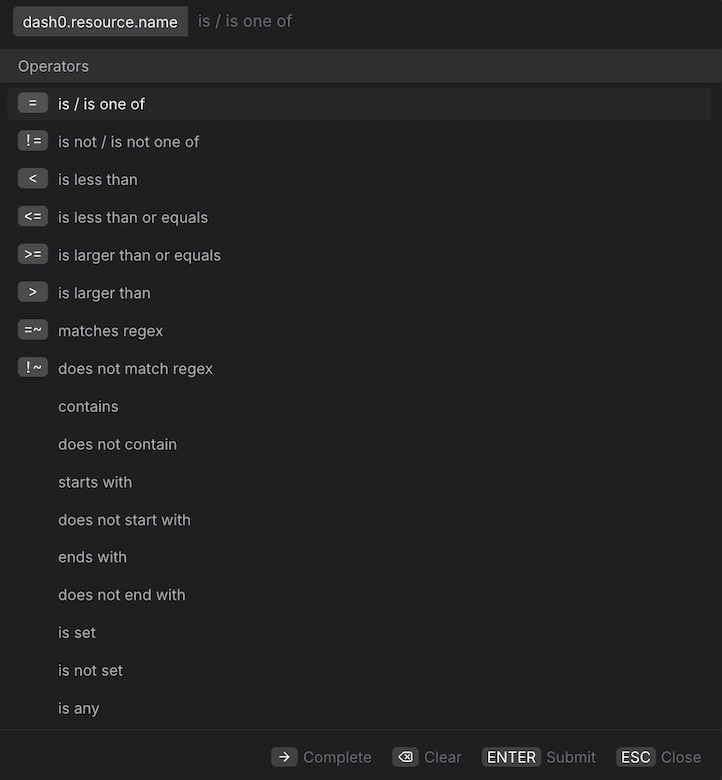
To apply a filter, an operator needs to be selected.
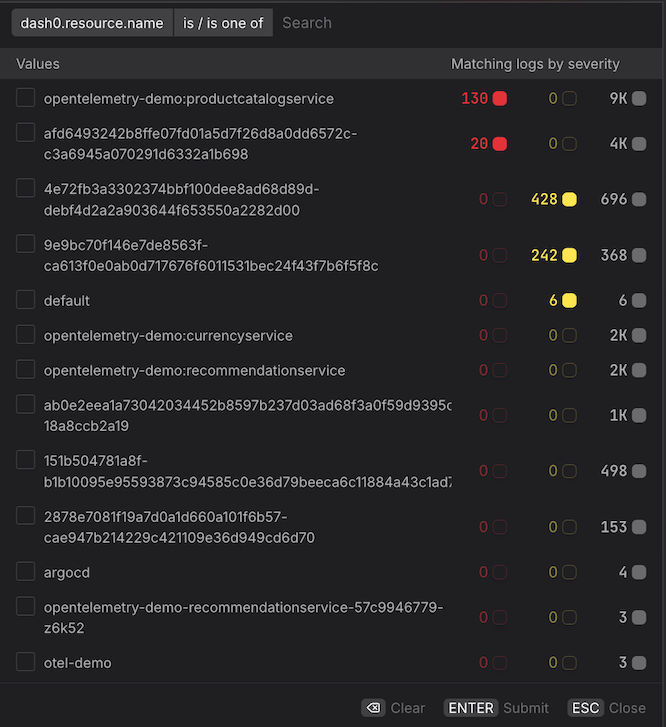
After selecting an operator, one or more values for the filter can be selected.
Hover Filter
To quickly add a filter based on values in the table, hovering over these elements shows a filter symbol with + or - to indicate if a filter should be applied to include the specific values (+) or to exclude them (-).
