Last updated: March 11, 2026
Key Concepts
Overview
This section covers the core architectural components — the specialized agents, the tools they use, and how context flows from your application into the conversation.
Agents
Agent0 uses a multi-agent architecture. When you submit a query, an automatic routing layer (the Generalist) analyzes your request and delegates it to the most appropriate specialized sub-agent. Each agent is optimized for a specific domain:
| Agent | Specialty |
|---|---|
| Seeker | Detects anomalies, pinpoints root causes across traces, logs, and metrics for faster incident triage. |
| Oracle | Explains, translates, and optimizes PromQL queries with precision, eliminating guesswork. |
| Pathfinder | Leads OpenTelemetry instrumentation and service onboarding in minutes, not weeks. |
| Threadweaver | Builds cause-and-effect narratives from traces, revealing bottlenecks and dependencies. |
| Artist | Designs custom dashboards and alert rules to visualize complex systems clearly. |
Tool Invocations
Each agent has access to a set of tools — API calls and data retrieval operations used to build responses.
Every request triggers one or more tool invocations behind the scenes.
These are fully transparent: click any tool call in the response to inspect exactly what the agent did, including the queries it ran and the data it retrieved.
Integrated Context
Agent0 can automatically infer context from wherever you are in the application.
Context is injected in two ways:
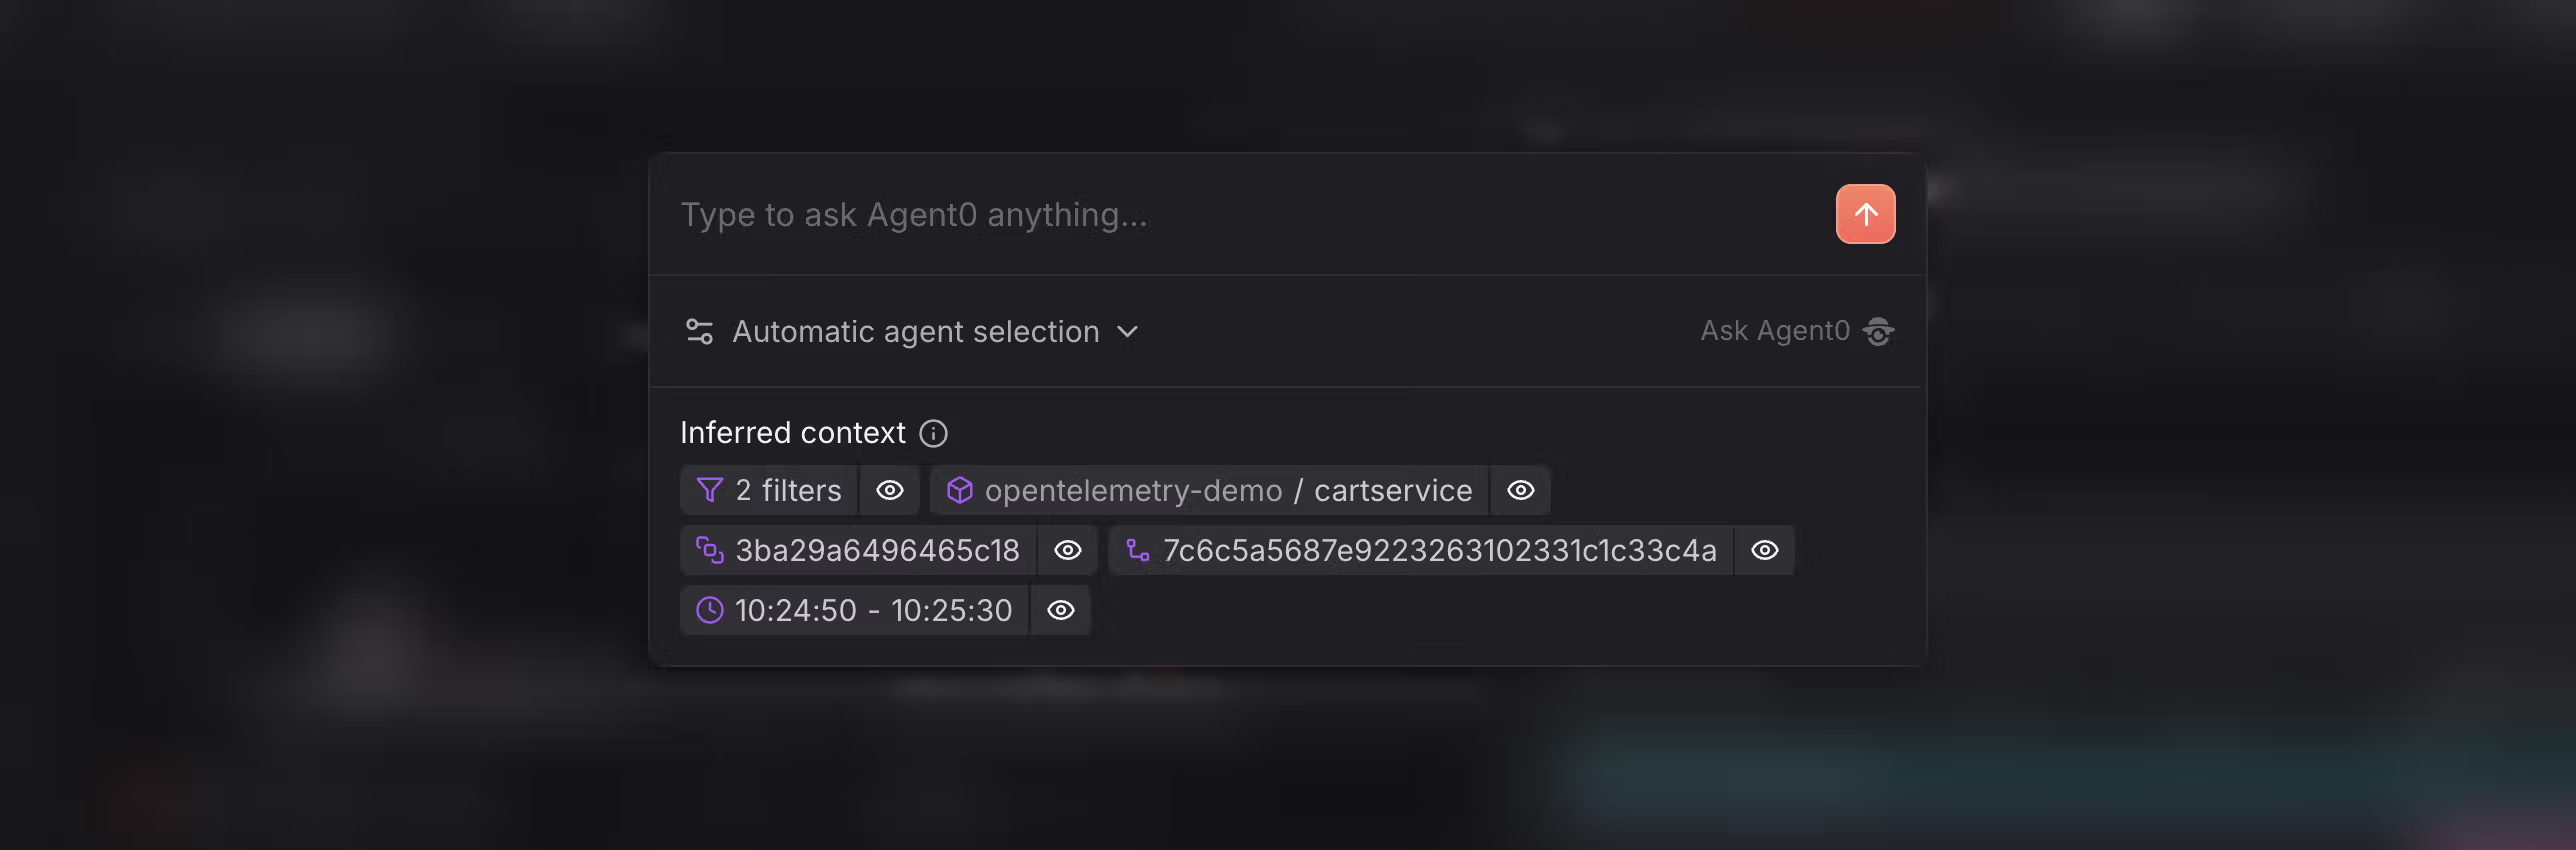
- Button triggers: Certain views (such as alert details) include a dedicated Agent0 button. Clicking it opens a pre-populated prompt with the relevant service, time range, and alert information already loaded.
- Command palette (⌘K / Ctrl+K): From anywhere in the application, open the command palette and type your question. Agent0 captures the context of the current view — the service, time range, and filters — and uses it to inform its response.
Actionable Tags
Responses include actionable tags — clickable elements embedded in the text.
Clicking a tag (such as a service name, trace ID, or metric) opens a contextual side panel with detailed information, allowing you to drill deeper without leaving the conversation.
Integrations
Agent0 can connect to third-party tools to bring external context into investigations. When an integration is active, Agent0 gains access to data from that tool during debugging sessions, without leaving Dash0.
Integrations also work in the other direction: connected tools can invoke Agent0 directly, so investigations can start from wherever your team is already working.
Linear
The Linear integration gives Agent0 read-only access to your Linear workspace: issues, projects, and team structures.
What Agent0 can do with Linear context:
- Search issues across teams and projects
- Retrieve full issue context and metadata
- Reference project ownership and team structure during investigations
You can ask Agent0 things like "What incidents relate to issue ENG-123?" or "Investigate errors affecting the checkout project" and it will combine Linear issue data with live telemetry to form its response.
Invoking Agent0 from Linear:
Mention @Dash0 in any Linear issue or comment. Agent0 reads the issue, runs an investigation using your observability data, and posts results back into the same thread. Each response includes a deep link that reopens the session in Dash0 with organization, dataset, and time range preserved.
Permissions:
Agent0 uses read-only access to Linear. It cannot create issues, modify issue state, or change assignments. It operates with the permissions of the invoking Dash0 user.
For setup instructions, see the Integration Hub or add it directly in Dash0 App