Dashboards
One of Dash0 design principles is having a clean UI that allows quick navigation using context. Sometimes very specific views based on user or use-case requirements are necessary. Dashboards allow you to tailor your view on your Observability information.
Usage
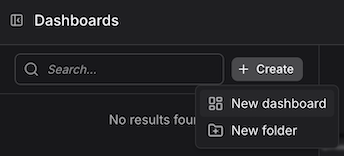
The Dashboard view provides a list of all available dashboards. The search field allows filtering for specific dashboard names. The search pattern is applied to the entire name (regardless of the position of the match).
Clicking on the star next to the search field will filter for starred dashboards.
The arrow AZ icon changes the sorting of the dashboard list.
Clicking on a dashboard name opens the dashboard.
When clicking on the Dashboard name at the top of the dashboard, the dashboard list disappears, providing more space for the selected dashboard. To return to the list, click on the arrow to the left on the top left of the screen.
Creating new dashboards
Create an empty dashboard by selecting "+ Create dashboard".
If you want to specify variables, select "+ Add variable" before creating your first panel.
Using variables
Dash0 has three different ways of using dashboard variables:
Text Variables
In Dash0, dashboarding variables can represent variables containing text that is defined once and can be reused in every panel.
That text can be used as a simple replacement in queries, for example:
spans_total{my_label=~"$variable_name"}
List Variables
Furthermore, variables can be lists of values. These lists can be a static source, a list based on time-series label values, a list of time-series label names, or a result of a PromQL query.
In this case, a filter will be specified by a list instead of a single value:
spans_total{my_label=~"$variable_name"}
Filter Variables
The most powerful capability of variables in Dash0 is their use as filters. A filter variable name can be specified with an attribute key. The specified attribute key is statically set, but the operator, as well as the values to match, can be flexibly defined by the user of a dashboard:
spans_total{$variable_name}
Adding Panels
Dashboards consist of panels in Dash0. Panels contain data using one or more queries specified using PromQL.
When the PromQL query is entered, it is automatically checked for the correct syntax, code completion is applied, and a preview of the result is displayed.
The resulting data of the query can be displayed in a panel using several chart types:
- Time Series Chart
- Stat Chart
- Markdown
- Gauge Chart
- Time Series Table
Data formatting, visual style, and thresholds can be configured.
Saving Dashboards
Once a dashboard has been created, it is persisted using the "Save" button at the top of the page.
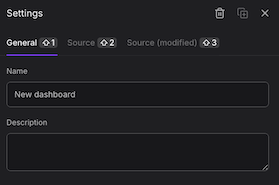
Dashboard Settings
Every dashboard has settings that include:
- dashboard name
- dashboard description
- permissions for admins
- permissions for members
Further, permissions for specific users can be validated in the settings, and the dashboard's raw definition (source) is visible.
Dashboards can be deleted or cloned in the settings.
Last updated: September 1, 2024