Last updated: June 19, 2026
Synthetic Metrics
Dash0 provides synthetic metrics to help users analyze logs, spans, and related telemetry data dynamically without requiring predefined metric aggregations.
Synthetic metrics are calculated on-the-fly, based on other telemetry ingested by Dash0. Synthetic metrics are not charged on your bill.
Synthetic metrics can query only data that exists in your organization. Spans, logs and metric data points that have expired their retention period cannot be queried via synthetic metrics.
Key Takeaways / Use Cases
- Use synthetic metrics to count and alert logs, spans, span events, metric data points and resources dynamically.
- Avoid upfront metric definitions, making observability more flexible.
- No additional charges on telemetry already sent to Dash0.
- Enable advanced query-building for performance monitoring, anomaly detection, and billing analysis.
Retention and Availability
Synthetic metrics are calculated on the fly and rely on retained logs and spans:
- Logs, spans and span events have a 30-day retention period.
- Metric data points have a 13-month retention period.
Cost
Synthetic metrics do not incur extra costs. In Dash0's perspective, you already pay for them by sending the raw telemetry (spans, span events, log records, metric data points) the synthetic metrics are calculated on.
Available Metrics
Dash0 provides the following synthetic metrics, categorized into counters, gauges, and histograms.
Counters (Track Occurrences Over Time)
Note: Dash0 counters behave differently from traditional metrics. They always start from zero regardless of the query timeframe, and they only represent the increase over time. This ensures that the counters provide a clear view of trends and changes without retaining absolute counts.
| Metric | Source | Description |
|---|---|---|
dash0.logs | Log records | Counts log occurrences over time, supporting filtering and grouping by log and resource attributes. |
dash0.spans | Spans (traces) | Counts spans over time, supporting filtering and grouping by span and resource attributes. |
dash0.span.events | Span events (structured data recorded within a span) | Counts the number of span events in traces, supporting filtering and grouping by span event, span and resource attributes. |
Gauges (Track State Over Time)
| Metric | Source | Description |
|---|---|---|
dash0.resources | Telemetry metadata (resources) | Tracks the presence of resources (e.g., hosts, services, pods) sending telemetry. Supports filtering and grouping by resource attributes. Tracks the existence of resources, not a count. A resource disappears from the metric if it stops sending telemetry. |
dash0.metrics.datapoints | Ingested metric data points | Tracks the count of metric data points arriving in Dash0. Supports filtering and grouping by metric data point and resource attributes. |
Histograms (Track Distributions Over Time)
| Metric | Source | Description |
|---|---|---|
dash0.spans.duration | Span durations (timings) | Represents the distribution of span durations as a histogram, allowing detailed analysis of latency trends. Supports filtering and grouping by span and resource attributes. |
Additional Metrics
dash0.check.* (Check Rules)
| Metric | Type | Description |
|---|---|---|
dash0.check.enablement_conditions.value | GAUGE | Encodes whether a check's enablement conditions passed (1 = passed, 0 = failed). When a check has multiple enablement conditions, this metric emits one data point per condition, with an additional dash0.enablement_condition.index attribute (1-based: 1, 2, 3, ...) to identify which condition it relates to. |
dash0.check.evaluation.outcome | GAUGE | Encodes the outcome of a check's evaluation as a numeric enum. See Enum Values for possible values. |
dash0.check.evaluation.value | GAUGE | Encodes the value returned by the check's evaluation. |
dash0.check.status | GAUGE | Represents the check's current state as a numeric enum. See Enum Values for possible values. |
dash0.check.threshold.critical | GAUGE | Represents the critical threshold for evaluation. |
dash0.check.threshold.degraded | GAUGE | Represents the degraded threshold for evaluation. |
dash0.issues (Failed Checks Tracking)
| Metric | Type | Description |
|---|---|---|
dash0.issue.status | GAUGE | Encodes the issue status as a numeric enum. See Enum Values for possible values. |
Enum Values Reference
Several Dash0 metrics use numeric or string enum values to represent states. Understanding these values is essential for querying, filtering, and alerting.
dash0.check.status Enum Values
The dash0.check.status metric encodes the current state of a check rule as a numeric gauge value.
| Numeric Value | Status Name | Description |
|---|---|---|
-Inf | inactive | The check is inactive because enablement conditions are not met or the check is disabled. |
0 | healthy | The check is passing. No thresholds have been exceeded. |
0.5 | pending | The check is within its trigger grace period. The threshold has been exceeded, but not long enough to transition to degraded or critical state. |
1 | degraded | The check has exceeded the degraded threshold and the grace period has elapsed. |
2 | critical | The check has exceeded the critical threshold and the grace period has elapsed. |
Example query to count checks by status:
1234567891011121314# Count critical checkscount({otel_metric_name="dash0.check.status"} == 2)# Count degraded checkscount({otel_metric_name="dash0.check.status"} == 1)# Count pending checkscount({otel_metric_name="dash0.check.status"} == 0.5)# Count healthy checkscount({otel_metric_name="dash0.check.status"} == 0)# Count inactive checkscount({otel_metric_name="dash0.check.status"} == -Inf)
dash0.check.evaluation.outcome Enum Values
The dash0.check.evaluation.outcome metric encodes the outcome of a check's most recent evaluation. This differs from dash0.check.status as it represents the immediate evaluation result, not the state after grace periods.
| Numeric Value | Outcome Name | Description |
|---|---|---|
-Inf | inactive | The check evaluation did not run because enablement conditions were not met. |
0 | healthy | The evaluation result did not exceed any threshold. |
1 | degraded | The evaluation result exceeded the degraded threshold but not the critical threshold. |
2 | critical | The evaluation result exceeded the critical threshold. |
The dash0.check.evaluation.outcome metric does not include a pending state. The pending state only exists in dash0.check.status and represents the grace period between when a threshold is first exceeded and when the check transitions to degraded or critical.
Example queries:
12345678# Count critical evaluation outcomescount({otel_metric_name="dash0.check.evaluation.outcome"} == 2)# Count degraded evaluation outcomescount({otel_metric_name="dash0.check.evaluation.outcome"} == 1)# Count healthy evaluationscount({otel_metric_name="dash0.check.evaluation.outcome"} == 0)
dash0.issue.status Enum Values
The dash0.issue.status metric encodes the status of issues created when checks fail.
| Numeric Value | Status Name | Description |
|---|---|---|
1.0 | degraded | The issue represents one or more checks in degraded state. |
2.0 | critical | The issue represents one or more checks in critical state. |
Issues only exist for checks that have failed. There are no healthy, pending, or inactive issue statuses.
Example query to count issues by severity:
12345# Count critical issuescount({otel_metric_name="dash0.issue.status"} == 2)# Count degraded issuescount({otel_metric_name="dash0.issue.status"} == 1)
dash0.failed_check.max_status Attribute Values
The dash0.failed_check.max_status attribute is used for routing notifications based on the highest severity a failed check has reached. This is an attribute on notifications, not a metric.
| Value | Description |
|---|---|
degraded | The check has reached at least degraded status but never critical. |
critical | The check has reached critical status at some point during its failure cycle. |
Use case: Route critical alerts to PagerDuty while sending all alerts to Slack.
1Notification Channel Filter: dash0.failed_check.max_status = critical
Once a check reaches critical status, all subsequent notifications (including resolution notifications) will have dash0.failed_check.max_status=critical, even if the check temporarily returns to degraded state. This ensures resolution notifications reach all channels that received alerts.
dash0.synthetic_check.outcome Attribute Values
The dash0.synthetic_check.outcome attribute indicates the result of a synthetic check run. It is derived from the assertion outcome of a synthetic check span. Unlike dash0.check.evaluation.outcome, it has no Inactive state because spans only exist for runs that actually executed.
| Value | Description |
|---|---|
Healthy | All critical assertions passed and no degraded assertions failed. |
Degraded | All critical assertions passed but one or more degraded assertions failed (typically latency thresholds). |
Critical | One or more critical assertions failed. |
Example queries:
123456789101112131415# Count failed synthetic check runs (critical)sum(increase({otel_metric_name="dash0.synthetic_check.runs", dash0_synthetic_check_outcome="Critical"}[5m]))# Count all non-healthy check runs (degraded + critical)sum(increase({otel_metric_name="dash0.synthetic_check.runs", dash0_synthetic_check_outcome!="Healthy"}[5m]))# Calculate synthetic check success ratesum(increase({otel_metric_name="dash0.synthetic_check.runs", dash0_synthetic_check_outcome="Healthy"}[5m]))/sum(increase({otel_metric_name="dash0.synthetic_check.runs"}[5m]))# Compare healthy vs degraded vs critical outcomessum by (dash0_synthetic_check_outcome) (increase({otel_metric_name="dash0.synthetic_check.runs"}[5m]))
dash0.web.event.status.code Attribute Values
The dash0.web.event.status.code attribute indicates the status of web events captured from browser telemetry.
| Value | Description |
|---|---|
ERROR | The web event completed with an error status (e.g., JavaScript error, failed HTTP request). |
UNSET | The web event completed successfully or no explicit status was recorded. |
Example queries:
12345678910# Count error events (use dash0.web.errors for error-only queries)sum(increase({otel_metric_name="dash0.web.errors"}[5m]))# Count successful eventssum(increase({otel_metric_name="dash0.web.events", dash0_web_event_status_code="UNSET"}[5m]))# Compare error vs successful events side-by-sidesum by (dash0_web_event_status_code) (increase({otel_metric_name="dash0.web.events"}[5m]))
dash0.trace.origin.type Attribute Values
The dash0.trace.origin.type attribute identifies the origin type of a trace, allowing you to filter traces by their source.
| Value | Description |
|---|---|
SYNTHETIC_CHECK | The trace originated from a Dash0 synthetic monitoring check. Use this to filter for or exclude synthetic traffic from your analysis. |
WEB | The trace originated from a browser / RUM (Real User Monitoring) session captured by the Dash0 Web SDK. |
UNKNOWN | The trace's origin could not be classified (default fallback). |
Example queries:
123456789# Filter out synthetic check traces to analyze only real user trafficsum by (service_name) (rate({otel_metric_name="dash0.spans", dash0_trace_origin_type!="SYNTHETIC_CHECK"}[5m]))# Analyze only synthetic check tracessum by (service_name) (rate({otel_metric_name="dash0.spans", dash0_trace_origin_type="SYNTHETIC_CHECK"}[5m]))
When analyzing production performance, consider filtering out dash0.trace.origin.type="SYNTHETIC_CHECK" to exclude synthetic monitoring traffic from your metrics. This ensures your dashboards and alerts reflect real user behavior only.
How-To Guide
Querying Synthetic Metrics in Dash0
- Navigate to the Dash0 Query Builder.
- Select the synthetic metric you want to analyze.
- Apply filters and grouping as needed.
- Adjust time ranges to explore historical trends.
- Execute the query to visualize results.
Examples
Monitor Performance
P99 Duration filtered by service.name=frontend:
Example query:
1histogram_quantile(0.99, sum by(service_namespace, service_name) (rate({otel_metric_name = "dash0.spans.duration", service_name = "frontend", service_namespace = "opentelemetry-demo", dash0_operation_name != ""}[$__interval]))) * 1000
Troubleshoot Anomalies
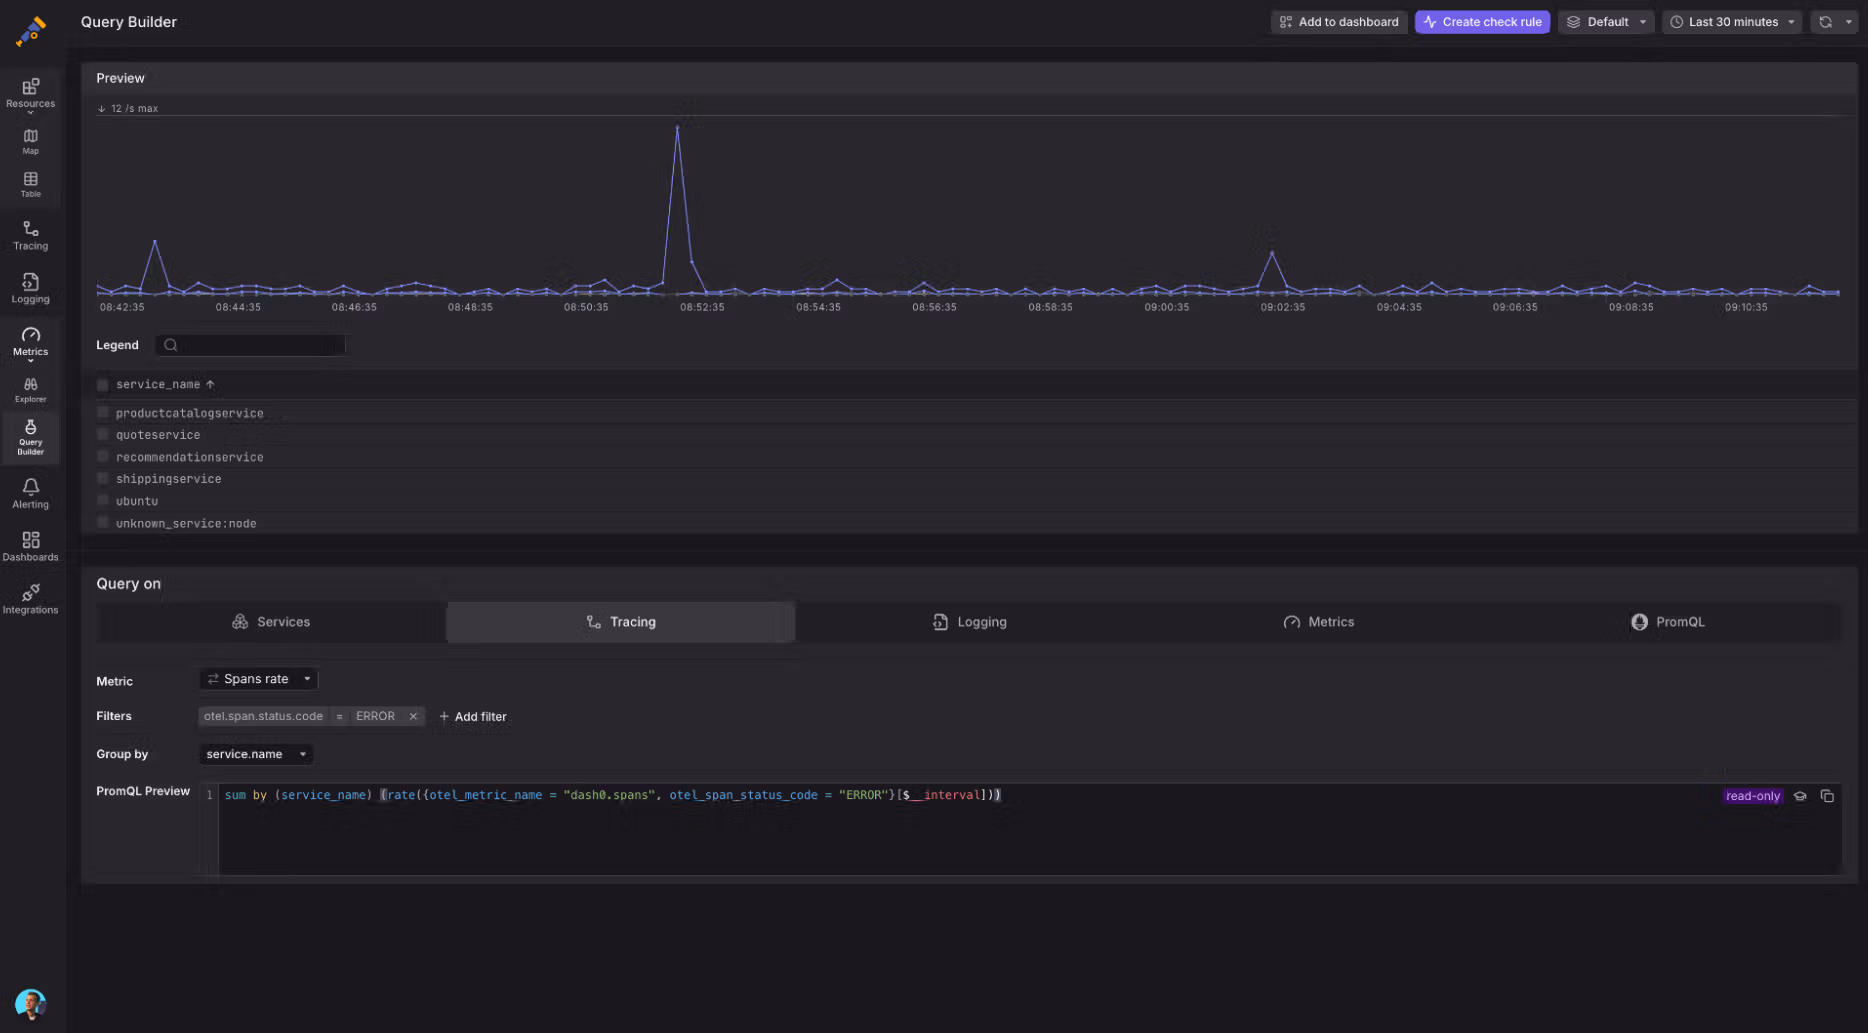
Span Rate using dash0.spans filtered by the otel.span.status_code and grouped by service_name:
Example query:
1sum by (service_name) (rate({otel_metric_name = "dash0.spans", otel_span_status_code = "ERROR"}[$__interval]))
Log Error Rate Check Rule that calculates the rate of logs with severity=ERROR grouped by service.name:
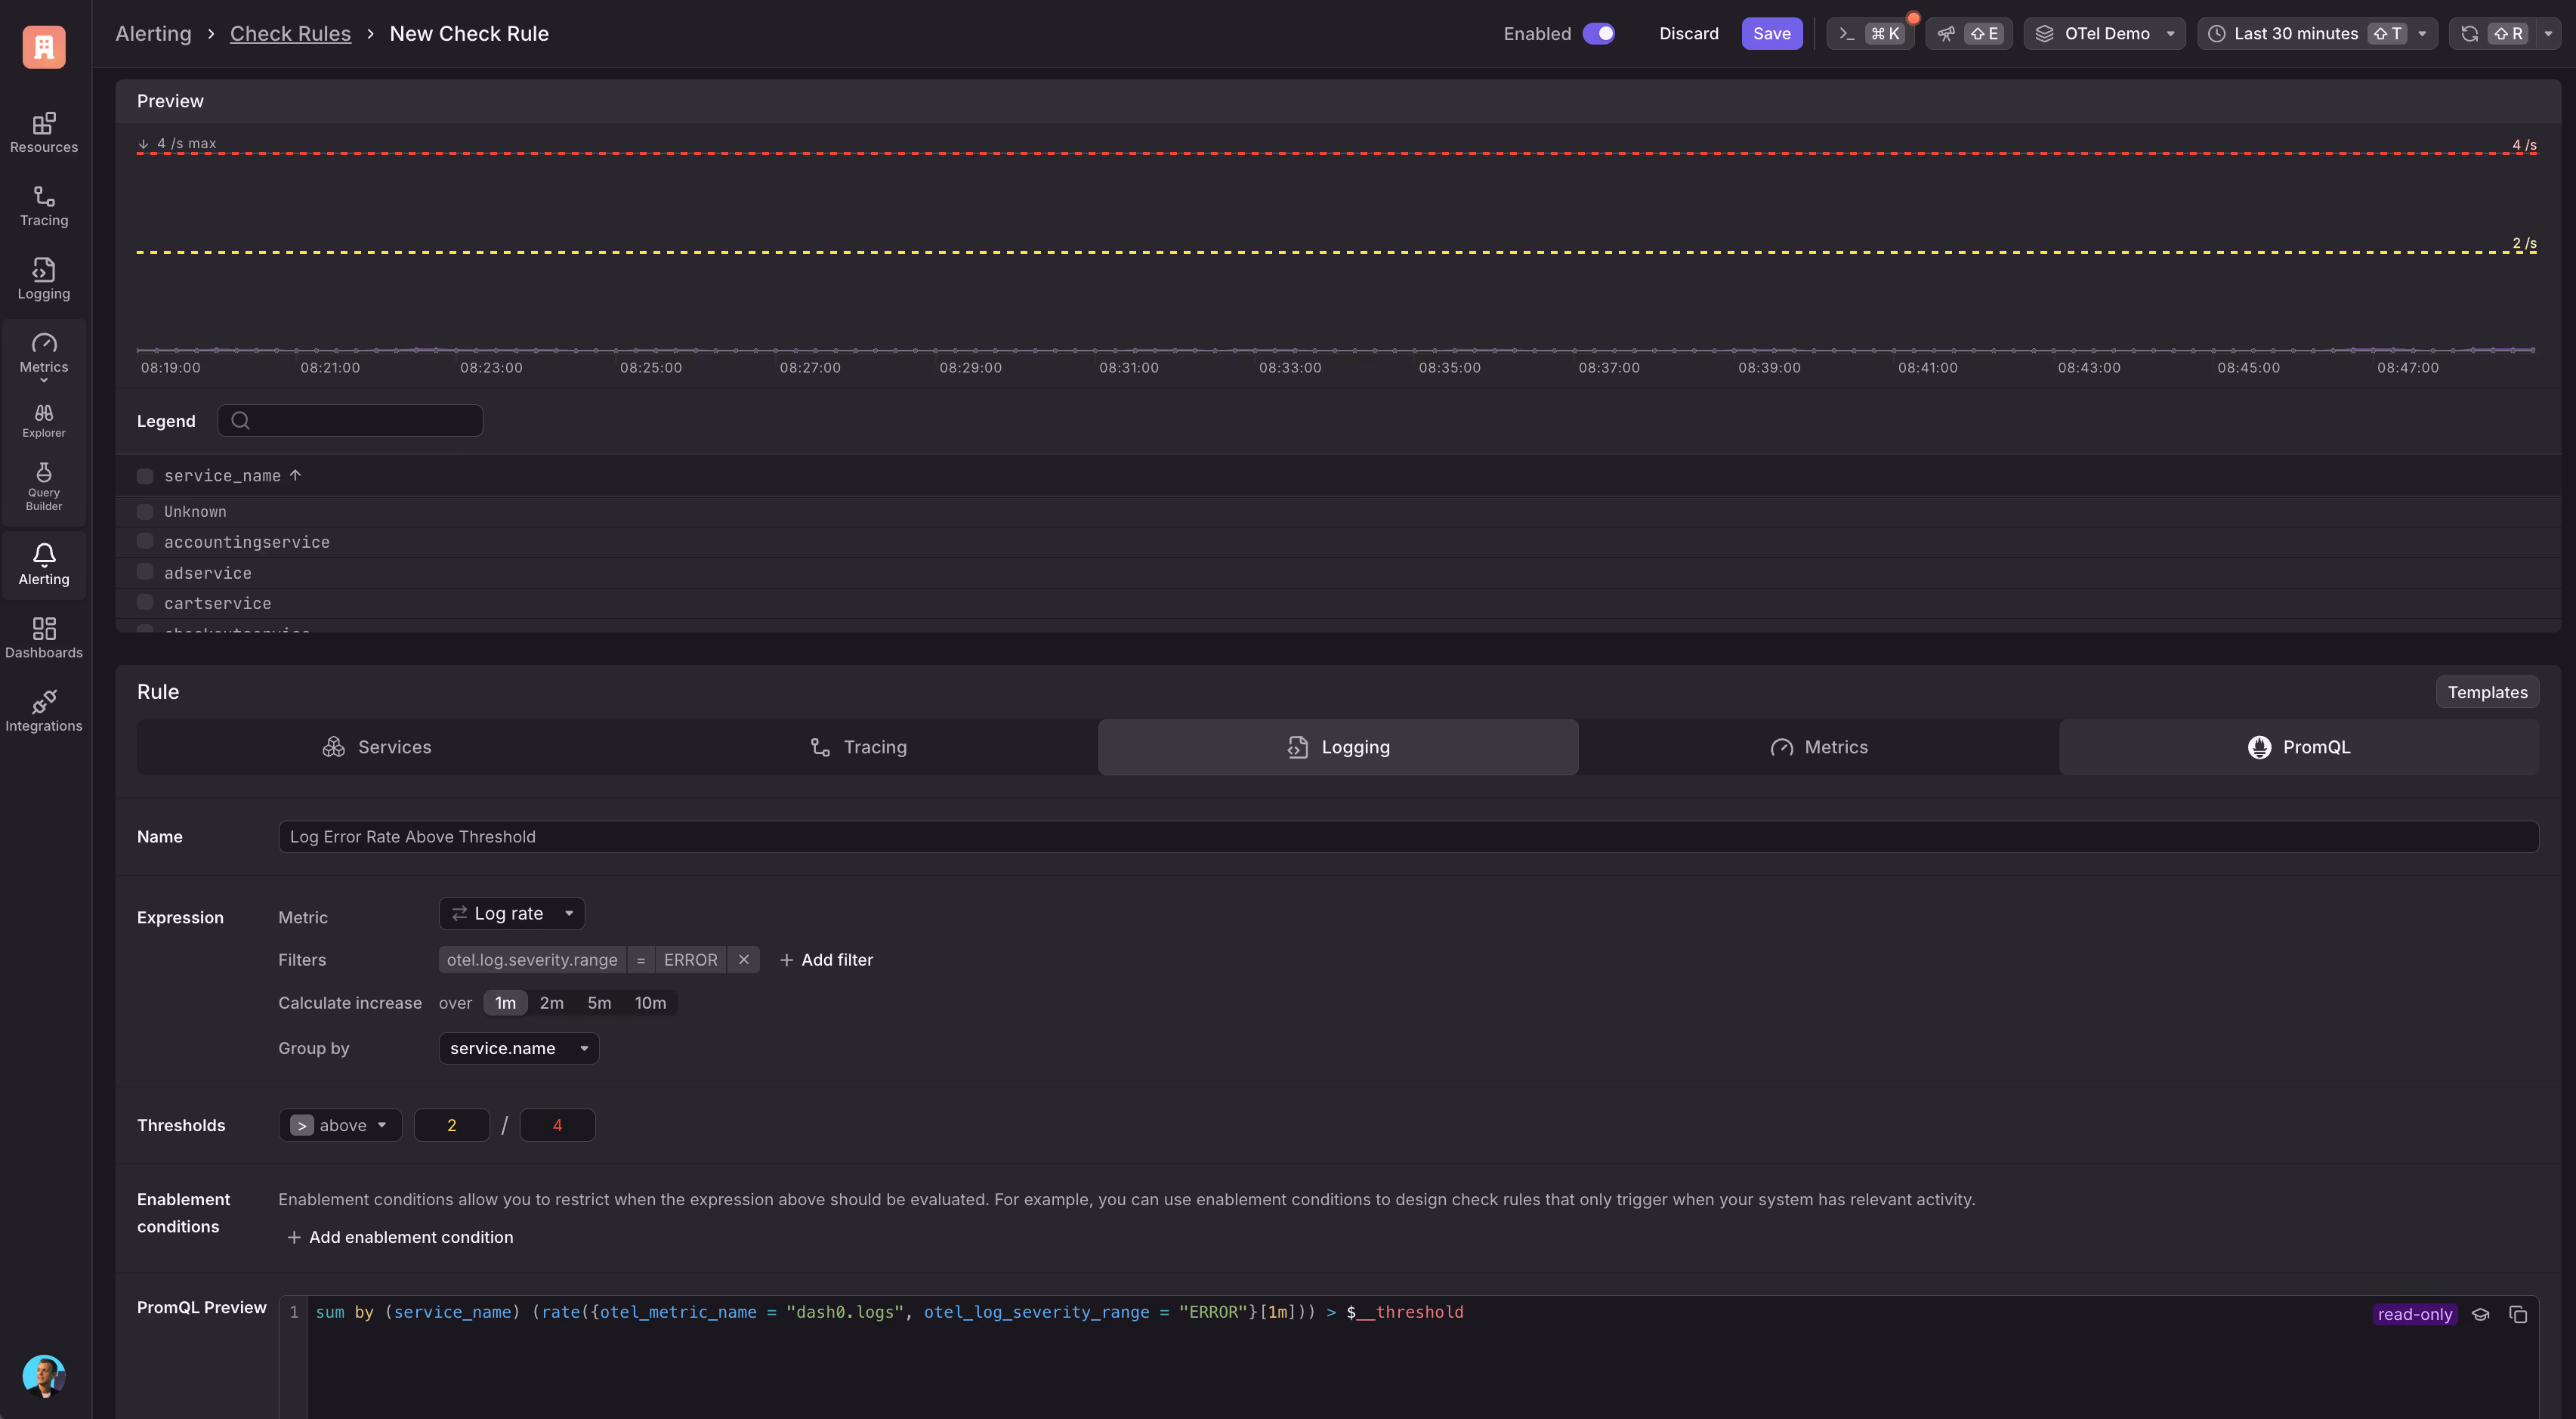
Example query:
1sum by (service_name) (rate({otel_metric_name = "dash0.logs", otel_log_severity_range = "ERROR"}[1m])) > $__threshold
Grouping Resources
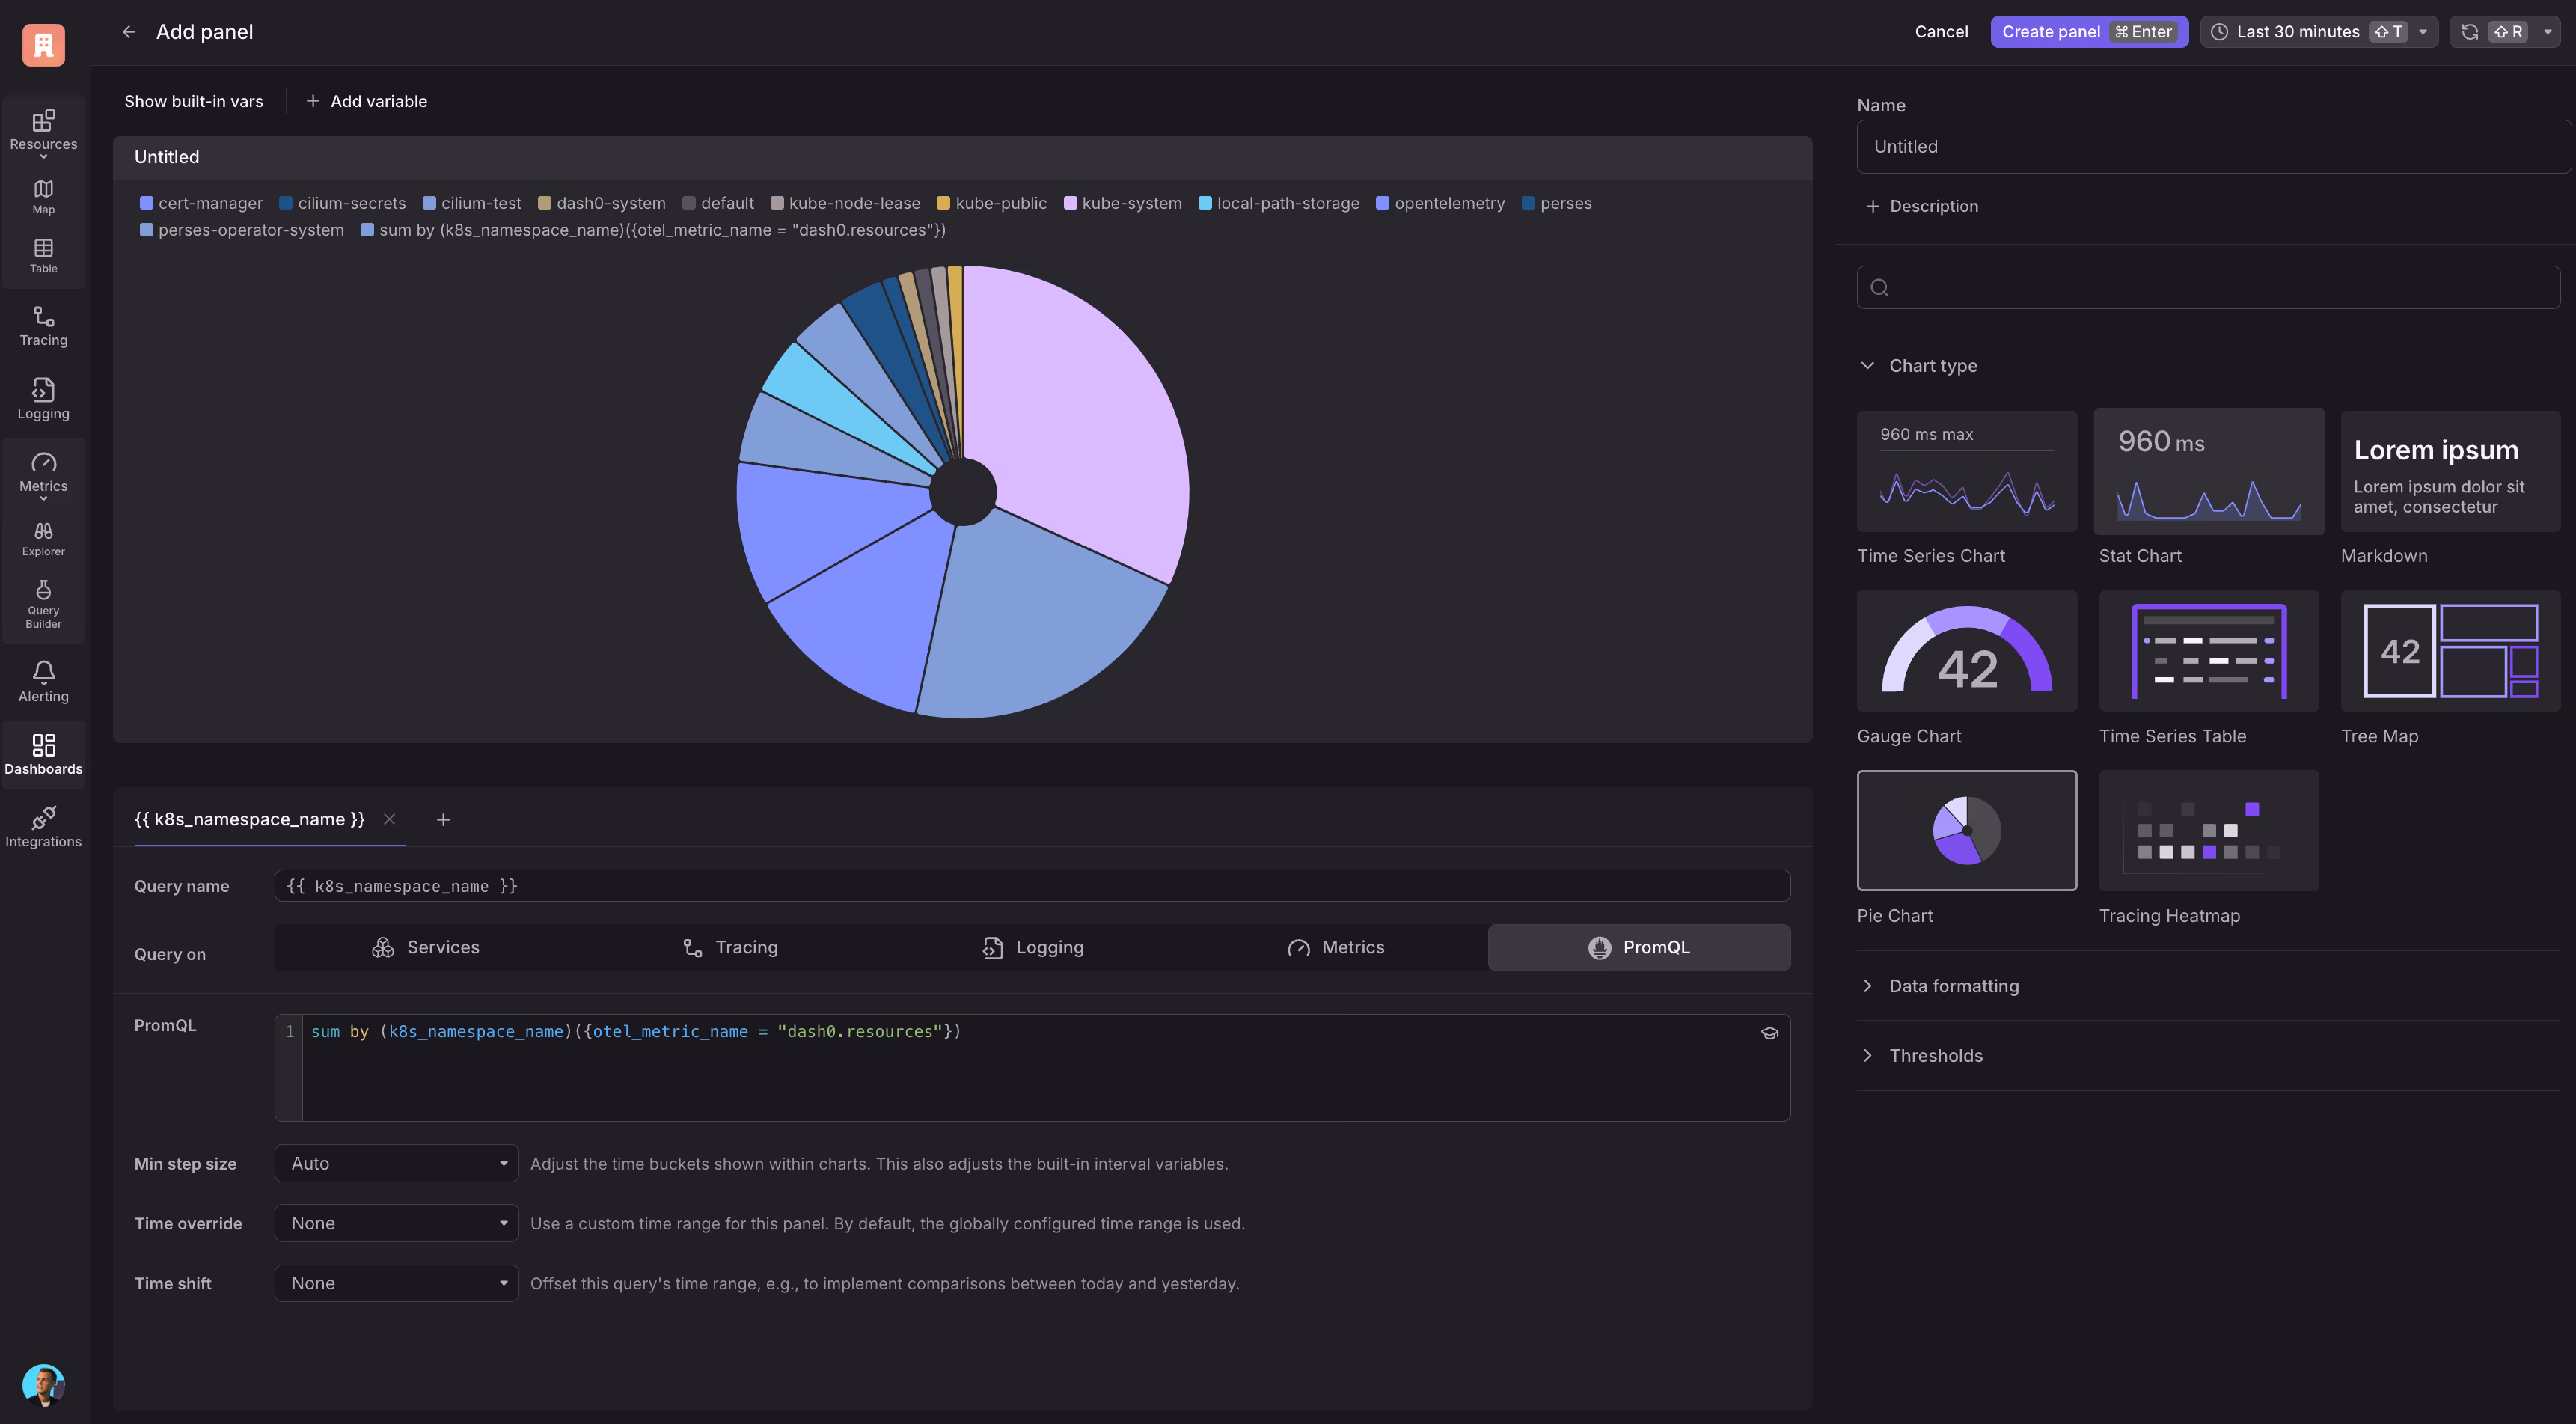
Example query:
1sum by (k8s_namespace_name)({otel_metric_name = "dash0.resources"})
Using Synthetic Metrics for Observability
- Troubleshoot Anomalies: Identify spikes in logs, spans, and errors.
- Monitor Performance: Track latency using
dash0.spans.duration. - Detect Infrastructure Issues: Use
dash0.resourcesto identify missing components.
Next Steps
- Learn more about the Dash0 Query Builder for advanced filtering.
- Integrate synthetic metrics into your alerting pipelines.
- Explore distributed tracing with Dash0's span analysis tools.
Further Reading
- Adaptive Sampling: Intelligent sampling for fast performance with large datasets
- Filtering: Use flexible attribute-based filters to access relevant telemetry
- RED Metrics: Monitor service health using Requests, Errors, and Duration