Last updated: July 6, 2026
About Website Monitoring
The Websites Explorer is a curated, opinionated view of your frontend health, which combines user behavior metrics, Core Web Vitals, and session-level details in one place.
With contextual data, such as session traces, custom events, and performance metrics, you can pivot to related views and uncover root causes from multiple angles.
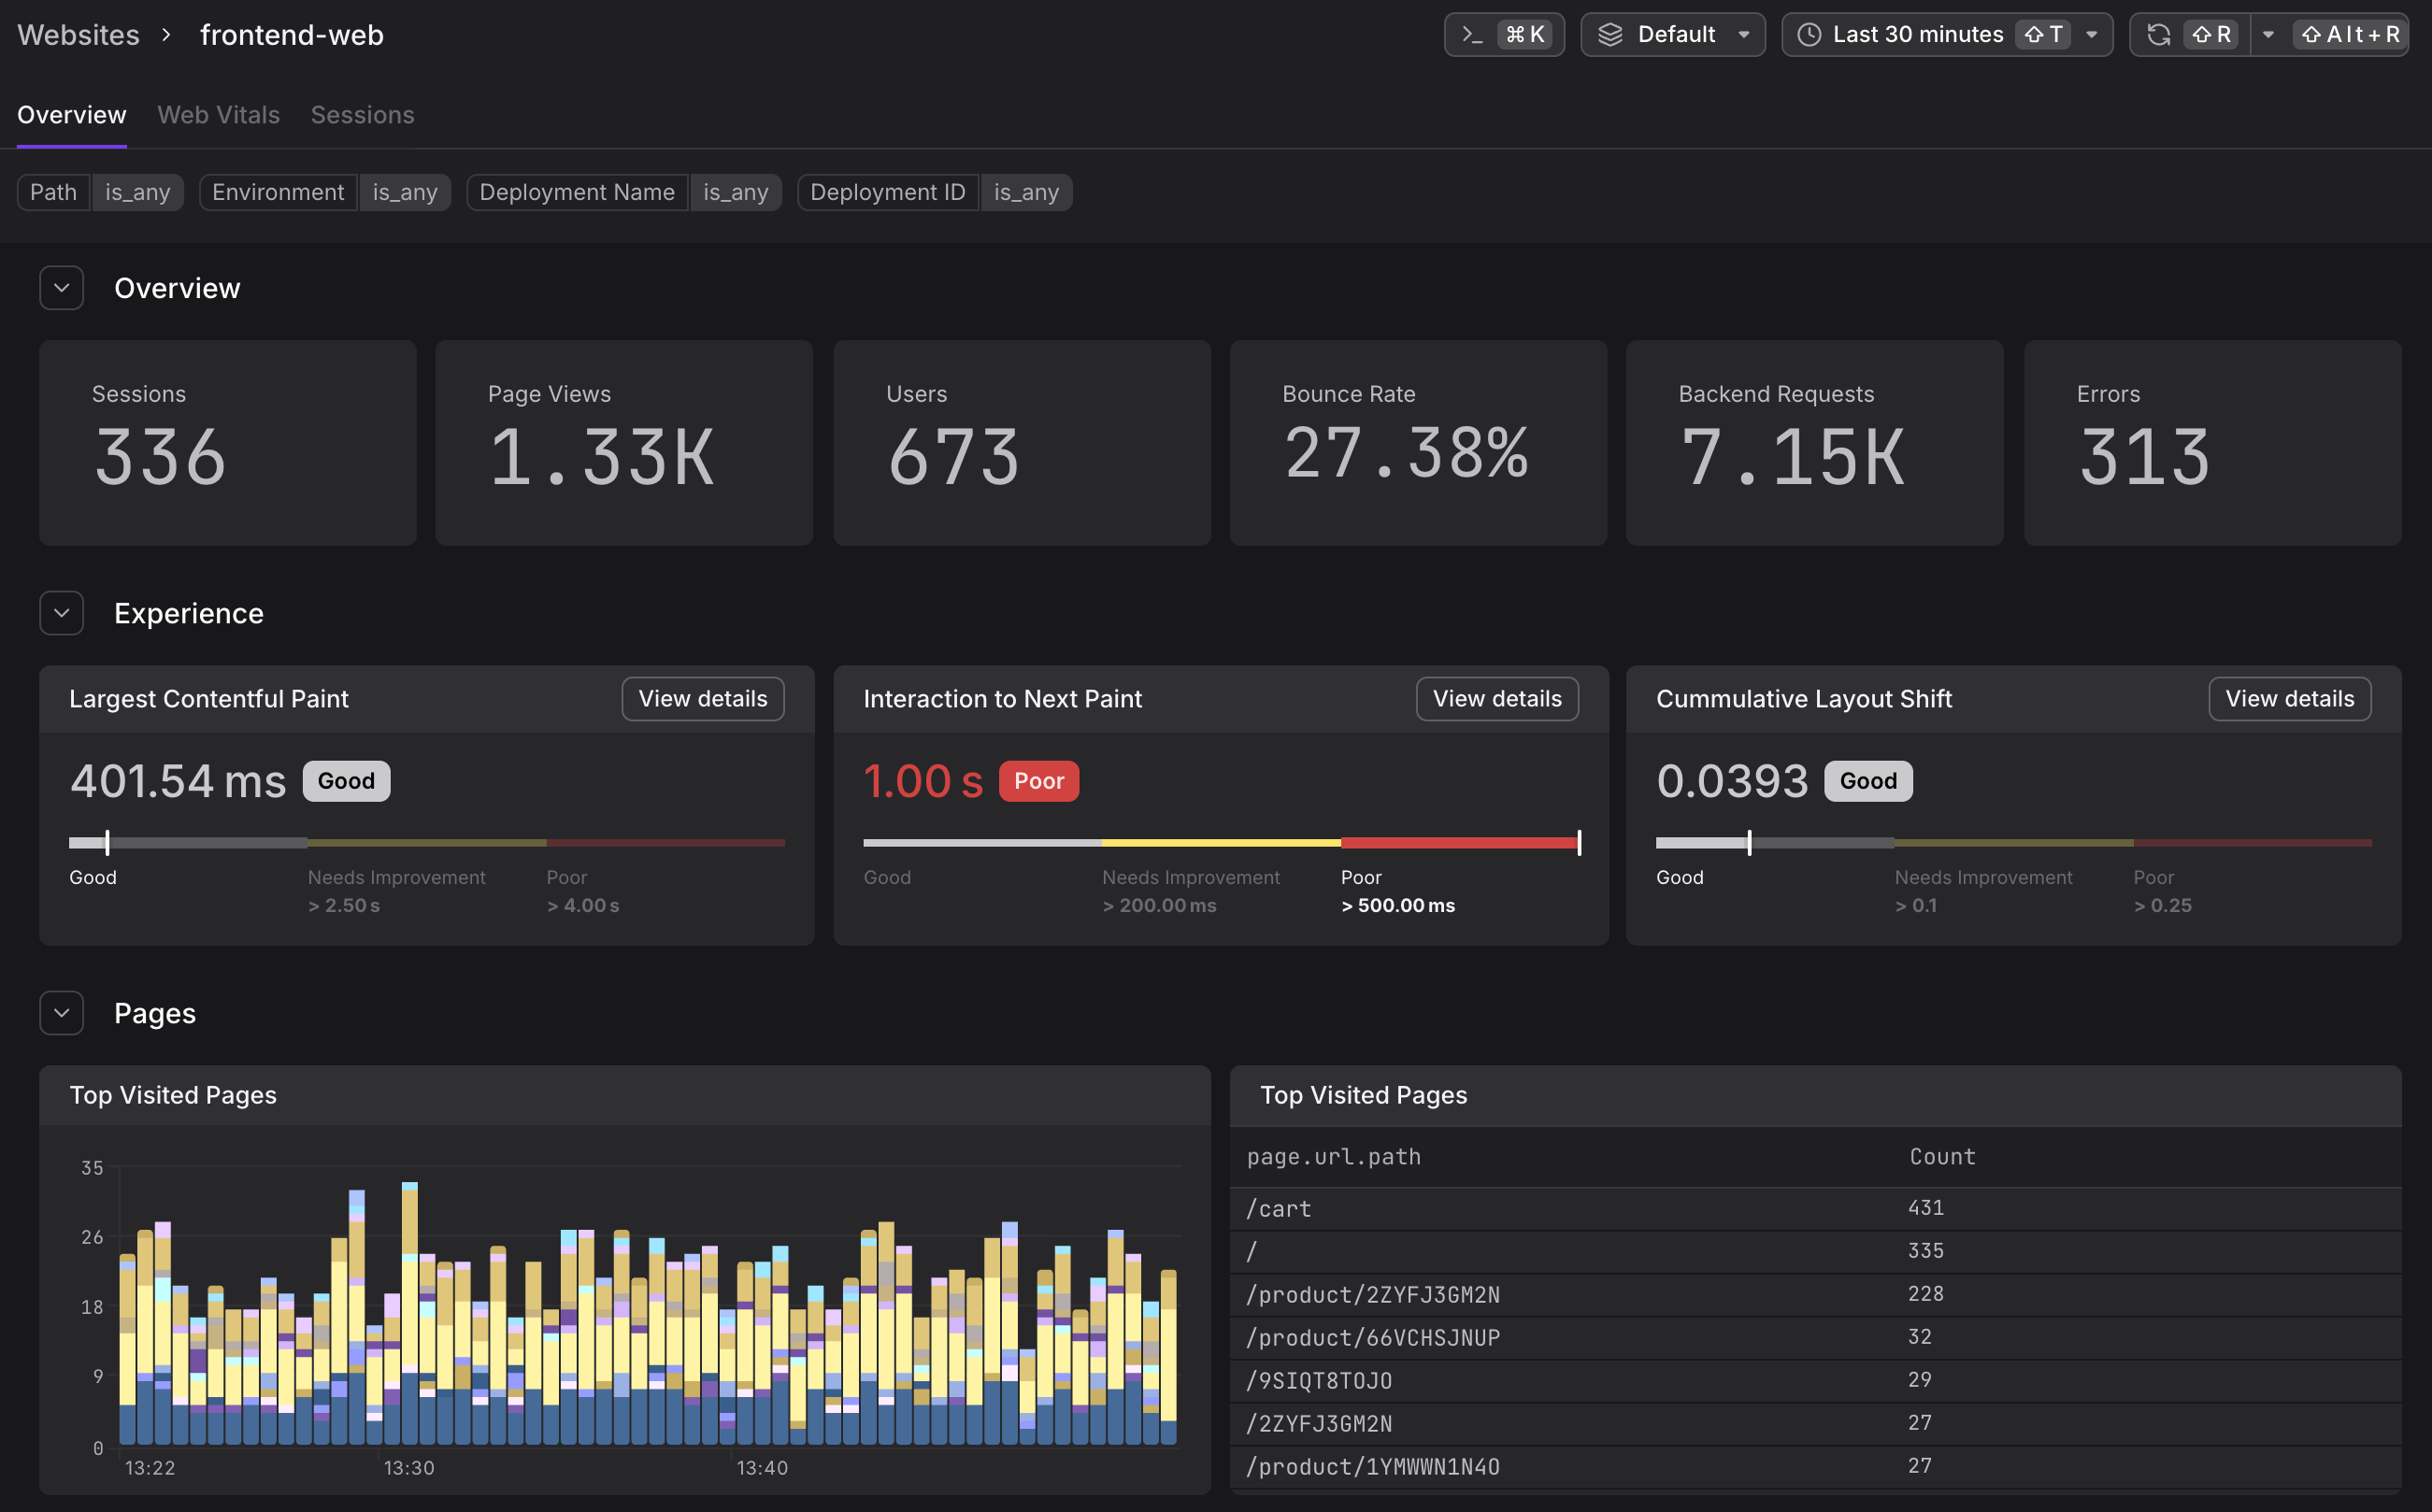
Each instrumented website gets its own card on the landing page and its own detail view with three tabs, shown above, Overview, Web Vitals, and Sessions.
If you're looking for a conceptual overview of how Dash0 captures real user sessions, Core Web Vitals, and frontend-to-backend traces using OpenTelemetry, see the Website Monitoring with OpenTelemetry and Dash0 Guide.
The Websites Explorer is organized into the following areas:
Global Controls
- Filter — narrows data across all tabs by Path, Environment, Deployment Name, Deployment ID, or custom attributes. More here...
- Command Menu — provides quick access to common actions and navigation. More here...
- Time Picker — sets the time range for all views. More here...
Website List
- Website cards — each card on the landing page shows the website name alongside its top-level KPIs: Sessions, Requests, LCP p75, INP p75, and CLS p75. Values that exceed their threshold are highlighted in red.
Website Detail Tabs
- Overview — a high-level dashboard showing traffic volume (Sessions, Page Views, Users, Bounce Rate, Backend Requests, Errors), Core Web Vital scores, top visited pages, and a session geography map. More here...
- Web Vitals — a per-vital deep-dive with p75 scores, Good/Needs Improvement/Poor gauges, performance-over-time charts, and a page-level breakdown table for each of LCP, INP, and CLS. More here...
- Sessions — a searchable, filterable list of individual user sessions with summary charts, cross-tab tracking, and a detail panel that shows the page flow, events, frontend-to-backend trace correlation, and JavaScript errors with source map resolution. More here...
From any session in the Sessions tab, you can click View full session to see a complete chronological timeline of every event — page views, HTTP requests, web vitals, errors, and custom events — with direct links to backend traces. More here...
Relationship to Web Events
Websites and Web Events relate to each other the same way Services and Traces do.
-
Websites provides a structured, high-level experience — pre-built dashboards, web vital gauges, and session timelines — built on top of the raw
browser.*events collected by the Web SDK. -
Web Events gives you direct access to that underlying event stream for custom filtering, grouping, and correlation with backend telemetry.
Further Reading
- Analyze Web Vitals — Web Vitals tab with p75 scores and page-level breakdowns
- Correlate Sessions with Backend Traces — Debug slow HTTP requests from frontend to backend
- Investigate Sessions — Browse and filter individual user sessions
- Set Up the Web SDK — Installation and configuration instructions
- Understand Web Vitals — LCP, INP, and CLS definitions and thresholds