Last updated: August 28, 2026
Code RED Newsletter #36
Profiling has always been the signal you switch on halfway through an incident and then forget about for eleven months. Mine included. Then the GPU bill arrives, or a p99 wanders off for reasons nobody can explain, and you suddenly remember it's been sitting there the whole time - behind a flag you set last October and never looked at again.
Dash0 acquires Polar Signals - more on what that means below - and the honest origin story is that Mirko ended up seated next to Frederic Branczyk at a dinner in Berlin and they got talking about storage engines. Not the version you'd put in a deck.
It earns the top of the issue because it isn't the only thing this fortnight pointing the same way. Hand an agent a profile and it stops guessing - it can find the function burning your CPU, or the CUDA kernel quietly eating your inference budget, and open the pull request itself. That only works because a profile is unusually honest data: the exact line, the exact kernel, the exact cost.
In focus: Ground Truth
A few things rhyme this fortnight: Google's A2A protocol moved in alongside Anthropic's MCP, profiling got considerably more accessible, and OpenTelemetry published a genuinely useful post on entity events. Different stories, but there's a common thread: giving humans and agents better ground truth about what's actually happening. Either way, there's good reading below.
Dash0 Acquires Polar Signals
The story starts at a dinner in Berlin, where Mirko and Frederic Branczyk realized they'd been working toward the same thing from opposite ends. As they tell it in the founders' story, Dash0 had metrics, logs, and traces connected but was missing the signal showing what the code was actually doing. Polar Signals had spent years building exactly that, plus Great Lakes, the fifth iteration of a storage engine designed for profiling's extreme cardinality. Great Lakes will eventually replace ClickHouse underneath SignalStore, bringing metrics, logs, traces, and profiles onto the same engine.
Frederic gives the Polar Signals side of the story, including what comes next: continuous profiling inside SignalStore, the continued GPU and CUDA work, and AutoTune, which uses profiling data to find optimization opportunities and open pull requests with the evidence attached. That's the part I'd underline: profiling gives agents ground truth rather than another thing to reason about - the function burning CPU, the CUDA kernel eating your inference budget, the actual code path behind the problem.
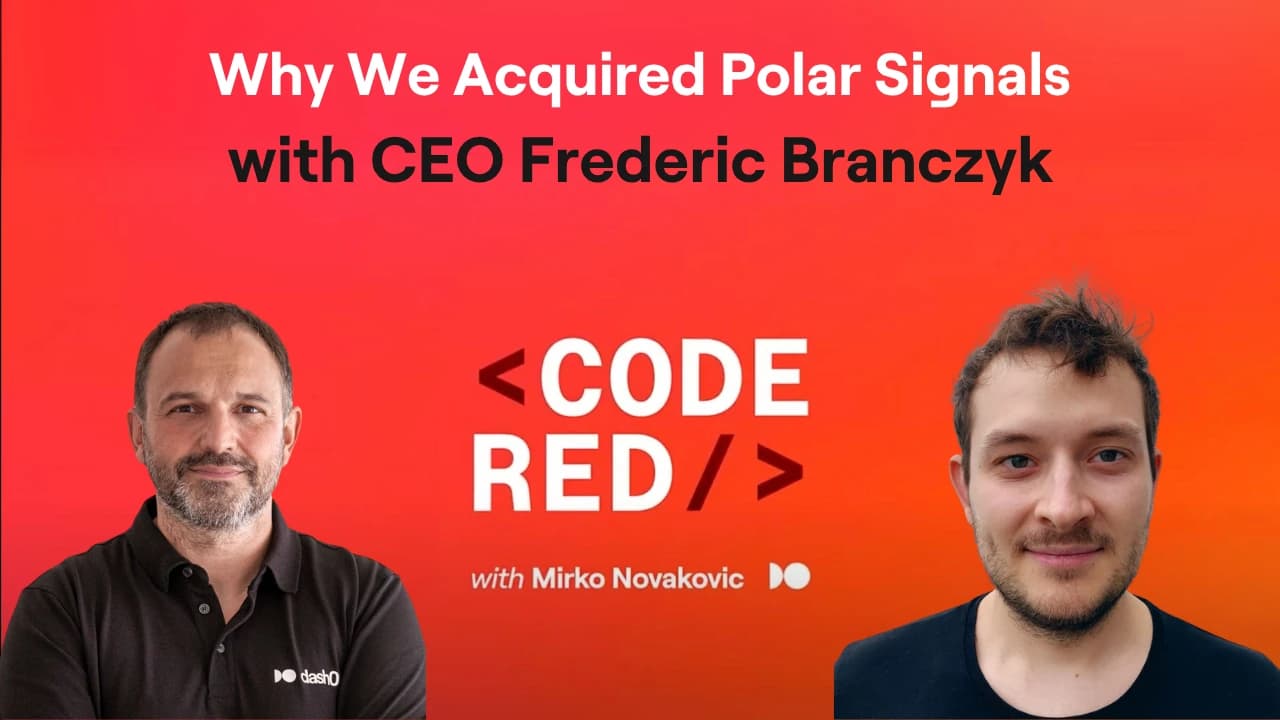
Code RED Podcast #48 - Why We Acquired Polar Signals with CEO Frederic Branczyk
Mirko sat down with Frederic for 33 minutes, and the interesting bit is hearing the person who spent six years building Polar Signals explain profiling without the press-release filter. His main point: profiling has always been powerful, but traditionally required an expert to interpret it. With always-on profiling and AI, that might be changing.
A2A Joins AAIF's Open Agentic Stack
Google's Agent2Agent protocol is now a hosted AAIF project alongside MCP. They solve different problems - MCP connects agents to tools and data, while A2A lets independent agents discover each other and delegate work.
There's a familiar pattern here: competing standards moving under neutral governance rather than creating competing ecosystems. OpenTracing and OpenCensus eventually did the same thing and became OpenTelemetry.
Arize OpenInference Code Grant to Accelerate OpenTelemetry's GenAI Instrumentation Coverage
Arize donated the instrumentation code behind OpenInference to OpenTelemetry, giving the GenAI SIG a bootstrap for SDKs and agent frameworks OTel doesn't cover today.
Importantly, this isn't a merger. OpenInference remains its own project and OTel keeps its gen_ai.* conventions. The interesting part is what comes next: closing gaps around guardrails, reranking, evaluations, handoffs, realtime and audio inference.
In Search of Observability's Rails Moment
Yes, this one's by me. In 2019 Bryan Liles asked the Kubernetes community to find its Rails moment: strong defaults that hide complexity without removing control. Platform engineering eventually became part of that answer.
Observability needs the same treatment. Instead of every team running Collectors, defining conventions and solving the same problems independently, observability should become a platform product with defaults, policies and instrumentation provided by the platform.
That matters even more with AI: agents reason over structure. Consistent telemetry gives them something they can actually navigate.
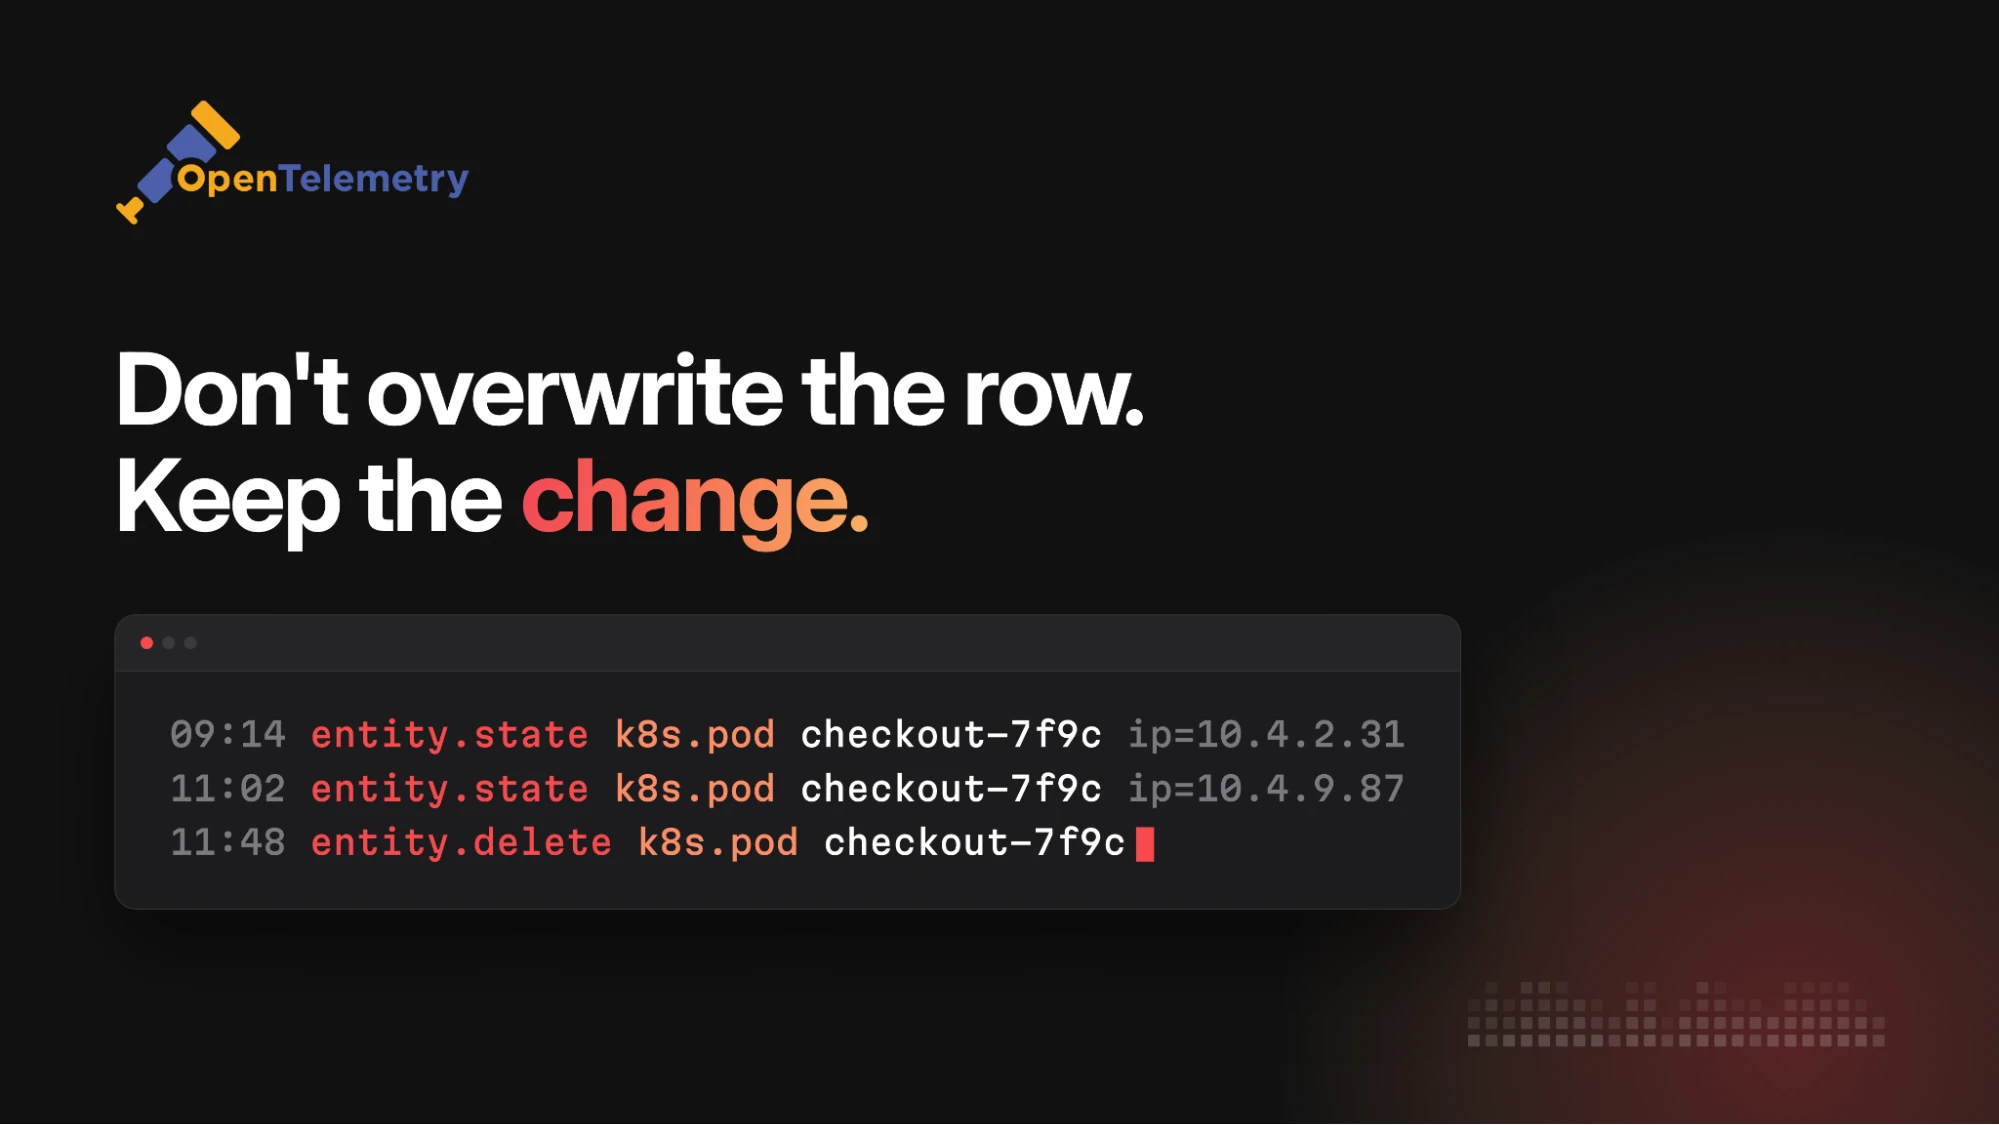
What Can You Do With OpenTelemetry Entity Events?
OpenTelemetry entity events let you keep a history of what exists and how it changes instead of just maintaining the current state. Overwrite a host's address and you lose both what changed and when; keep the stream and you can reconstruct what your environment looked like at a particular point in time.
There's an agent angle too: expose that history through MCP and an assistant can query entities and their relationships in natural language. The model is still evolving, though, so treat the current attributes as illustrative.
How to Turn Slow Queries Into Actionable Reliability Metrics With OpenTelemetry
The trick at the center of Severin Neumann's walkthrough is simple: the slowest query isn't necessarily the one worth fixing. Multiply duration by call frequency and the priorities can change completely.
The bigger point is useful: teams don't need more database telemetry, they need to distinguish queries that are inherently slow from queries behaving unusually today. Those are different problems, and only one of them is likely an incident.
Choice cuts
Smaller plates, same kitchen.
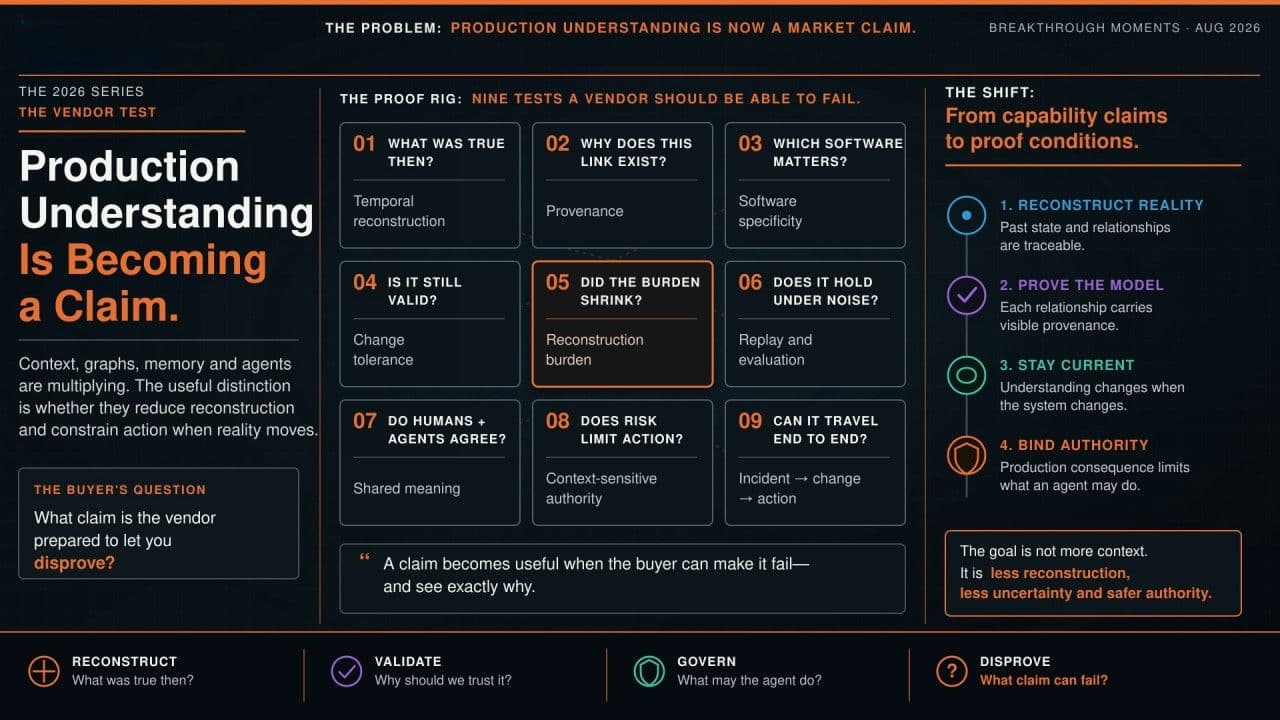
Production Understanding Is Becoming a Claim... Here Are the Tests It Must Pass
"Production understanding" is quickly becoming a commodity claim, so Andrew Mallaband proposes nine tests for whether a platform actually delivers it: temporal reconstruction, memory validity, consequence-aware control and more.
The framing I liked most: more context can make a decision worse, and a good pilot should make the vendor's claim capable of failing.
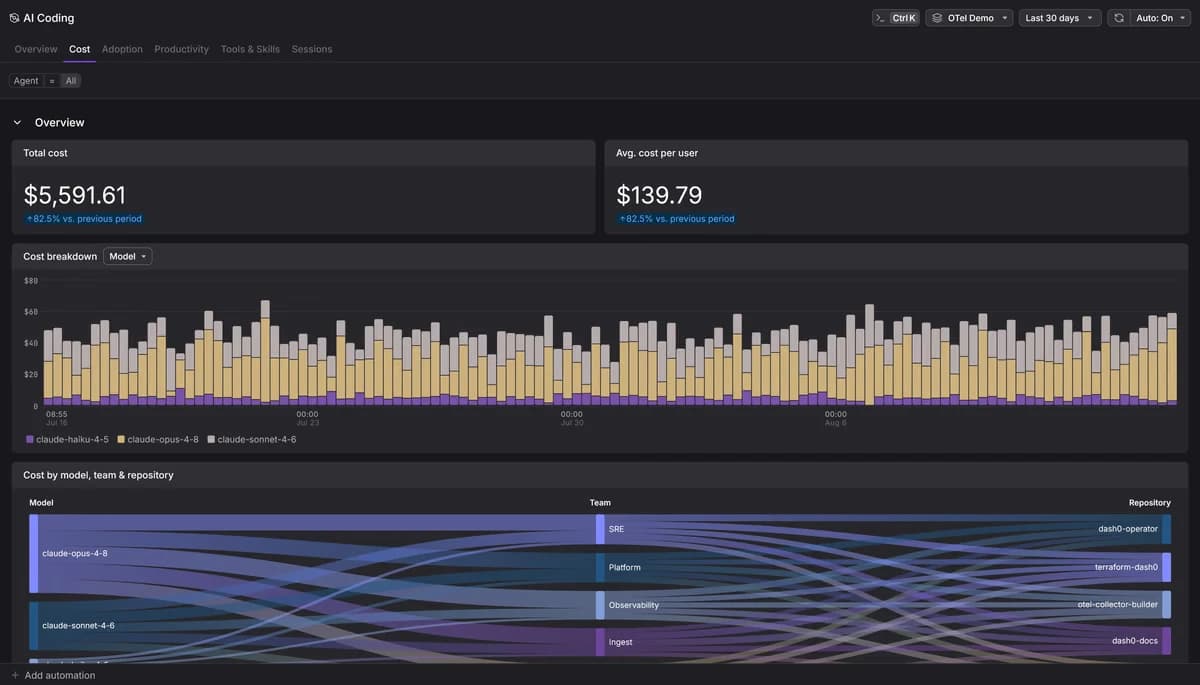
Monitoring Claude Code Usage and Costs with OpenTelemetry
Claude Code supports OpenTelemetry natively. Enable telemetry and you can collect session counts, token usage, estimated costs and tool activity, with traces through model requests and tool calls available behind a beta flag.
Ayooluwa Isaiah's guide walks through the setup, including a complete local stack if you want to experiment before sending the telemetry anywhere. It also shows how to go further with AI Coding Insights and the dash0-agent-plugin, adding richer context around what coding agents are doing and how that connects back to your telemetry.
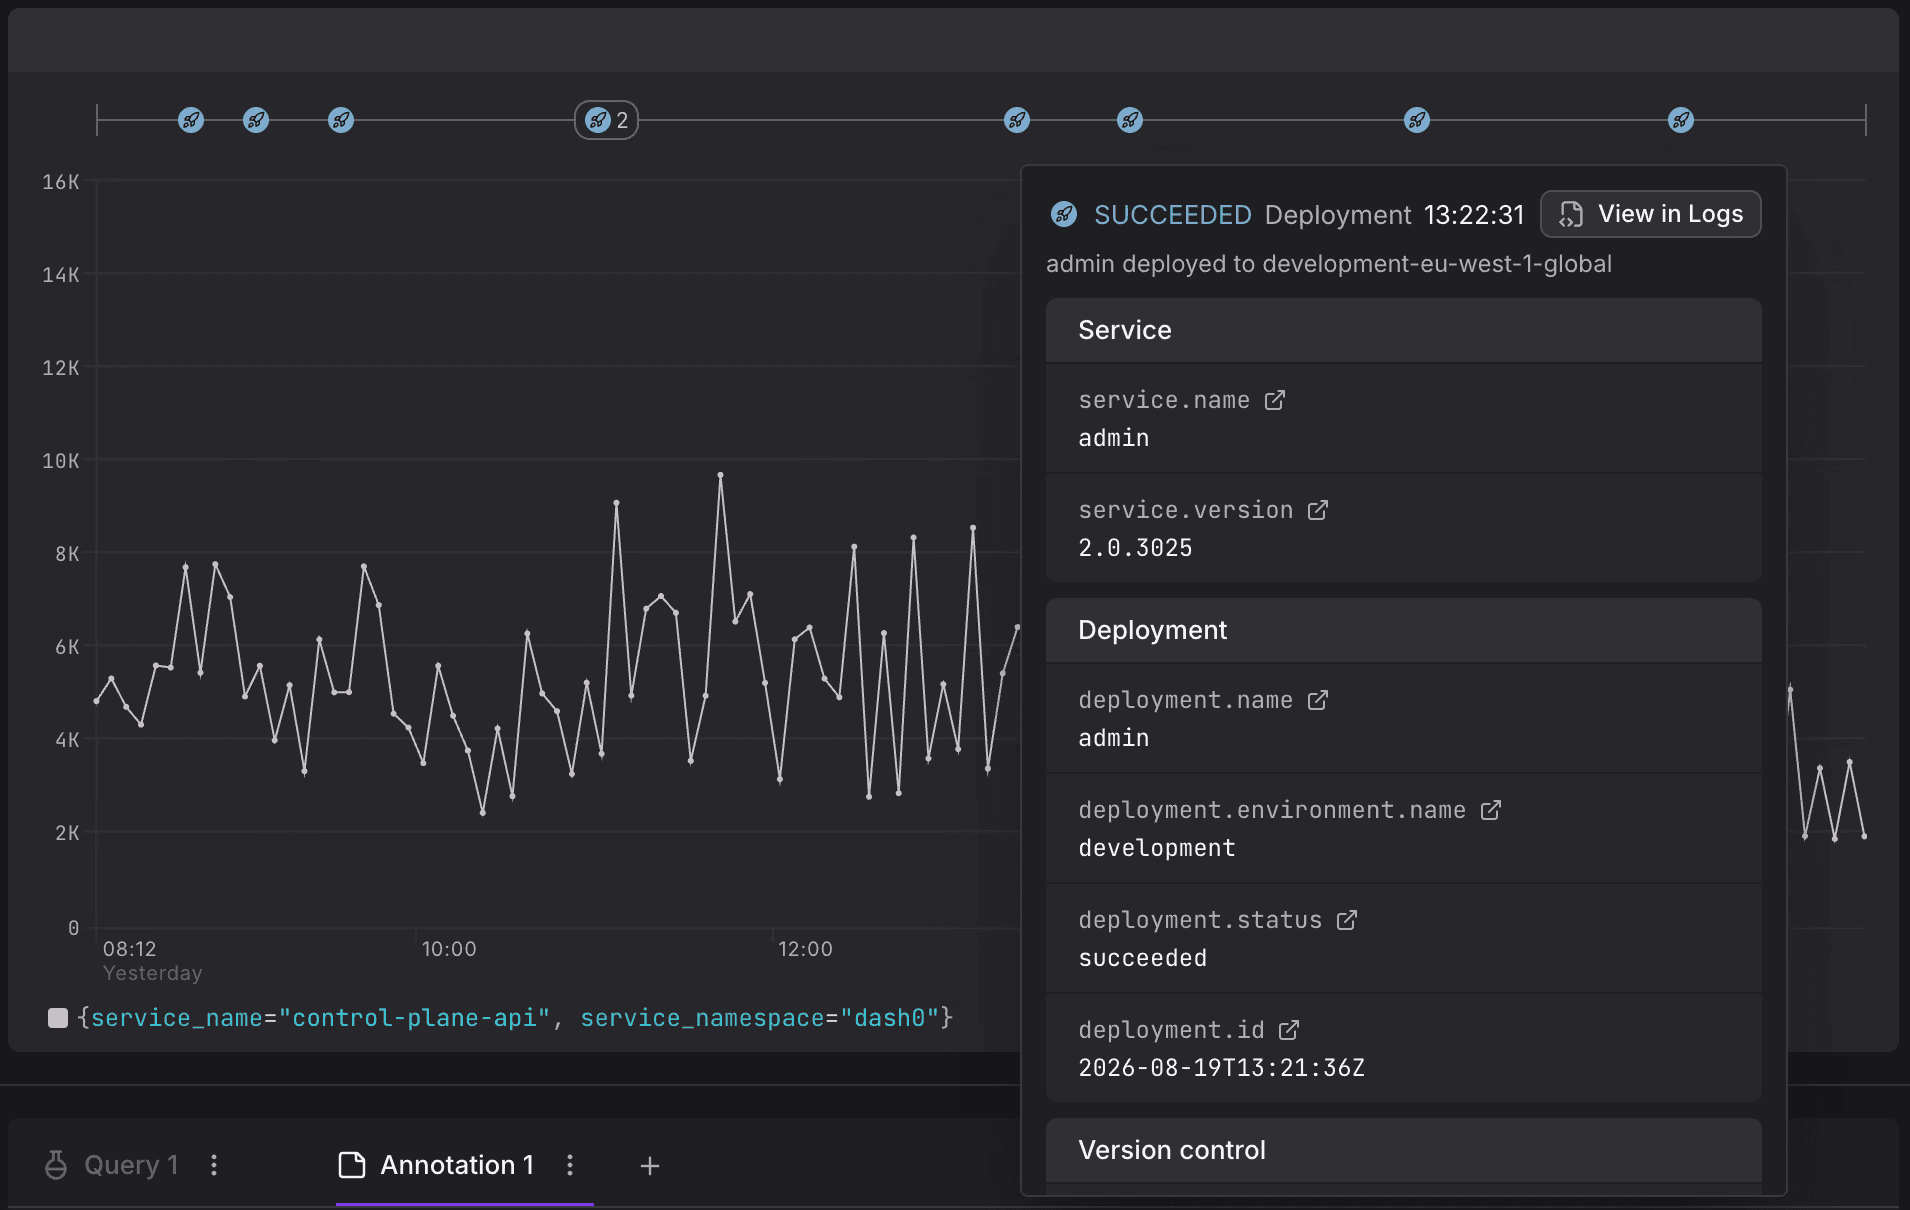
Deployments as Chart Annotations, and Terraform Deployment Actions
Deployments can now appear directly as timeline markers on time-series panels, including success or failure. The Terraform provider also gained deployment and log event actions, making it easier to connect infrastructure changes with what you see in production. By the way, you could already create deployment events via the CLI and GitHub action.
Deployments as chart annotation
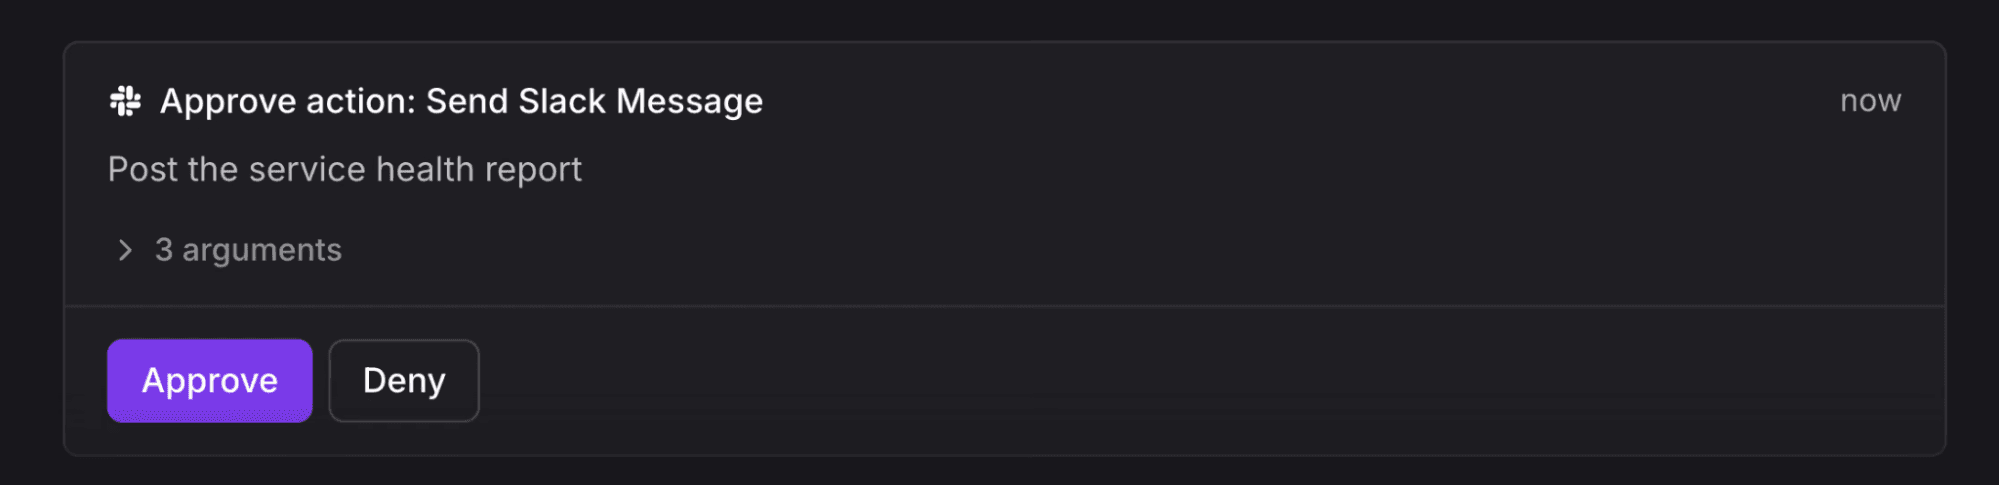
Approve Agent0's Write Actions Before They Run
Org admins can now require confirmation before Agent0 Chat performs write actions like posting messages or creating automations, while read-only queries continue untouched.
In a month where everyone is racing to give agents more autonomy, shipping a switch that deliberately withholds it felt worth mentioning.
If there's one thing I'd take from this fortnight, it's that very little of the good stuff was about collecting more. The slow-query post is about extracting three metrics instead of adding traces, entity events are about keeping what you already had, and profiling is useful precisely because it's narrow. Modest theme for a modest two weeks.
Two chances to argue with us about it next week. Julia Furst Morgado is at KCD San Francisco Bay Area on Tuesday 1 September, talking OTTL with Reese Lee of New Relic and asking why we're still sending all that raw data. Then I'm at ContainerDays Hamburg, 2-4 September, with "Beyond 'Supports OpenTelemetry': A Maturity Model for Cloud-Native Observability." Apparently I get to talk OpenTelemetry on a historic cargo ship, which is a flex. Come find either of us.
Until next time: keep your conventions boring, keep your history, and may your profiler find the loop before your invoice does.
Kasper, out!
Hi, my name is Kasper!
I'm Kasper Borg Nissen, Director of Developer Relations at Dash0. I'm passionate about Observability and bridging the gap toward developers through Platform Engineering. I've previously worked 8 years as a platform engineer, I'm a former co-chair of KubeCon+CloudNativeCon, and I'm genuinely obsessed with all things cloud-native and open standards.