Last updated: July 20, 2026
Code RED Newsletter #30

It's been a busy two weeks at Dash0. Last week the team was in two places at once: Google Cloud Next in Las Vegas and DevOpsCon / MLCon in Amsterdam. Same week, different sides of the world. Demo after demo, conversation after conversation in Vegas; same pace in Amsterdam, where Aakansha Priya and Mads Thines also took the stage. Two cities, two booths, one team that hasn't stopped moving.
And then there was Times Square. A few weeks after announcing the Series B, most of the US-based team - NYC, Boston, and beyond - showed up in matching red overalls alongside Mirko and CRO Oliver Manojlovic to see Dash0 up on the Nasdaq billboard.

Now to the actual reason you're here. Last month, OpenTelemetry quietly retired OpenTracing compatibility from the specification. Not deleted - just no longer required for new SDKs. The shims still work. The migration guidance is still there. But the bridge that got an entire industry across to OTel is officially no longer load-bearing. It's the kind of bureaucratic moment that's easy to miss, but I think historians will point at it later. OpenTracing was the predecessor protocol that made OpenTelemetry politically and technically possible - the merge of OpenTracing and OpenCensus is literally the origin story. Watching the spec quietly let go of that bridge feels like a generational handover.
Which makes this a good moment to ask the obvious follow-up question: if OTel is now the whole load-bearing thing, what does it look like when it's actually doing the work? This issue is about the people actually doing it well - in production, at the edge, and across the messy operational reality in between.
In focus: OpenTelemetry, Operationalized
The frameworks are written, the protocol has won, and the predecessor projects are being archived. What's left is the unglamorous operational work: running collectors at scale, getting metrics out of service meshes, surviving migrations from legacy stacks, and figuring out what "supports OpenTelemetry" really means once you go below the README. Here are five stories from people actually doing that work right now.
OpenTracing Compatibility: Officially Sunset
The OpenTelemetry community formally deprecated OpenTracing compatibility from the specification (PR #4938). New SDKs and implementations are no longer required to support OpenTracing shims. Existing shims keep working through the deprecation window - earliest removal from the spec is March 2027 - so nobody's getting paged this weekend. But if you're still depending on a shim, the writing is on the wall. The rationale is matter-of-fact: OpenTracing has been inactive for years, and the ecosystem has already moved on. A quiet but symbolic moment - the bootstrap chapter is closed.
Read the deprecation announcement
Skyscanner's OpenTelemetry at 1,000 Microservice
Skyscanner runs 1,000+ microservices across 24 production Kubernetes clusters, and they migrated all of it to OpenTelemetry starting in 2021 - explicitly to avoid lock-in while moving to a commercial vendor. The architecture is worth studying: Istio-based routing, Gateway Collectors as a ReplicaSet for OTLP, Agent Collectors as a DaemonSet for Prometheus scrapes. Two choices stand out. First, they convert Istio service mesh spans into platform metrics via the span-metrics connector - getting consistent service metrics across 1,000+ services with zero application instrumentation. Second, they bake the OpenTelemetry Java agent into base Docker images with all instrumentations disabled by default. Teams opt in to what they need. Both moves trade a bit of magic for a lot of predictability, and the team reports operations have been "quite pain-free." Exactly the kind of story I wish more platforms shared publicly.
Read the case study on the OTel blog

Airbnb Quietly Migrates 100M Samples/Sec to OTel
Airbnb migrated their metrics infrastructure from legacy StatsD/Veneur to an OTel-based stack handling 100M+ samples per second. The stack is now OTLP + OpenTelemetry Collector + VictoriaMetrics' vmagent (for streaming aggregation) + Grafana Mimir for storage, with PromQL on top. The clever bit is the migration strategy: a shared metrics library that dual-emits to both pipelines simultaneously, which let them get all metrics flowing first and then tackle dashboards and alerts with real data instead of betting on a coordinated cutover. InfoQ reads it - correctly - alongside Flipkart and Shopify as part of a broader pattern: the StatsD exit, the vendor cost reckoning, and the move to OTLP-first ingestion.

Observability at the Edge: What "Supports OTel" Actually Means
I've spent the past several months deep in the weeds on ingress controllers and gateways - and what "supports OpenTelemetry" actually means once you look closely. With OTel now at roughly 50% production adoption, the label has become so loose that it's borderline meaningless. I walk through kgateway, Contour, Traefik, Emissary Ingress and Istio Gateway. The patterns that emerge: tracing is largely standardized via Envoy; metrics still favor Prometheus scraping over OTLP push, so most real pipelines are hybrid; the Collector is the critical alignment layer; semantic conventions are inconsistent across projects; and resource identity is often derived downstream rather than expressed at the source. Traces that "start mid-story" because the edge layer wasn't instrumented properly are everywhere. If you've been on the receiving end of one at 2 a.m., this piece is for you.
Read the post on the Dash0 blog

Code RED Podcast: Breaking the Observability Model with Juraj Masar
Juraj Masar, co-founder and CEO of Better Stack, joins Mirko for a candid - and refreshingly opinionated - conversation. His argument that observability pricing has become deliberately incomprehensible (active series, custom metrics, data points, hosts - every vendor a different unit) is worth the listen on its own. On the technical side, Juraj is unambiguous: eBPF + OTel has won for distributed instrumentation, "try it in 15 minutes on staging." And the part that stuck with me - the prediction that the observability category is becoming the AI SRE category, with MCP servers letting L1 support investigate issues independently and small AI-native teams competing with much bigger incumbents.

Choice cuts
Pour yourself something warm and settle in. A few more pieces from the ecosystem worth catching up on.
CNCF Partners With Kapa.ai to Reduce the Maintainer Support Tax
CNCF announced free Kapa.ai access for all CNCF-hosted projects. Kapa uses RAG grounded in project-specific docs, source code, GitHub discussions, and chat archives, so answers are tied to actual project material rather than general LLM hallucinations. OpenTelemetry and Envoy Gateway are already using it to handle thousands of community questions per month. The framing is what I appreciate: this is about maintainer sustainability, not chatbot novelty. Repetitive support questions are a tax on contributors, and surfacing documentation gaps in the process is a useful side effect.

Dash0 SQL: Querying Telemetry With What You Already Know
Dash0 SQL is now generally available - write standard SQL directly against logs, spans, and web events, with full support for joins (including cross-signal), subqueries, aggregations, and a wide function library. Built-in templates, local query history, and saved views shareable across teams. The unlock that the changelog leads with: because it's standard SQL, any AI tool can write the query for you. Describe what you want, paste the result. Pairs well with the trajectory in the podcast above.

OAuth for MCP: Bring Your Telemetry Into Claude Code, Cursor, and Friends
Dash0's MCP server now supports OAuth 2.0, which means AI coding tools - Claude Code, Cursor, Windsurf - can connect without anyone copying static API tokens around. Browser-based flow, dynamic client registration, 15-minute access tokens with automatic refresh, every action logged. Static bearer tokens still work for CI/CD where they belong. A small thing on paper, but the right small thing if you actually want observability data sitting next to where the AI is doing its work.

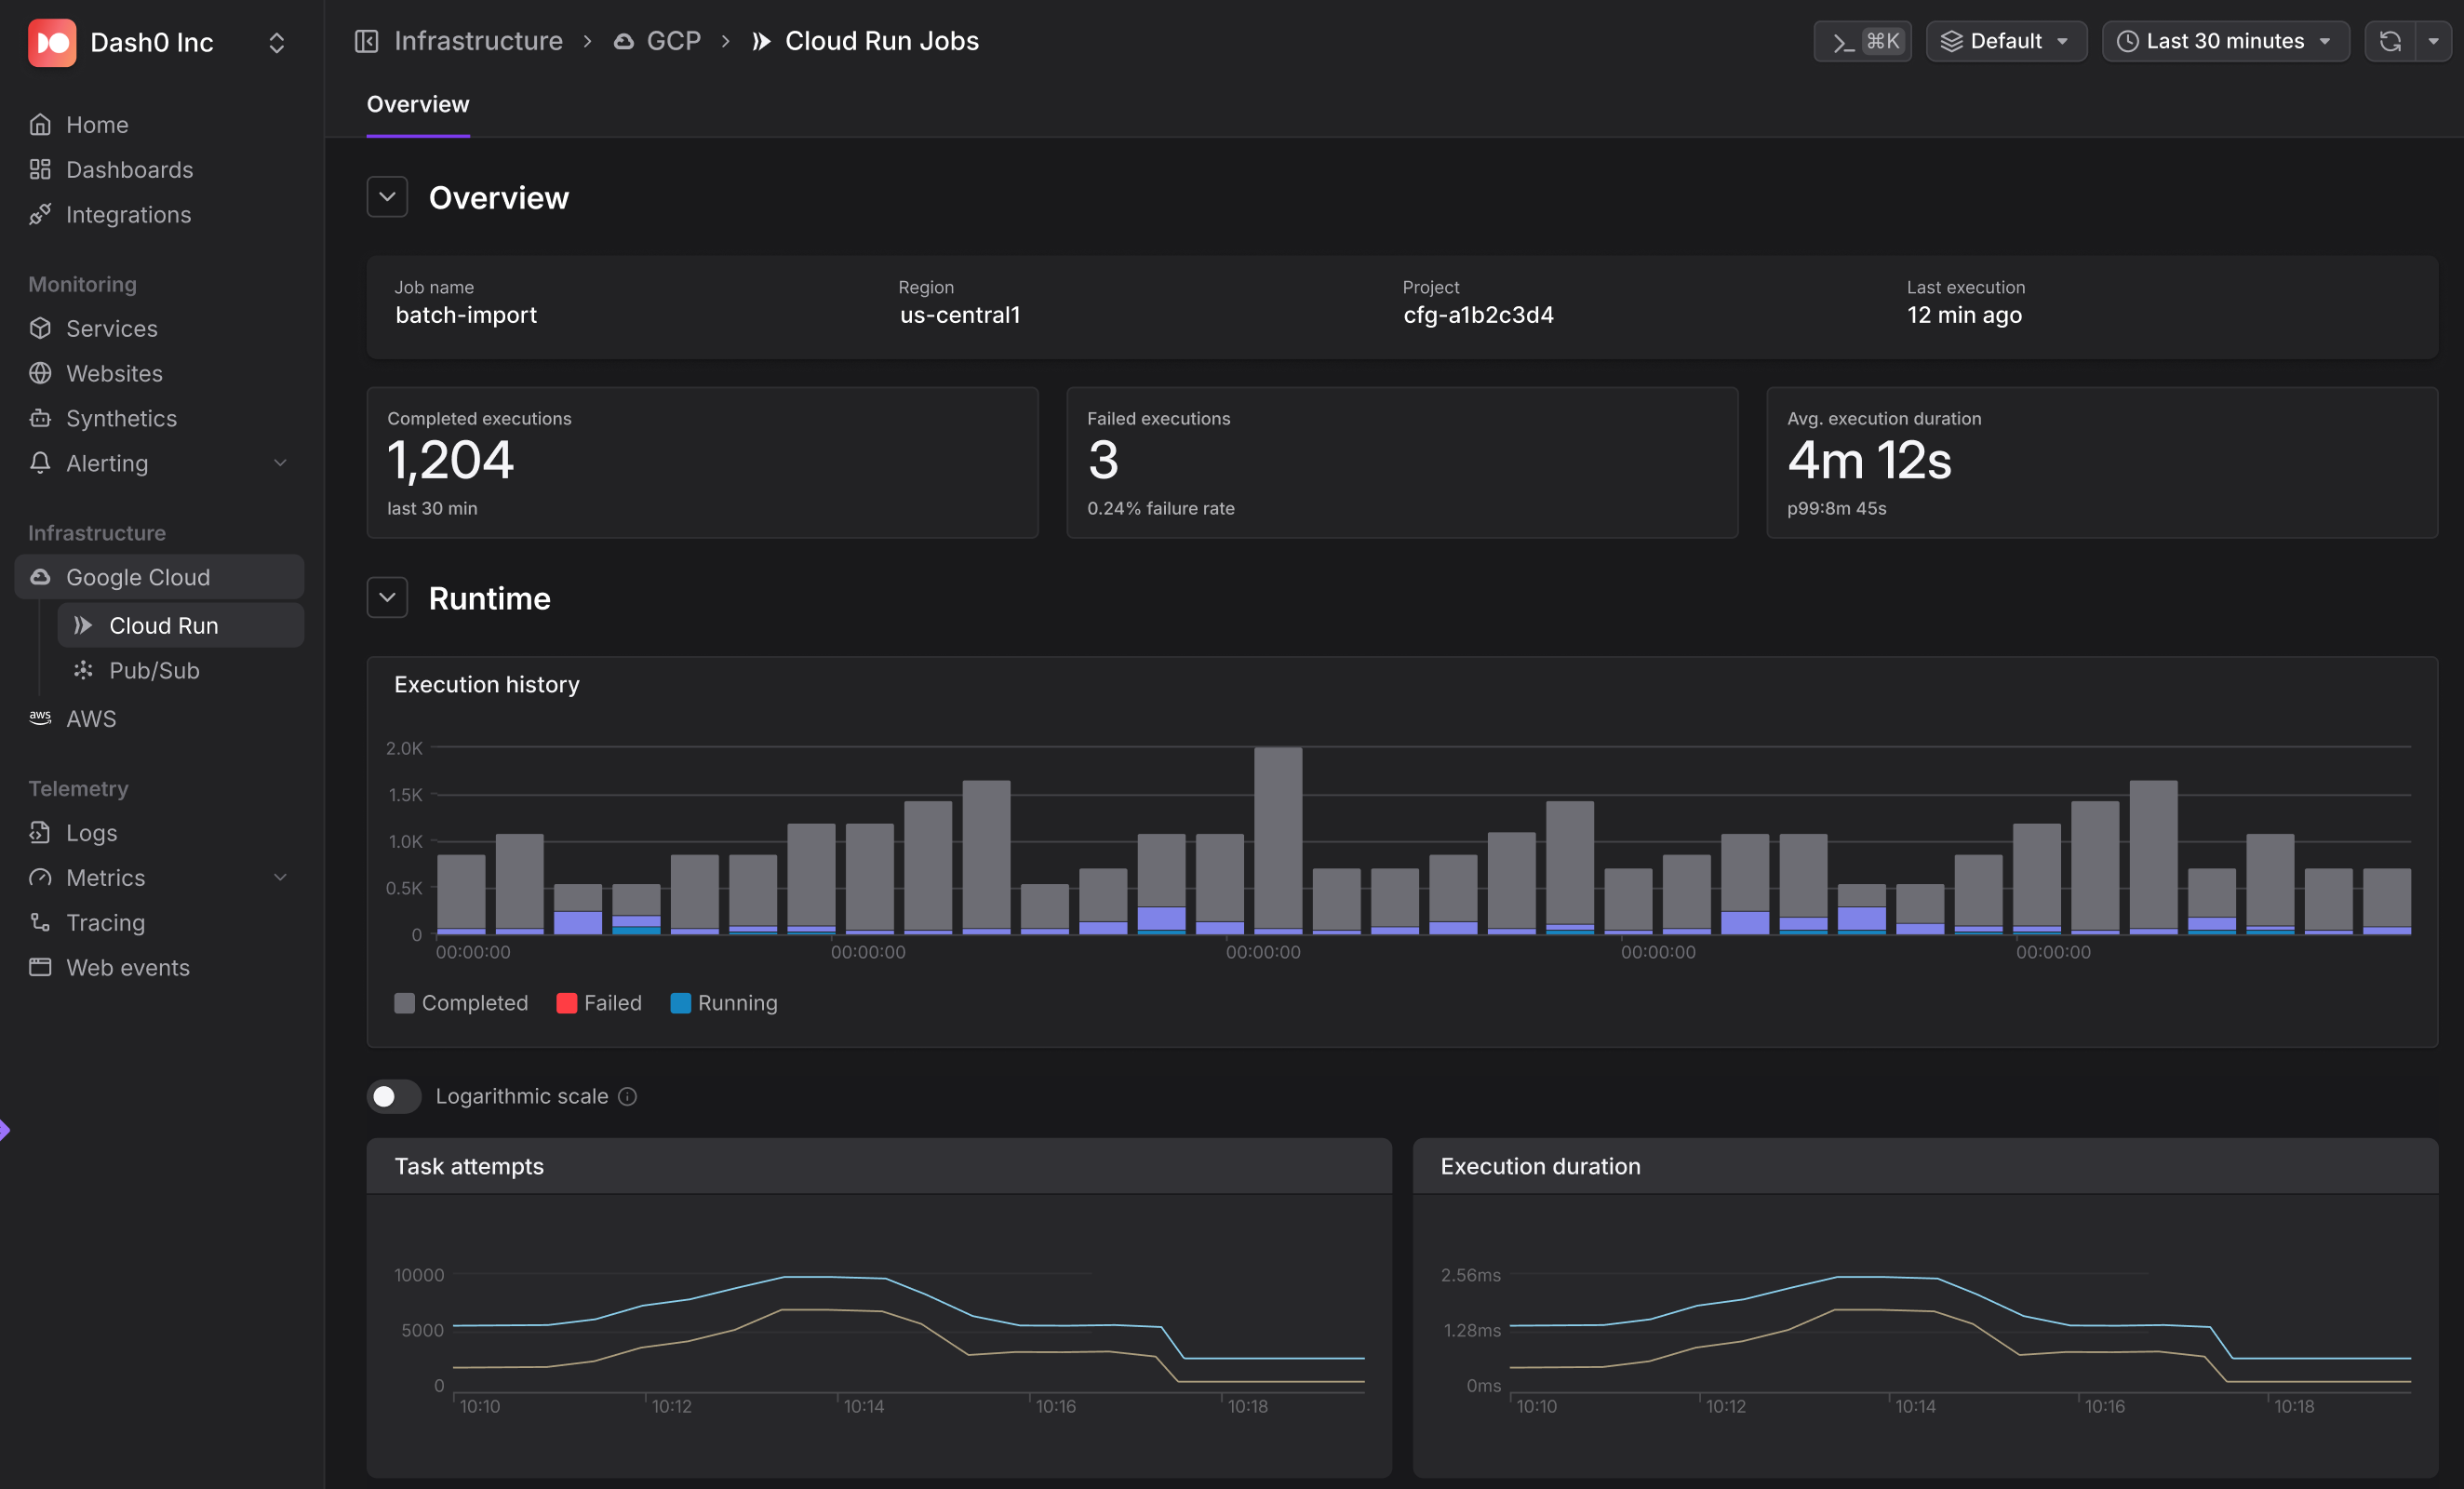
Google Cloud Infrastructure Monitoring
A new Dash0 early access: zero-config Google Cloud infrastructure monitoring. Connect a GCP project via OAuth, and Dash0 discovers resources and starts streaming metrics for Cloud Run, Pub/Sub, and Cloud Storage immediately. No agents. No YAML. No per-resource configuration. The deliberate choice here: pull metrics through GCP's APIs rather than deploy a collector. For serverless and managed services, that's often the right pattern - sometimes "supports OTel" should mean meeting the cloud where it actually is.
The thread running through this issue: doing OpenTelemetry well, when nobody's grading you - 1,000 microservices at Skyscanner, 100M samples/sec at Airbnb, ingress controllers running quietly at the edge, and an entire industry letting go of the bridge that got us here. The bootstrap chapter is closed. The grown-up engineering work is the chapter we're in now.
Quick shout-out: huge thanks to John Hayes over at Observability 360 for featuring Michele Mancioppi's Dash0 agent-skills repo in the latest issue - "a set of rules and skills that you can install into your coding assistant to build enterprise quality instrumentation into your code." Genuinely appreciated. Go subscribe if you don't already.
Until next time: may your collectors be tidy, your hyperscale migrations be dual-emitted, and your traces start at the actual beginning of the story.
Kasper, out.
Hi, my name is Kasper!
I'm Kasper Borg Nissen, Director of Product Marketing & Developer Relations at Dash0. I'm passionate about Observability and bridging the gap toward developers through Platform Engineering. I've previously worked 8 years as a platform engineer, I'm a former co-chair of KubeCon+CloudNativeCon, and I'm genuinely obsessed with all things cloud-native and open standards.
