Most organizations already have observability. Agents are deployed, dashboards exist, alerts fire, and there is a budget line that grows every year. What they don't have is an observability product: something with defined users, opinionated defaults, documentation, and a lifecycle.
That sounds like semantics. It isn't. Capability describes what exists somewhere in your organization. Product describes how it reaches the people who need it, and what happens when it doesn't fit their case. Observability nearly always exists as a capability. It rarely exists as a product, and that gap explains why so many teams collect more telemetry every year and understand their systems no better.
In 2019, Bryan Liles stood on a KubeCon keynote stage and asked the community to go and find Kubernetes' Rails moment. We did, more or less. It was called platform engineering. Observability is still looking for its own, and I have spent the past year arguing on stage about where to look.
Somewhere in there the argument stopped being mine. The industry gave it a name, ran a survey, and turned it into a position platform teams now claim to hold. The name is shift down. Nearly half say it describes their strategy. Very few have built it. That gap between the strategy and the build is what the rest of this post is actually about.
The decade of shifting left
For about ten years, the answer to any capability gap was to shift it left. Shift testing left. Shift security left. Shift observability left. Catch problems earlier, closer to the person who wrote the code.
The cost landed on developers.
I watched this from inside a bank, where I was a platform engineer while we moved onto Kubernetes. We did what everyone did. We handed developers Dockerfiles, manifests, ingress rules and a wiki page, and called it empowerment. What we had actually done was take a set of genuinely hard infrastructure problems and distribute them across every team in the company, so each one could solve them slightly differently and slightly wrong.
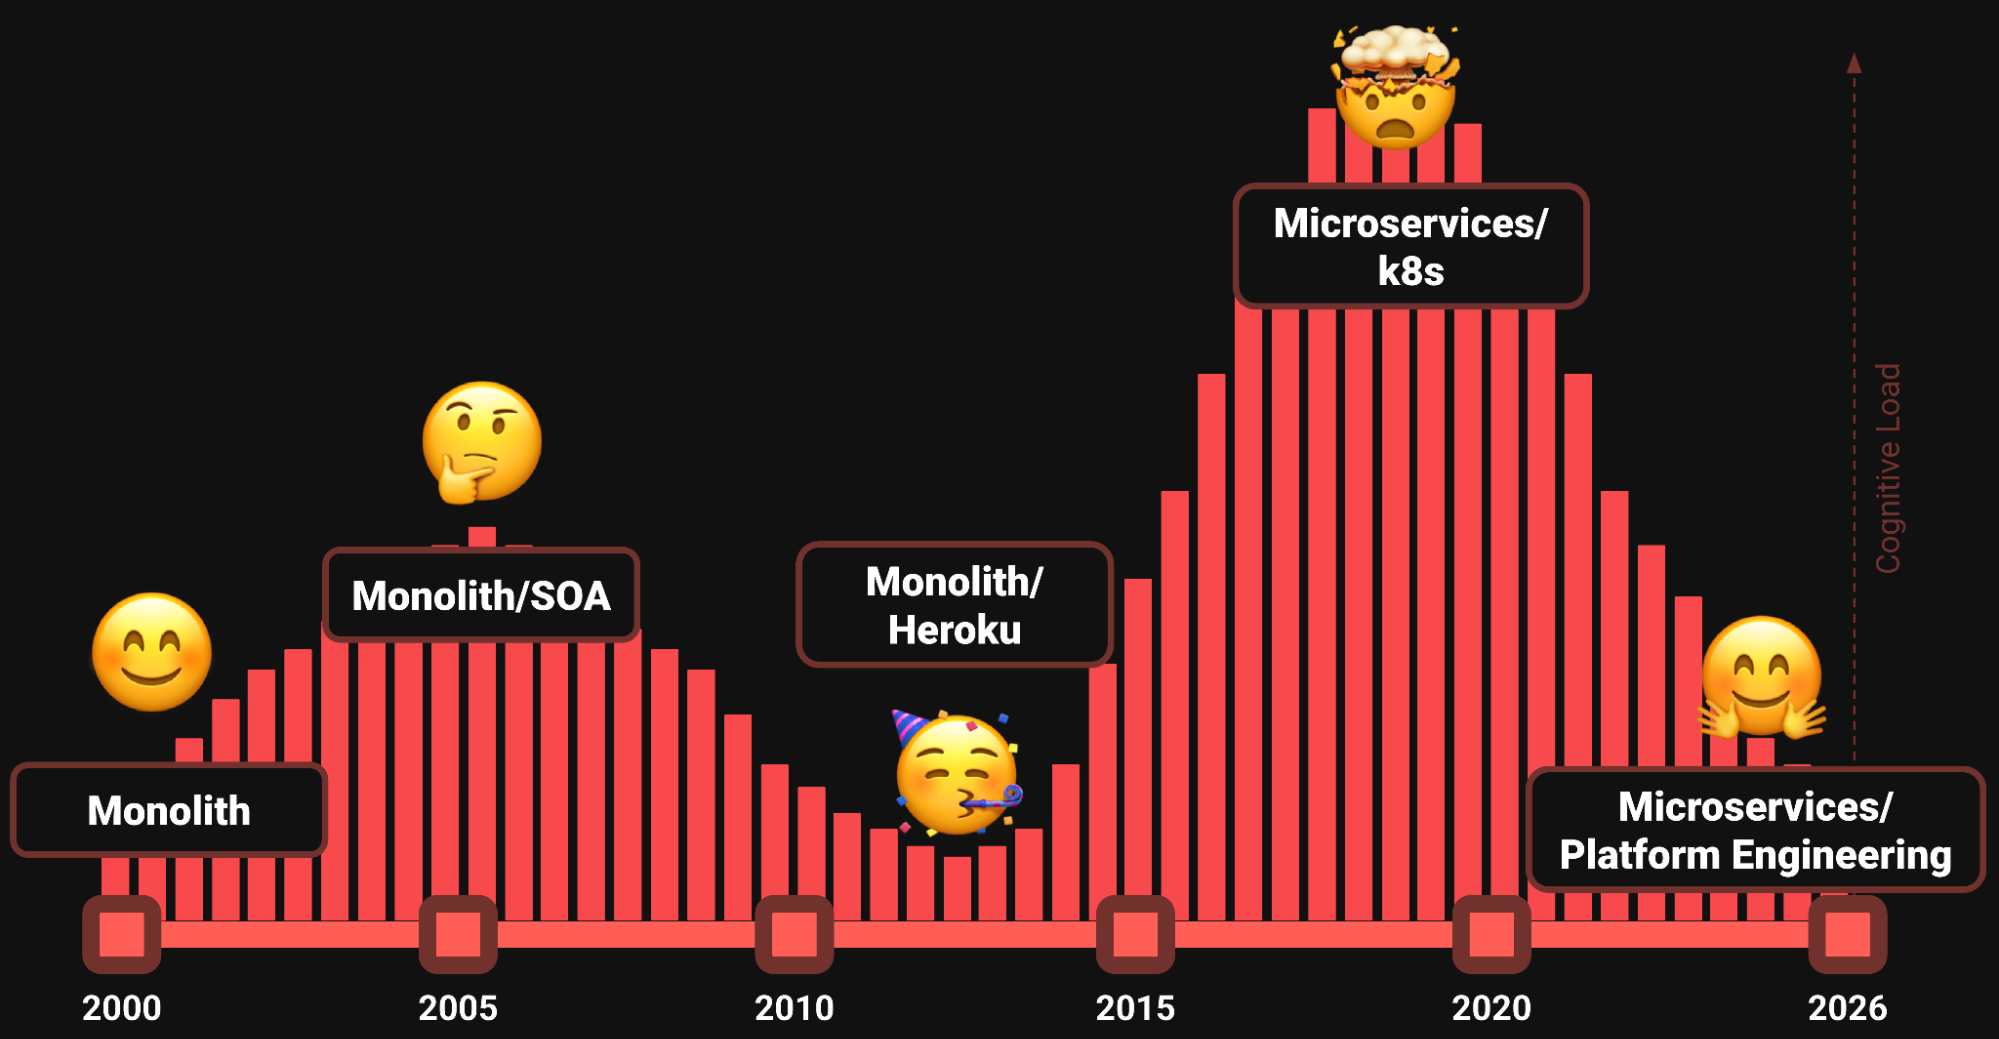
Daniel Bryant has a way of visualizing what that did, and I have been reusing his framing in talks ever since. Plot developer cognitive load against time and you don't get a straight line. Monoliths in the early 2000s kept the boundaries clear: developers wrote code, operations ran infrastructure. Service-oriented architectures pushed the line up, because now the network was the developer's problem too. Then Heroku arrived and the curve dropped hard. git push heroku master, and your application was running on somebody else's problem.
Then containers, microservices and Kubernetes showed up, and the curve went almost vertical.
Kubernetes earned that complexity, and this isn't a complaint about it. Bryan Liles made the point better than I can in his 2019 KubeCon keynote, In Search of the Kubernetes "Rails" Moment. Kubernetes runs on bare metal, in VMs, in other people's clouds, on a Raspberry Pi, across multiple containers and networking and storage runtimes. "Kubernetes complexity is necessary complexity," he said, and people who call it too hard are usually only thinking about their own problem.
His argument was that Rails didn't win by shipping more primitives than anyone else. It won on convention over configuration: good defaults, easy to override, and an opinionated path from empty directory to running application. The line I keep coming back to is his description of the job itself. You are, he said, the principal architect of defaults.
He also said something that has stuck with me ever since: Kubernetes is a vehicle taking us to our destination, not the destination itself. We keep treating it as a product when it isn't one. It's a fancy car.
So the problem was never too much power. Ship primitives without defaults and you haven't removed the assembly work, you've moved it onto the user. That is the gap platform engineering stepped into.
Platform engineering was the correction
Platform teams didn't remove Kubernetes. The raw power stayed exactly where it was. A layer went in between, and that layer absorbed the complexity instead of distributing it. Developers stopped writing manifests and started consuming self-service APIs, templates, golden paths and guardrails. GitOps gave a lot of organizations something close to the Heroku experience again, on infrastructure they controlled.
Evan Bottcher's definition is the one I keep coming back to:
A digital platform is a foundation of self-service APIs, tools, services, knowledge and support arranged as a compelling internal product.
Compelling. Not adequate, not mandated. A developer who could bypass the platform chooses not to, because what they get is better than what they would build themselves. Team Topologies makes the same point from the org side: a platform team exists to provide a compelling internal product that accelerates stream-aligned teams.
So platform teams learned to think in products. They started conducting user research with their own developers. Documentation. Versioned interfaces, feedback loops, adoption treated as a signal rather than a mandate. Backstage gave a lot of organizations a front door. Golden paths became standard vocabulary.
That work is a decade deep for infrastructure and CI/CD. It has barely started for observability.
Observability is repeating the mistake
The pattern rhymes uncomfortably well with early Kubernetes. Powerful primitives, an enormous ecosystem of genuinely good tools, total flexibility, no default experience.
The promise was faster root cause analysis, lower MTTR, real understanding of system behavior including the failure modes nobody predicted. Those outcomes are achievable. I have seen teams get there. But what most engineers actually experience is a different set of questions. Where do I start? Which of these tools is the right one? Why is this metric spiking, and what shipped this component?
Then something breaks. One browser tab for metrics, another for logs, a third for traces. Maybe a fourth for cloud monitoring and a fifth for RUM if the problem might be in the browser. You copy an ID out of one system and paste it into another. You translate between three query languages and juggle between three mental models of what the data even is. You reconstruct the sequence of events by hand.
That's human correlation. We made engineers the integration layer between observability tools, and it doesn't scale. It gets worse as the system grows and worse again at three in the morning.
The same causes come up every time I ask platform teams why. Every signal type ships its own query language, so during an incident you debug syntax alongside the system. Instrumentation was historically vendor-specific, so lock-in starts at the deepest layer and migrating means touching every codebase. Metadata drifts, so one system calls it service.name, another calls it app, and the join quietly fails. And when all that gets expensive enough, teams skip the deeper instrumentation, add a few logs, and call it done.
The easy conclusion is that the tools are bad. They're not. Most are excellent within their scope. We don't have a metrics problem, or a logging problem, or a tracing problem. We have systems problems, and each signal only ever shows one partial view.
That is why I stopped saying three pillars. Three was never the right number, and profiling and real user monitoring are already here. The bigger issue is that the metaphor implies the signals stand apart, when all of the value is in how they connect. A metric with no trace to jump to is a shape on a screen. A trace with no logs underneath is a shape at higher resolution.
The industry has a name for it now
Weave Intelligence, the analyst firm behind PlatformCon, published a market guide on observability trends in platform engineering built on a survey of 105 platform engineers, SREs and operations leaders, fielded in May and June 2026. They state that no vendor commissioned, sponsored or influenced it, and that a sample this size is directional rather than statistically representative. Both caveats are worth carrying.
Asked which statement best describes their observability philosophy for 2026, 47.5% chose shift down: observability as a transparent capability of the platform, with auto-injected OpenTelemetry agents, default dashboards and managed telemetry pipelines. 36.6% chose shift left, where developers instrument their own code. 12.9% are still traditional, with a central reliability team building all the dashboards.
Their definition is the cleanest statement of the idea I have seen written down:
Observability is no longer only a capability that platform teams provide to developers. It has become a capability that platform teams embed into the infrastructure so that developers no longer have to proactively take care of it, but get it by design.
That's the correction platform engineering made for Kubernetes, applied one layer up. Absorb the complexity centrally. Deliver simplicity at the edges. Developers shouldn't assemble telemetry, they should inherit it.
Almost nobody has actually built it
A name is not an achievement.
In the same survey, 18% of teams have automated more than half their observability work, counting things like dashboard and alert setup. 39% say adding new metrics or traces still costs them more than 24 hours of feature-to-production time, and 11% say more than a week. 58% named the instrumentation skill gap between developers and SREs as their biggest cultural blocker. Asked whether their setup gives people relevant, actionable insight, 42.6% said yes. The other 57% split between too much noise and alerts that fire without pointing anywhere useful.
Nearly half of platform teams describe shift down as their strategy. Under a fifth have automated the work that strategy implies. Most still have developers hand-instrumenting, losing a day or more per feature, and getting paged by something that doesn't say what broke.
The report's authors put it politely: the vision is widely shared, the execution is not yet widespread. I'd put it less politely. A lot of us are describing a platform we haven't finished building, and that includes earlier versions of my own talks.
None of this is new, either. The CNCF's 2025 annual survey found 47% of organizations naming "cultural changes with the development team" as their number one adoption challenge, ahead of lack of training at 36%. The substrate has been settled for years. The practices around it haven't.
What shifting down actually requires
Closing that gap isn't a strategy problem, it's a build problem. The technical foundation is no longer speculative. We know how to get there. Most of it is mature, and the parts that aren't are visibly improving.
OpenTelemetry is the settled part
OpenTelemetry reaches 49% production use with another 26% evaluating, according to the same CNCF survey. It graduated in May 2026. And in CNCF's 2025 project velocity data it is the second-largest project in the ecosystem, logging 46,707 pull requests and issues across the year against Kubernetes' 40,559, though Kubernetes still leads comfortably on raw commits. This is mainstream infrastructure now.
What matters for shifting down is the separation it creates. Instrumentation is decoupled from destination. You instrument once and export wherever you choose. The Collector becomes the control point where enrichment, filtering, redaction, sampling and routing live, owned by the platform team instead of copy-pasted across a hundred repositories.
That's what makes it plausibly the last observability agent you install. Changing backend becomes a routing decision instead of a migration that touches every service. You still have to move dashboards, alerts and historical data, so the switch isn't free. But the invasive part, ripping instrumentation out of application code, stops being part of the equation.
One thing OpenTelemetry deliberately does not do is define the product experience. It standardizes how telemetry is produced and transported. It is not storage, not a query language, not a UI. Adopting the standard does not by itself give developers anything they'd call usable, which is exactly what happened with Kubernetes.
Semantic conventions are the shared vocabulary
Engineers don't debug in signals. They debug in layers of context. Who owns this? What service is it? Which container, which runtime, which build? Which cluster and namespace? Which region?
Correlation works when telemetry encodes those layers consistently and breaks when it doesn't. Semantic conventions are what make it consistent: service.name, deployment.environment.name, k8s.cluster.name, cloud.region, http.request.method, http.response.status_code. Not magic, and not AI. Structured metadata that means the same thing everywhere.
One gap is worth being honest about, because it's the layer people ask me about most and the one I can't point them to. The conventions cover infrastructure, compute, platform and architecture well. The organizational layer, who owns this service and who you call at 2am, still isn't covered by stable conventions. Work is underway. Until it lands, OpenTelemetry Weaver lets you define and enforce your own, which beats waiting for the spec.
Operators are the delivery mechanism
Conventions on their own are documentation, and documentation that says "please remember to enable tracing" is not a product. Something has to make the default happen without anyone choosing it.
In Kubernetes that something is an operator. The OpenTelemetry Operator gives you an Instrumentation custom resource where the platform team defines where telemetry goes and how it's configured. Annotate a pod and the operator injects zero-code instrumentation at deploy time for .NET, Java, Node.js, Python or Go. Zero-code is the term the project now uses for instrumenting without touching application source, and it is the whole ballgame for a platform team, because it is the only approach that scales to services the platform team has never seen.
I demo this at conferences because the shape lands better than the description. A developer scaffolds a service from a template, writes the business logic, deploys. There's nothing observability-related in the code at all. The service appears in the distributed trace immediately, parented correctly to the calls around it, carrying cluster and namespace and deployment attributes, context propagating across the boundary. Nobody did anything to make that happen except deploy.
Coverage isn't uniform and I won't pretend otherwise. Some language ecosystems are considerably better instrumented than others, and auto-instrumentation occasionally conflicts with application frameworks. Treat it as a strong default with known edges.
Developers still own the part only they can write
None of this says developers should stop caring about observability. It says the opposite, by clearing space for the part that needs them.
Adriana Villela gave a talk at Cloud Native Bergen last year called Observability Is a Team Sport, and the line I took away from it is one she credits to Josh Lee: don't make the developers do everything, but make everyone do observability. Her point is that an observability team operating in a silo defeats its own purpose, because observability touches every part of the development lifecycle.
The way I think about it is a football team. Different positions, different jobs, and the team fails when everyone crowds the same part of the field.
The platform can produce HTTP spans, database calls, queue operations, resource attributes and context propagation, because those are identical everywhere and should be solved once. The platform cannot produce the span that says a settlement completed, or the attribute explaining which fraud rule rejected a payout, or the SLO capturing what this team promises its callers. Write those on a developer's behalf and you get spans that are empty or spans that lie.
The platform provides the scaffolding. The developer provides the meaning. When a developer stops asking how to set up tracing and starts asking what business context to capture, the product is working.
Why this matters more now that agents are involved
I'd make this argument regardless of what's happening in AI. Reducing cognitive load and correlating signals were worth doing in 2019. But the timeline has compressed.
Agents consume telemetry differently than we do. A human investigates serially, one hypothesis at a time. Agentic tooling investigates in parallel, ten or more hypotheses at once, each hitting observability endpoints independently. The Weave guide puts a single LLM query at two to five times the telemetry of a standard log event, with parallel investigation generating query loads an order of magnitude or two beyond what existing architectures were sized for.
The volume isn't the interesting part. Agents reason over structure.
If service.name means the same thing everywhere, an agent can navigate. If cloud.region is consistent, it can scope. If trace context propagates across boundaries, it can follow a request through a system it has never seen. Without conventions, correlation fails. Without correlation, an agent guesses, and a confident guess in fluent prose is worse than no answer.
Garbage in, garbage out, same as it ever was. The survey found 20% of respondents still running proprietary instrumentation exclusively, which the analysts call AI readiness debt. That framing is right. Every investment in telemetry structure pays twice, once in human debugging and once in whatever you connect to it later.
So AI doesn’t remove the need to think about observability at the platform level. It raises the cost of skipping it.
Final thoughts
Observability isn't failing. It's at the point Kubernetes was at in 2019: powerful primitives, an enormous ecosystem, real innovation, no coherent default experience for the people expected to use it. Still in search of its Rails moment.
We solved that for infrastructure by treating the platform as a product, absorbing complexity centrally and leaving documented escape hatches for the cases the defaults don't fit. The same move works here, and most platform teams already believe it. What's left is closing the distance between believing it and having shipped it.
If you want somewhere to start this quarter: deploy the OpenTelemetry Collector as the single place telemetry policy lives, enforce semantic conventions there rather than asking every team to remember them, then put the OpenTelemetry Operator in front so deploying onto your platform is the only thing a developer does to get instrumented. That order is deliberate. Each step makes the next one cheaper.
I work at Dash0, so weigh the next paragraph accordingly. We built OpenTelemetry-native rather than OpenTelemetry-compatible, which means the conventions your platform team enforces are the ones the product reasons about directly, with no proprietary translation layer in between quietly losing things. Agent0, our AI control plane for production, scans the environment continuously, answers questions across telemetry and code in plain language with citations you can check, correlates across signals, and generates dashboards, alerts, runbooks and pull requests that are validated against live telemetry before they ship. It works better when the telemetry underneath has structure, which is this whole post applied to our own software.
If you're earlier in this, we wrote OpenTelemetry for Dummies as a short introduction, and there's more on semantic conventions and on why logs, metrics and traces work better together in our knowledge base.
Build the foundation now. The agents are already showing up, and they'll only ever be as good as the structure you hand them.