

A chart shows latency doubling at 14:02, and the first question is always the same: did we ship something? Today you leave the dashboard, open your delivery pipeline, and line up timestamps by hand. The answer was in your telemetry the whole time, one chart away.
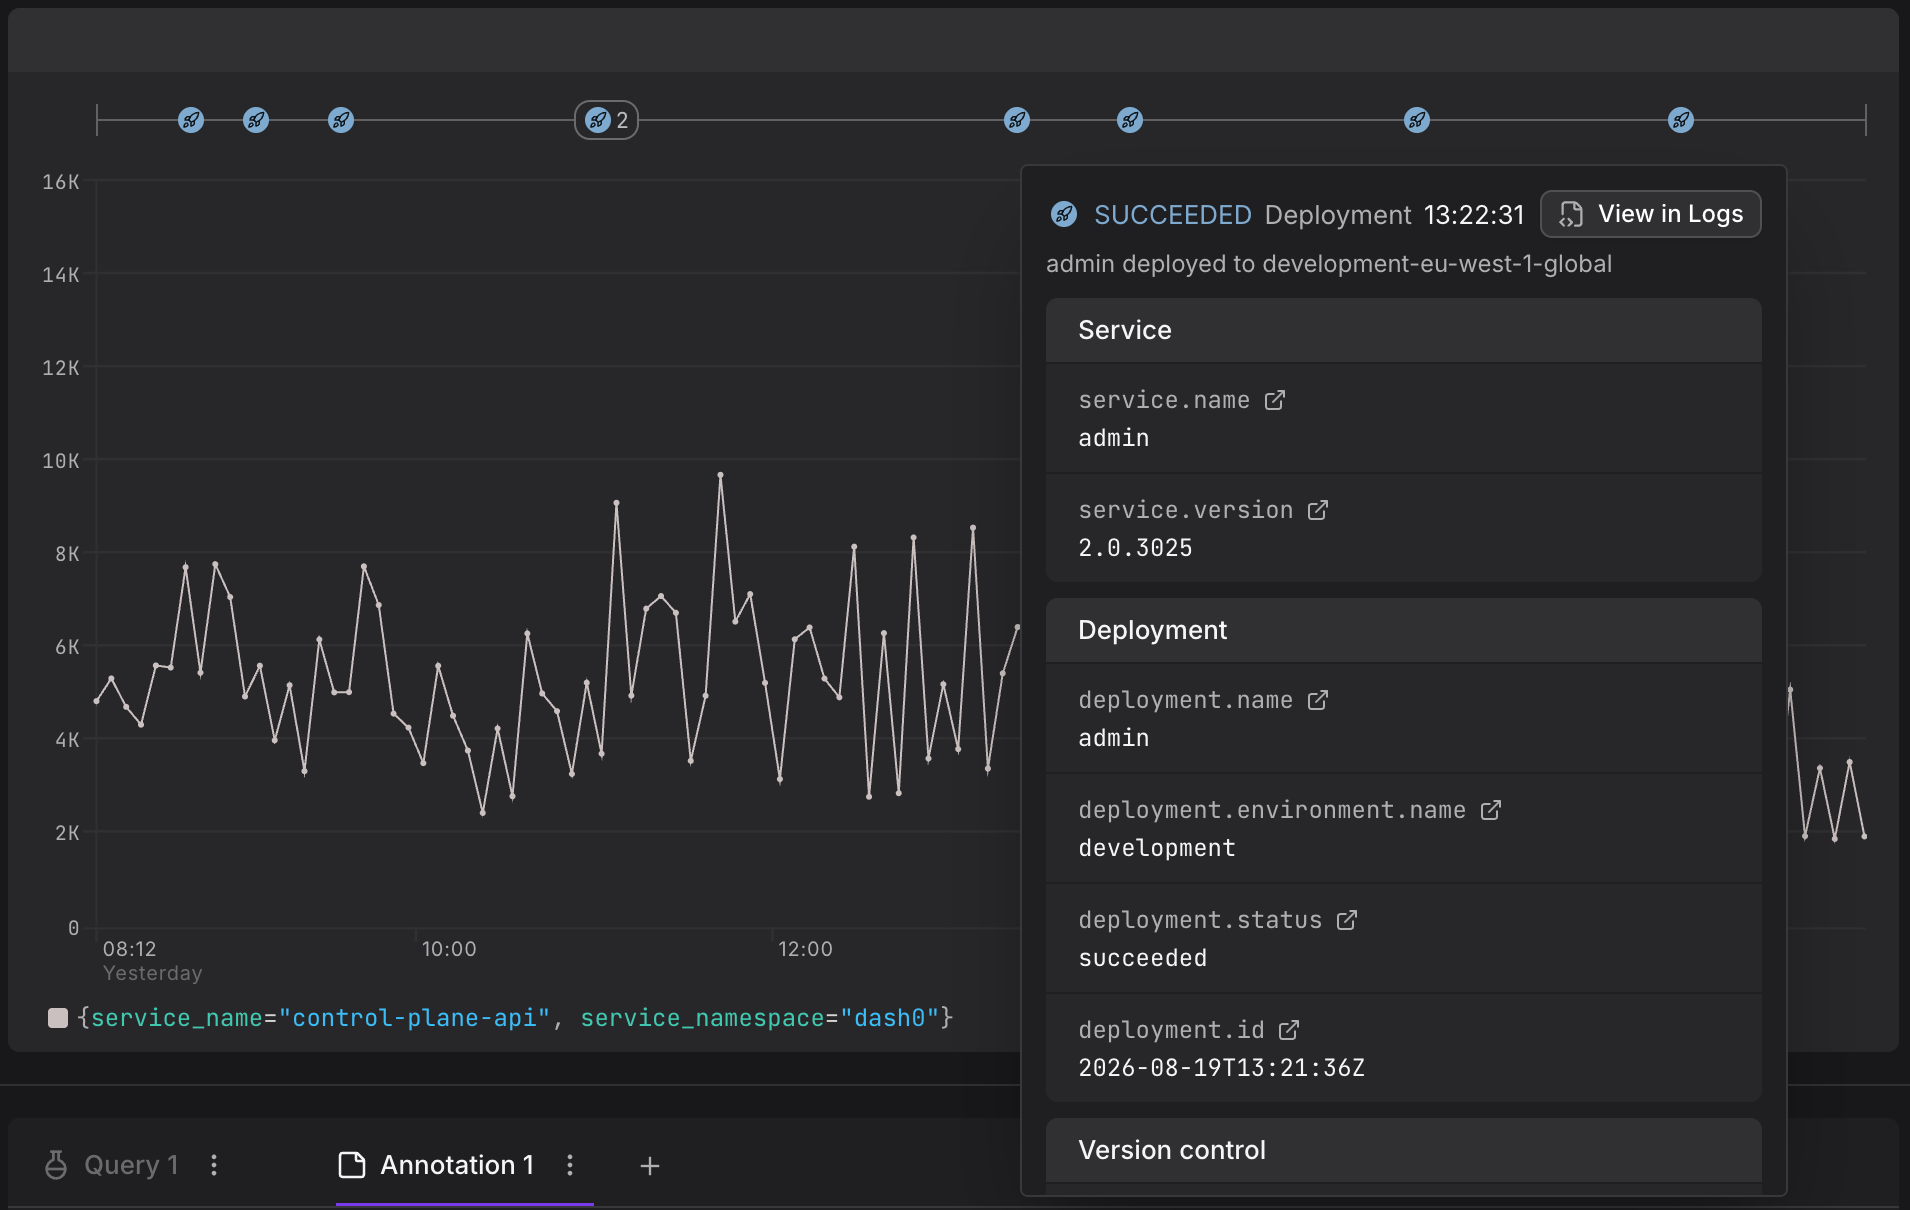
Dash0 now has a Deployments annotation type for time-series panels. Each deployment appears as a marker on the panel timeline, colored by its status, so a failed deployment reads as an error and a successful one stays neutral. Hover a marker to see the deployment's details. The annotation is not scoped to a single service, so one annotation covers everything your pipeline ships, and you can narrow it with filters. Deployments come from log events named dash0.deployment: emit them with the Send Log Event GitHub Action or with dash0 logs send from the Dash0 CLI. See Add Annotations for the setup.