Last updated: October 9, 2026
Code RED Newsletter #39

Two conferences over the last couple of weeks. At GOTO Copenhagen, a lot of the talks circled the same question: what happens to software delivery when AI writes more of the code? The answer that kept coming up wasn't new. The fundamentals still matter, maybe more than before. Writing code got cheaper, trust didn't. I wrote up my notes from GOTO on the blog.
Then Prague, where Adriana Villela and I gave Your Agent Did What? at the first Observability Summit Europe and again at Open Source Summit Europe. Three AI SRE agents, two MCP servers, one production database, and the question of what your telemetry can actually tell you after an agent does something it shouldn't. Usually less than you'd hope, unless you planned for it. My write-up from Observability Summit has the details.
In focus: Trust Didn't Get Cheaper
Most of what caught my eye over the last couple of weeks ties back to that GOTO line. Can you trust that your telemetry isn't quietly carrying someone's credentials? That a Prometheus label and an OpenTelemetry attribute mean the same thing? That a library which "supports OpenTelemetry" emits the conventions? That the release your coding agent just shipped didn't burn the error budget? Generating more doesn't answer any of them.
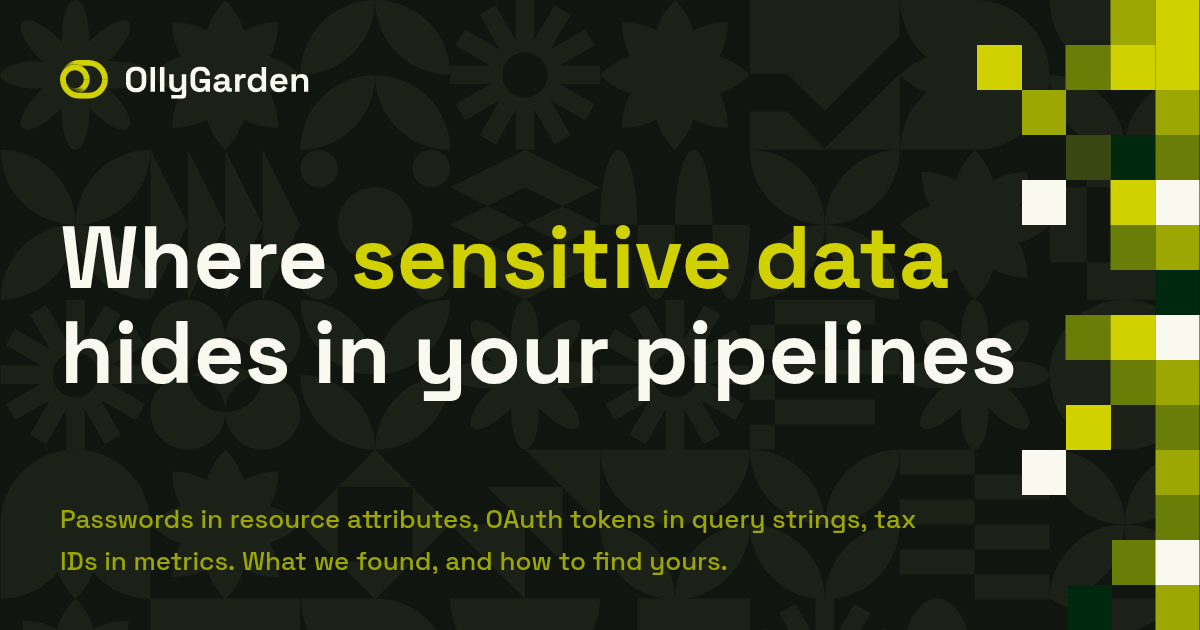
Where Sensitive Data Hides in OpenTelemetry Pipelines, and How to Find It
Juraci Kröhling and the OllyGarden team have been finding sensitive data in real OpenTelemetry pipelines, and the list of hiding places is longer than you'd like: command-line arguments in resource attributes, query strings in url.full, authorization headers, bound parameters in db.query.text, exception messages and, increasingly, AI prompts. The line I keep coming back to: "Most of what we find is a tool doing what it was configured to do." So it's mostly defaults nobody looked at, which makes it a telemetry quality problem. And telemetry quality problems tend to end up on the platform team's desk.
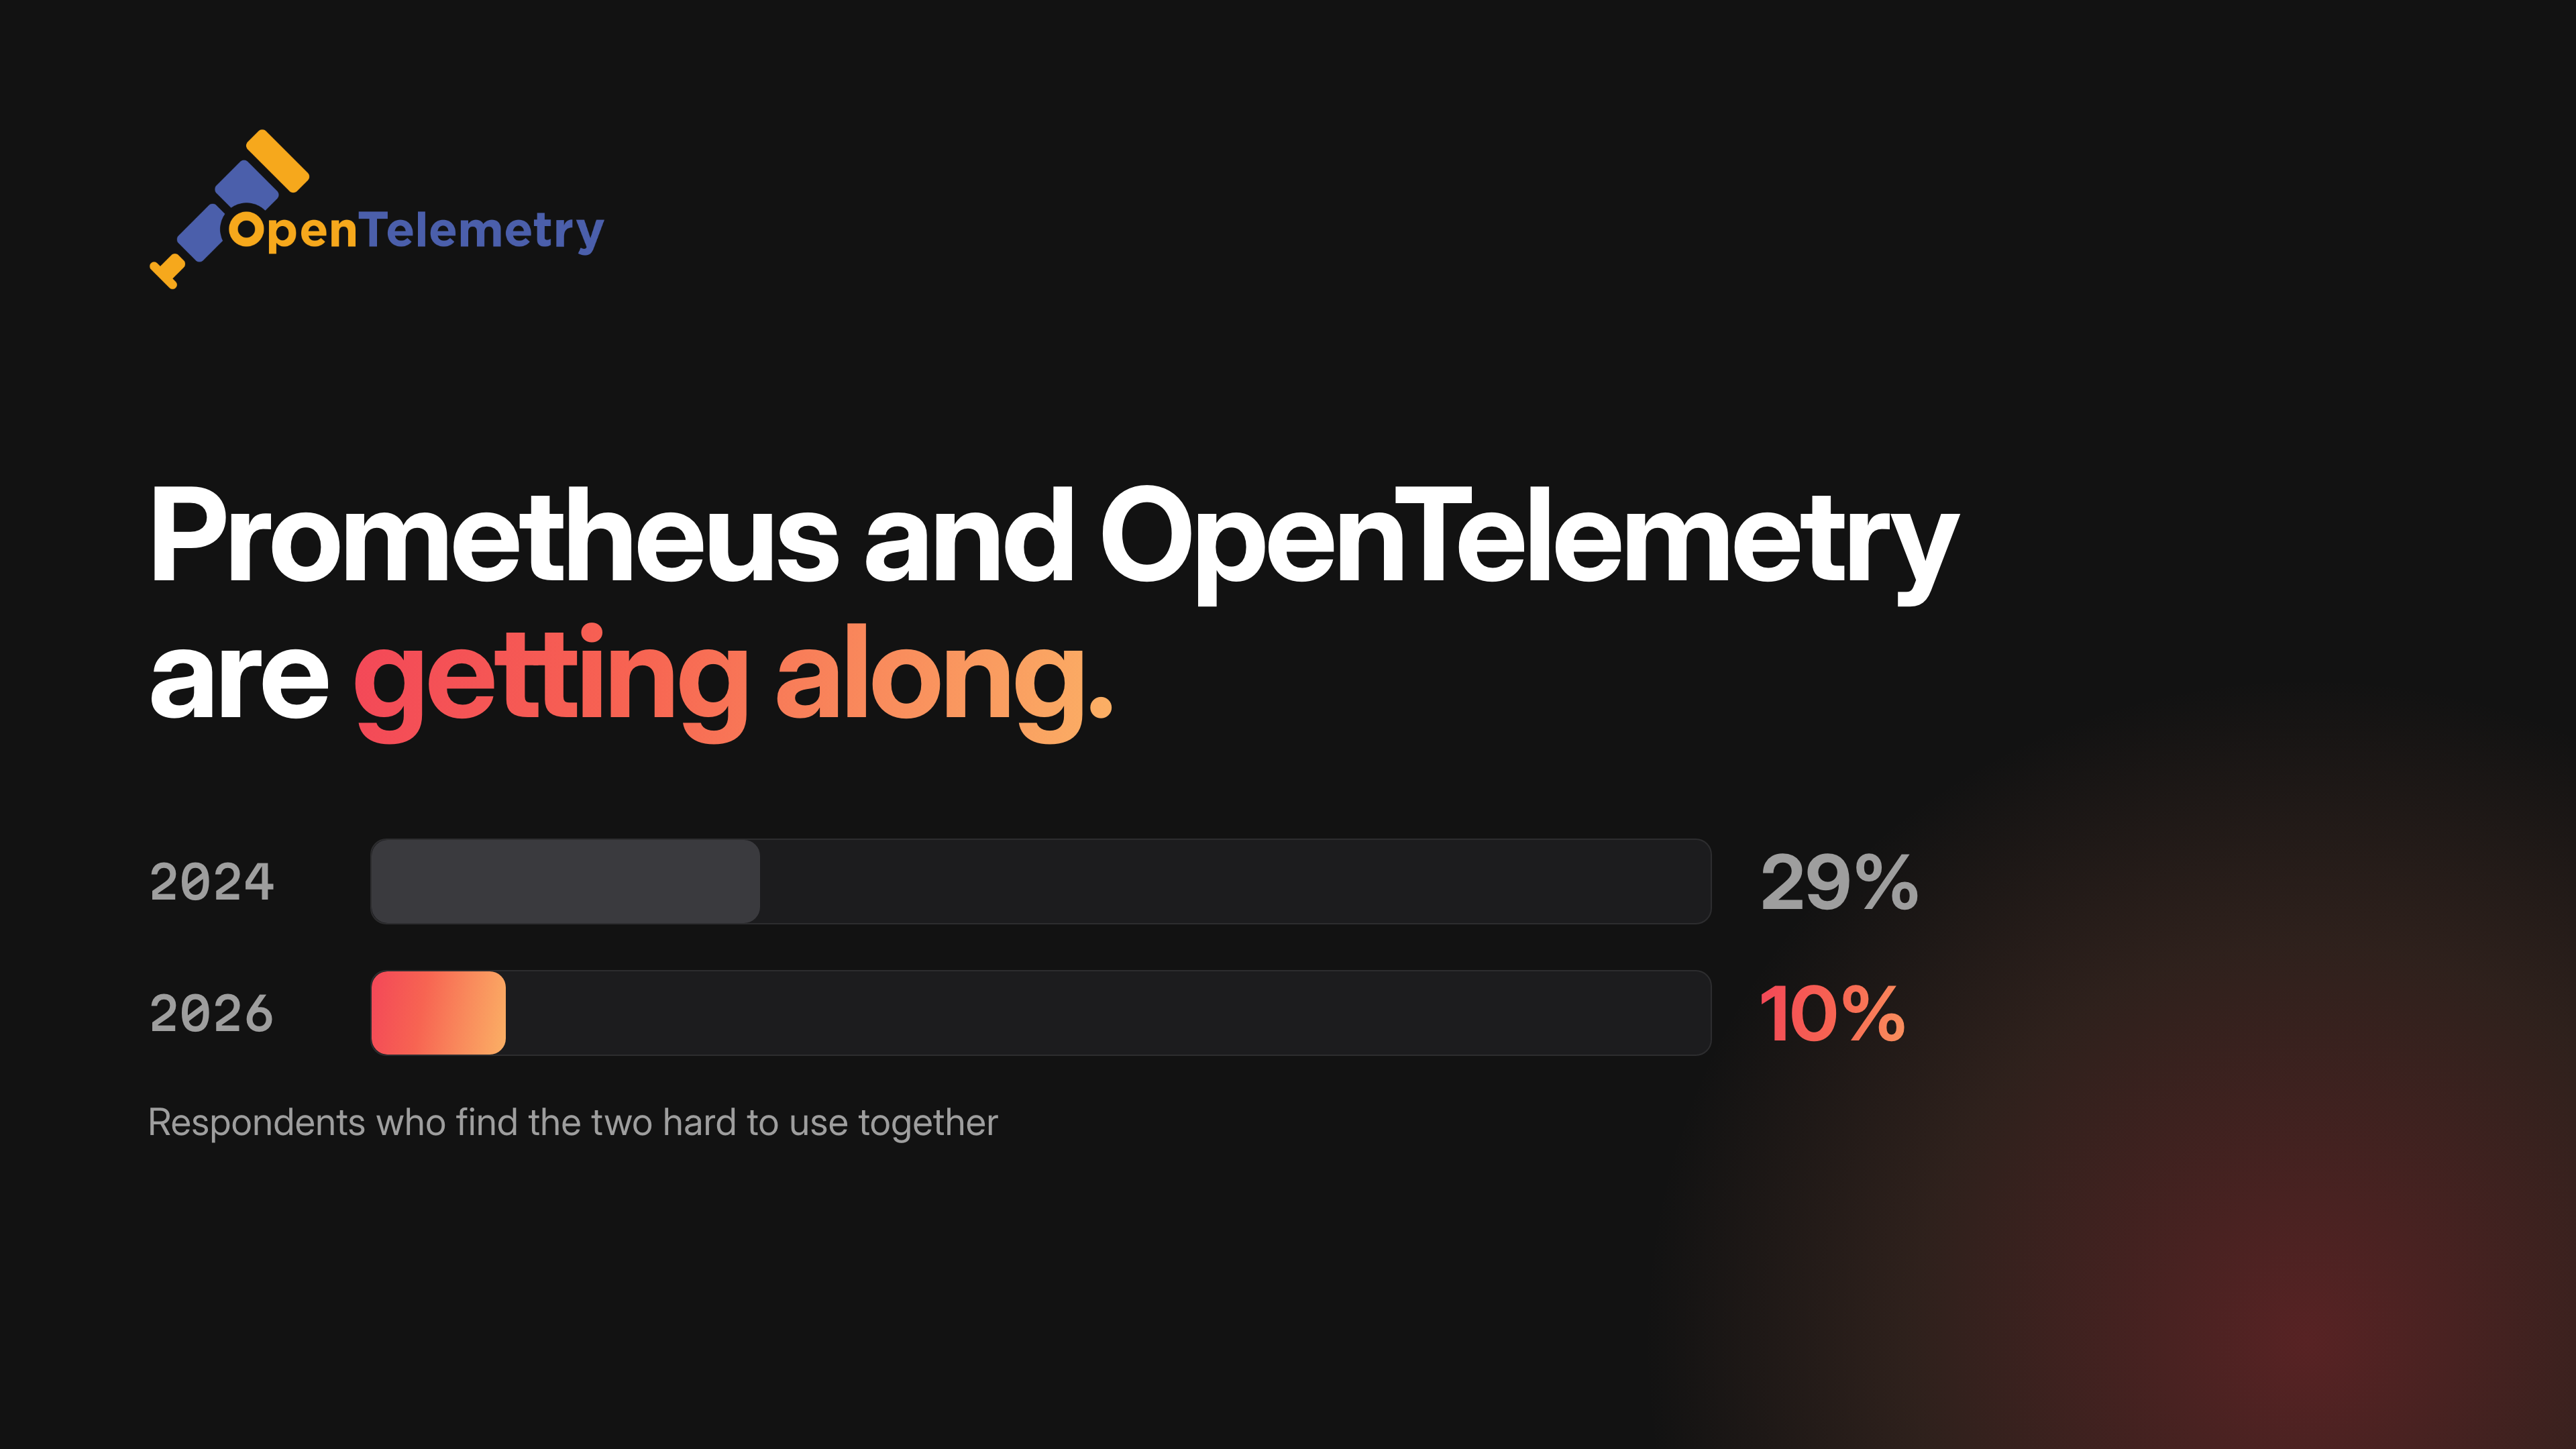
Prometheus and OpenTelemetry interoperability in 2026: Survey results
Two years ago, 29% of respondents found Prometheus and OpenTelemetry hard to use together. This year it's 10%. Almost half now run both for infrastructure metrics, and OTel SDKs lead for application metrics. What's still on the wishlist: data model, resource attributes, naming. In the authors' words, "the picture is clearly hybrid, not either/or." The interesting work now is less about moving the data and more about agreeing on what it means.
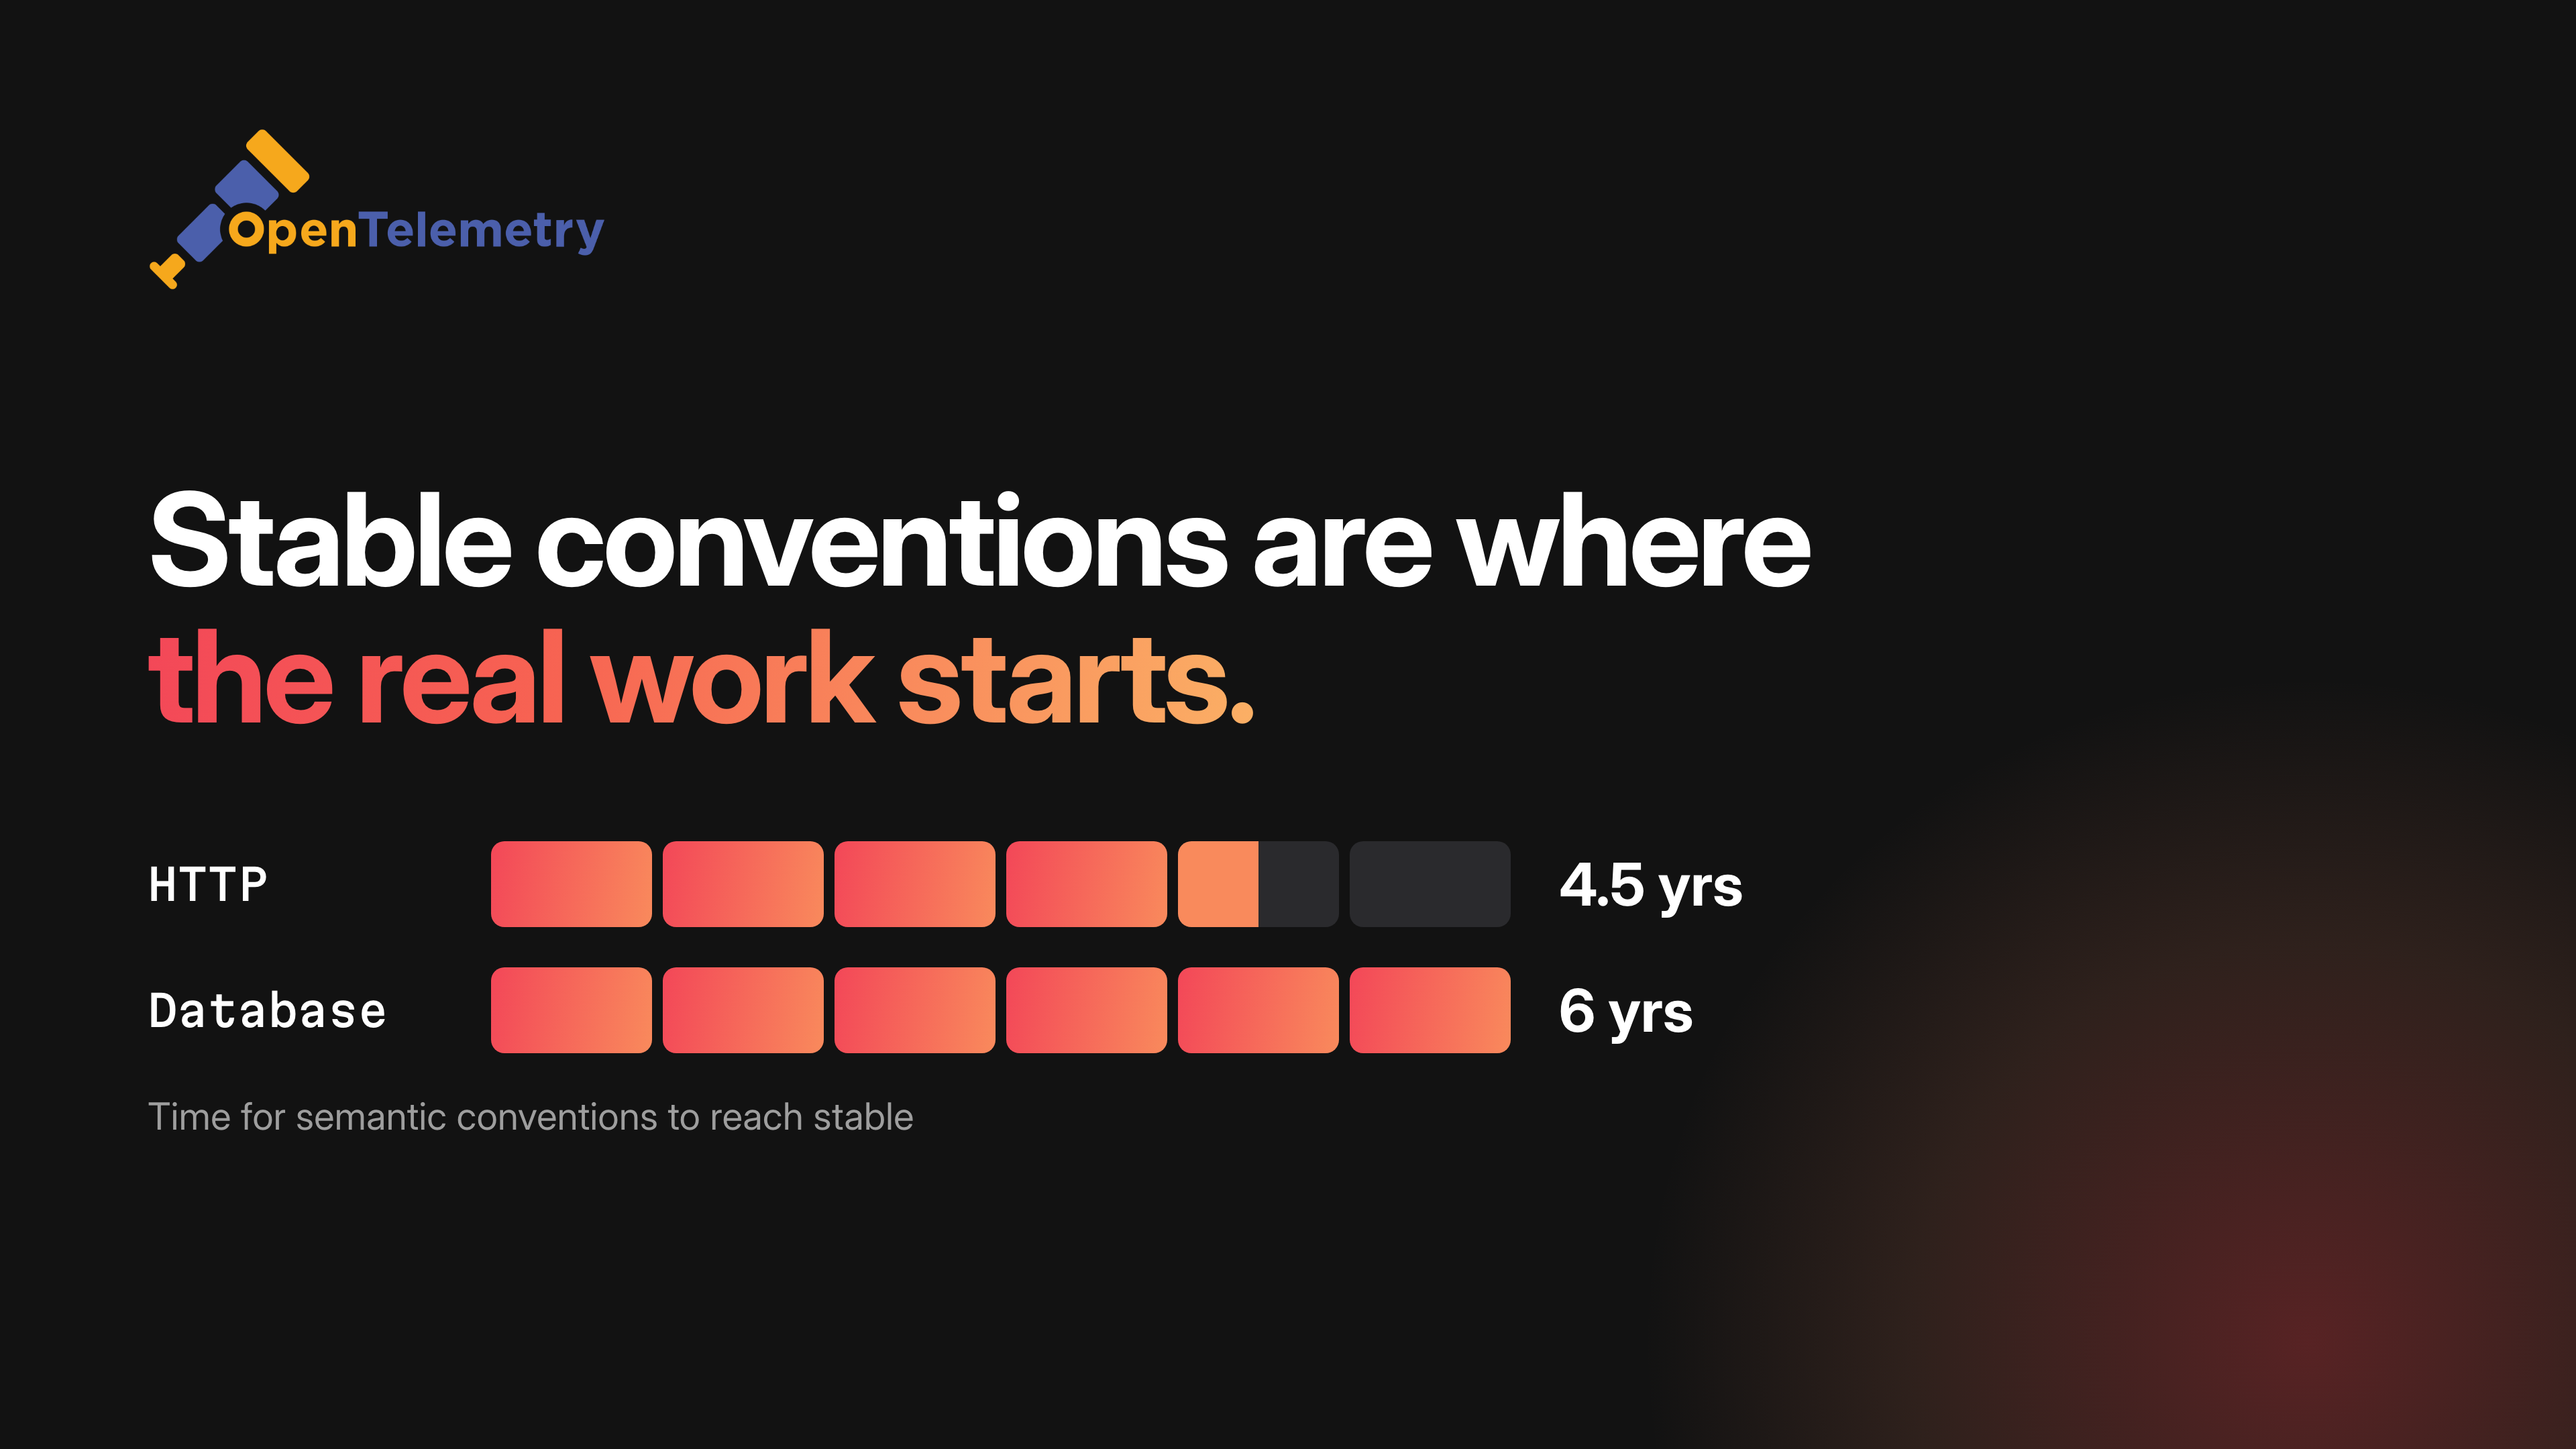
Exploring the OpenTelemetry Instrumentation Ecosystem
HTTP semantic conventions took four and a half years to reach stability. Database conventions took six. Then the real work starts, because "publishing a convention doesn't automatically update the code that implements it." The Ecosystem Explorer team compared HTTP client instrumentation across seven languages: required attributes show up almost everywhere, recommended ones a lot less. That's exactly why "supports OpenTelemetry" tells you so little on its own. At least now there's a place to check what a library actually emits.
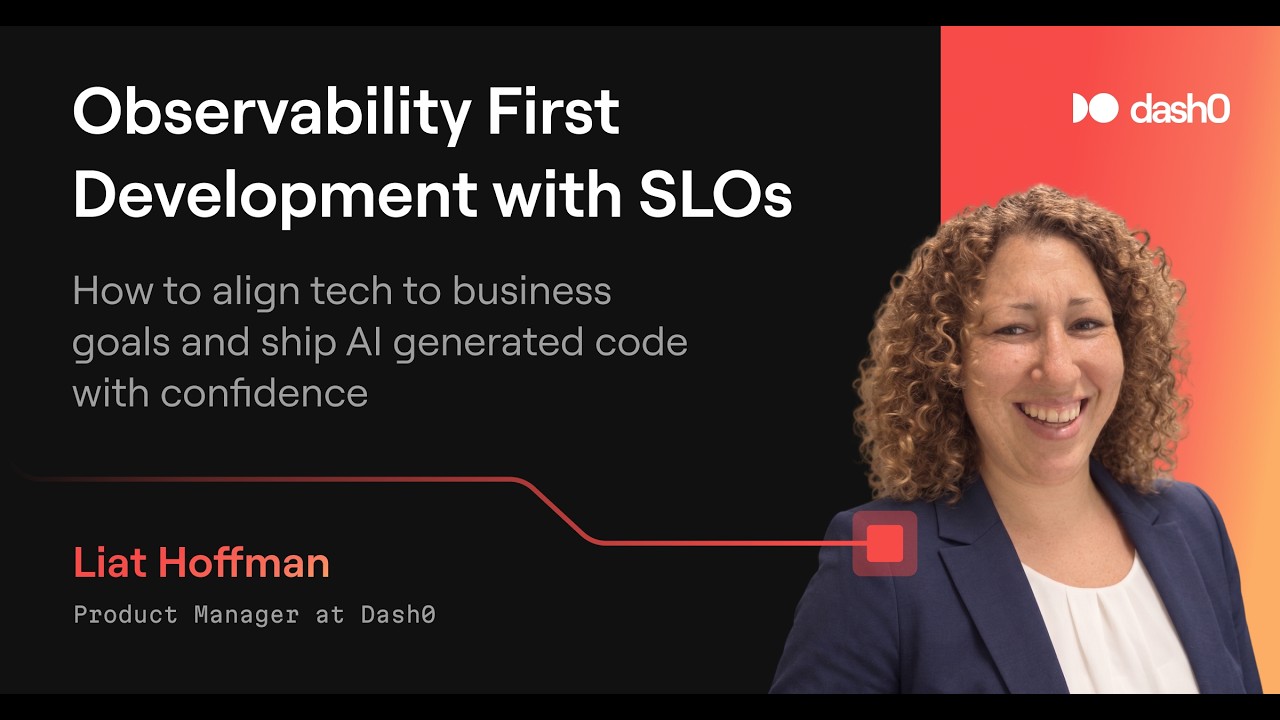
Observability First Development with SLOs
Liat Hoffman, Product Manager at Dash0, pitches observability first development as test-driven development for the AI era: decide what reliable means before the code exists, then let that number judge every release, including the ones your agent wrote. Her favourite part, and mine, is what she calls "the hot sauce": deployment events plotted on the SLO view, so you can see which release spent the error budget and which fix let it recover. And a useful reminder: every extra nine means ten times less error budget. Make sure you actually need it.
From 40 seconds to under 10: rebuilding incident detection on OpenTelemetry, Apache Kafka, and Apache Flink on Kubernetes
Atlassian rebuilt its incident detection on OpenTelemetry, Kafka and Flink. Detection went from over 40 seconds to under 10, and monthly cost from around $20,000 to $650. The numbers are great, but the real takeaway is what the old setup missed: "Silence still looks like health." A database shard that went hard down produced no events, so nothing fired. They also separate recall (is the detector any good?) from coverage (is anything even instrumented?), which is worth doing before you blame your alerting.
Cursor acquired Firetiger. A month later, it launched a bot that tracks code changes from PR to production.
Rustam Lalkaka puts it bluntly: "The cost of creating changes has dropped to near zero. The cost and risk of deploying them has stayed largely the same." Cursor's new Rollouts bot reads a pull request, writes a monitoring plan (gaps in the instrumentation included) and checks the telemetry after the deploy. Its verdicts are verified healthy, regression detected, or inconclusive. I'm glad "inconclusive" made the cut. When a coding agent company starts building for the part after the merge, you know where the bottleneck went.

Choice cuts
A few more things worth reading.
Announcing v1 of OpenTelemetry Go Compile-Time Instrumentation
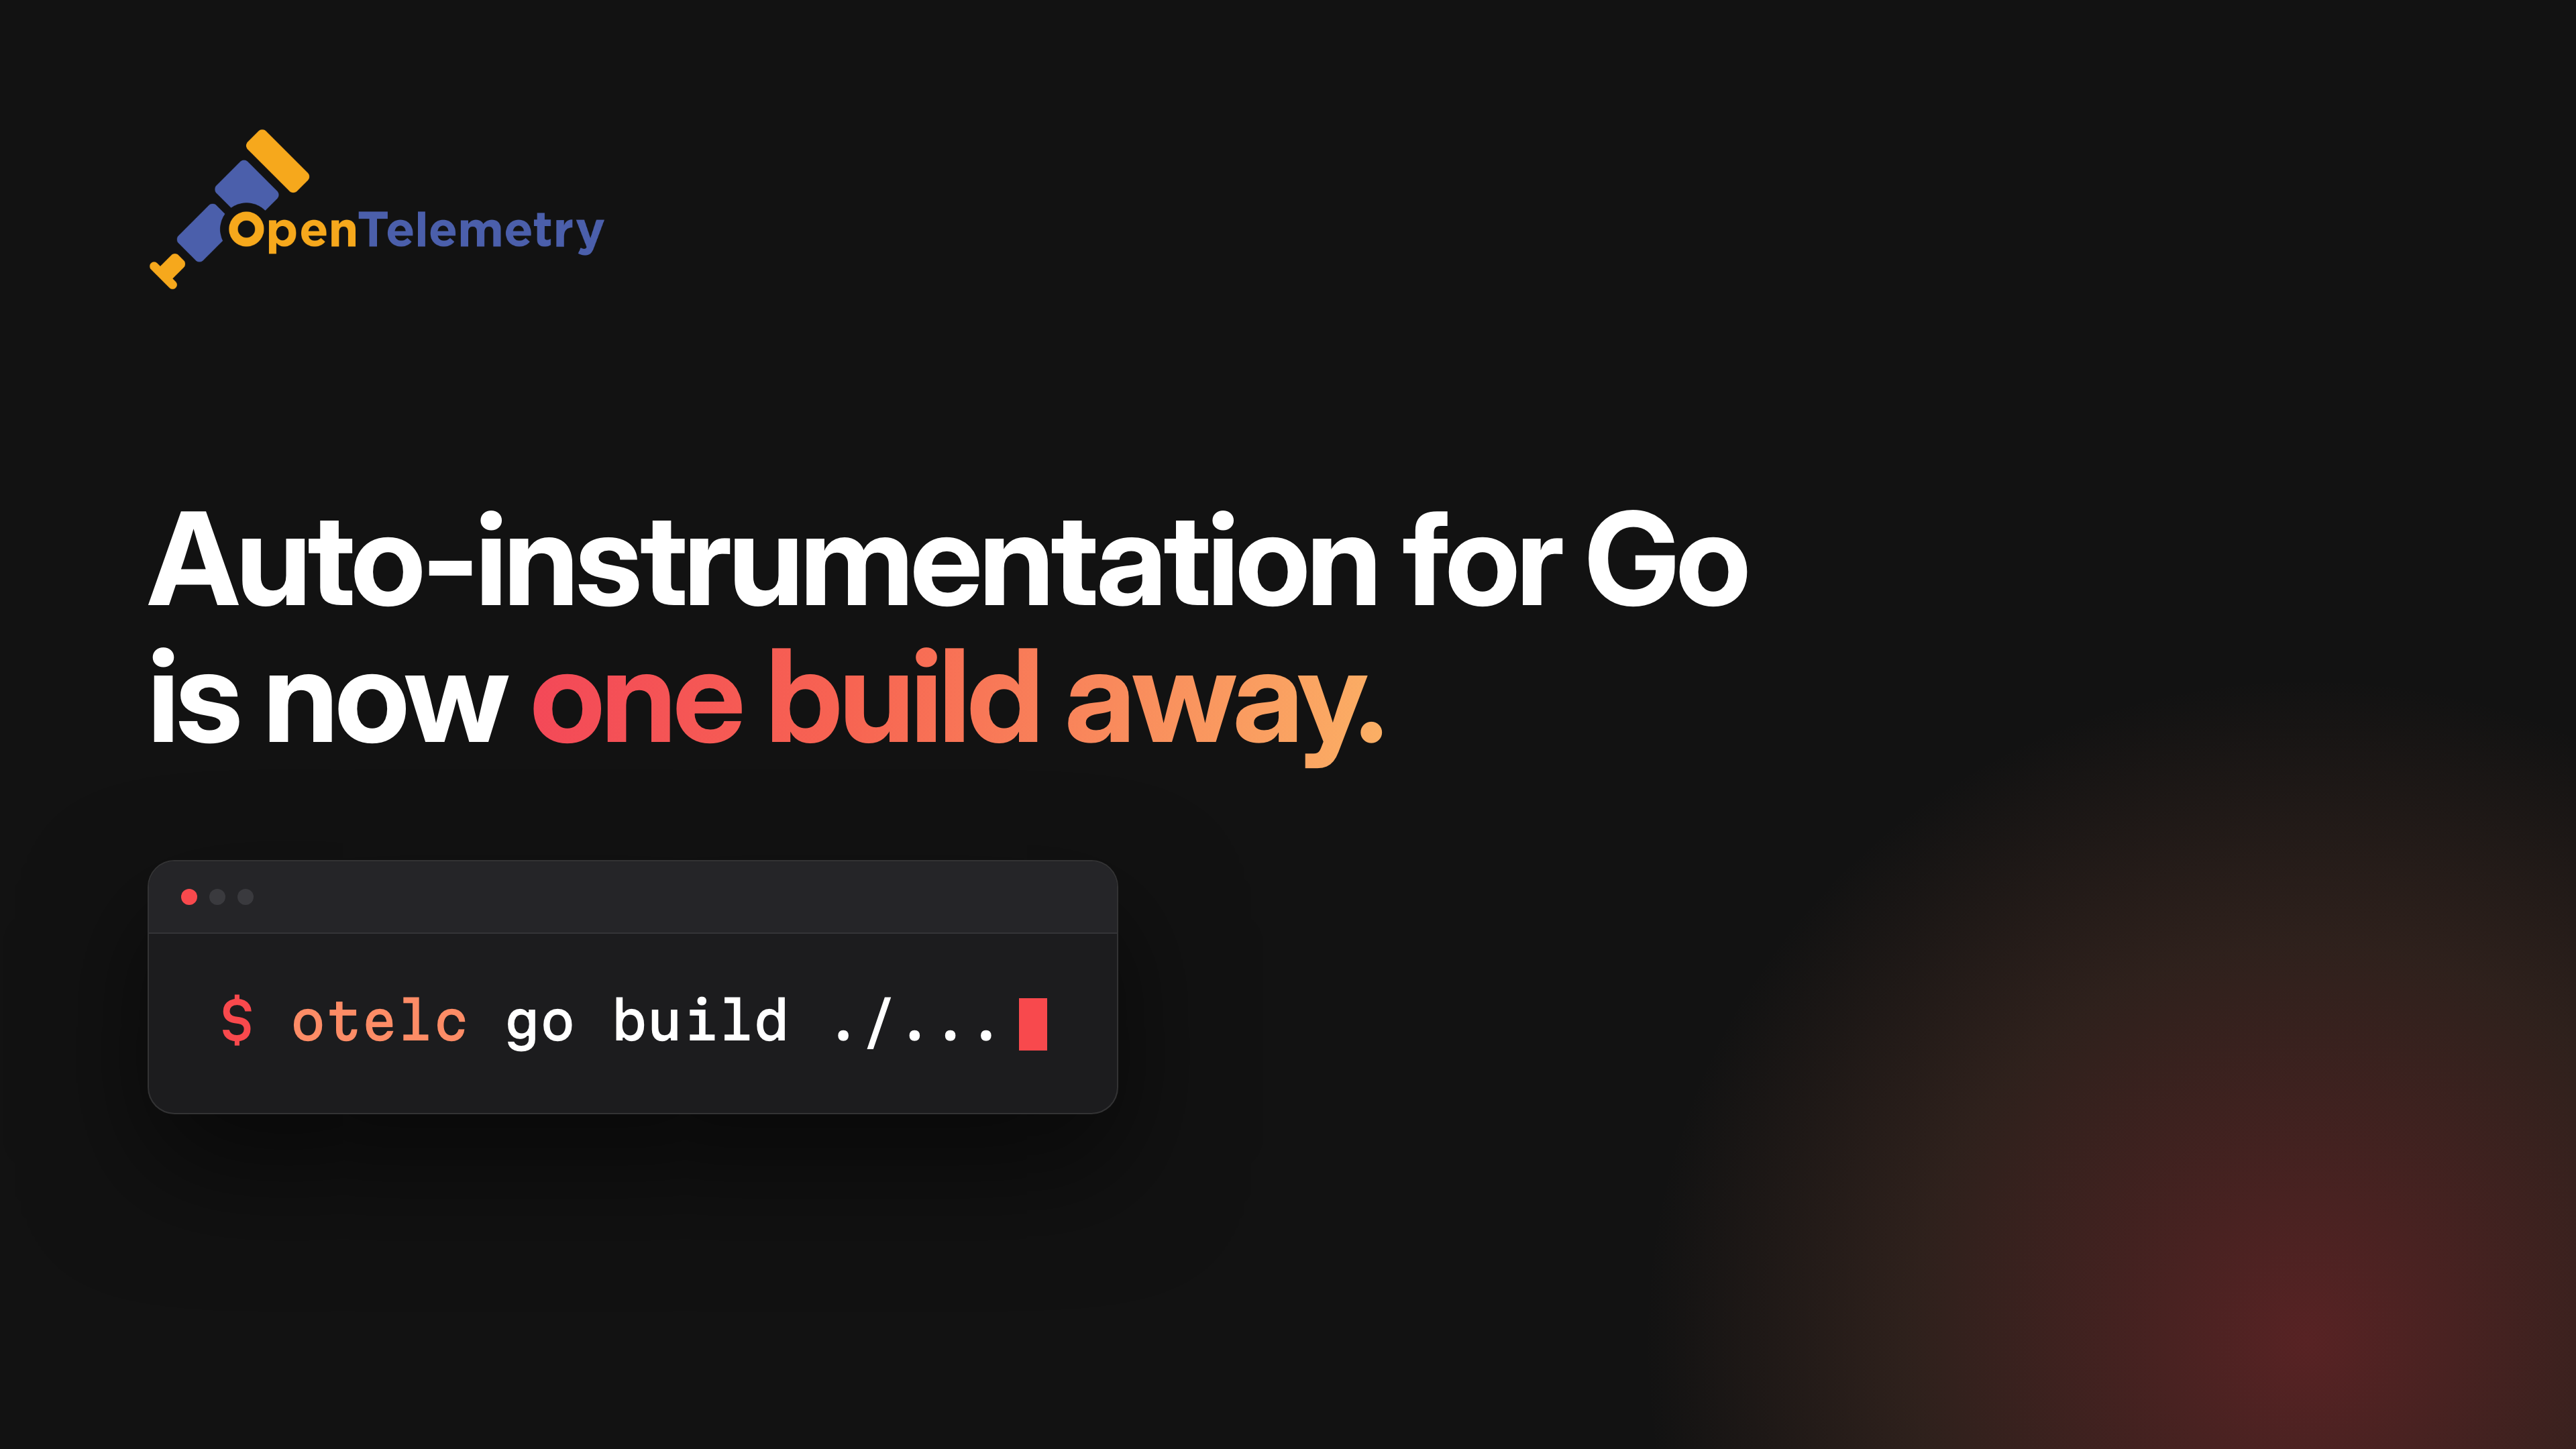
Go has always been tricky for zero-code instrumentation: one static binary, no runtime to hook into. otelc is now stable. Swap go build for otelc go build and you get net/http, database/sql, gRPC, Redis and runtime metrics without touching the code. Built by people from Alibaba, Cabify and Datadog together, which is how this is supposed to work.
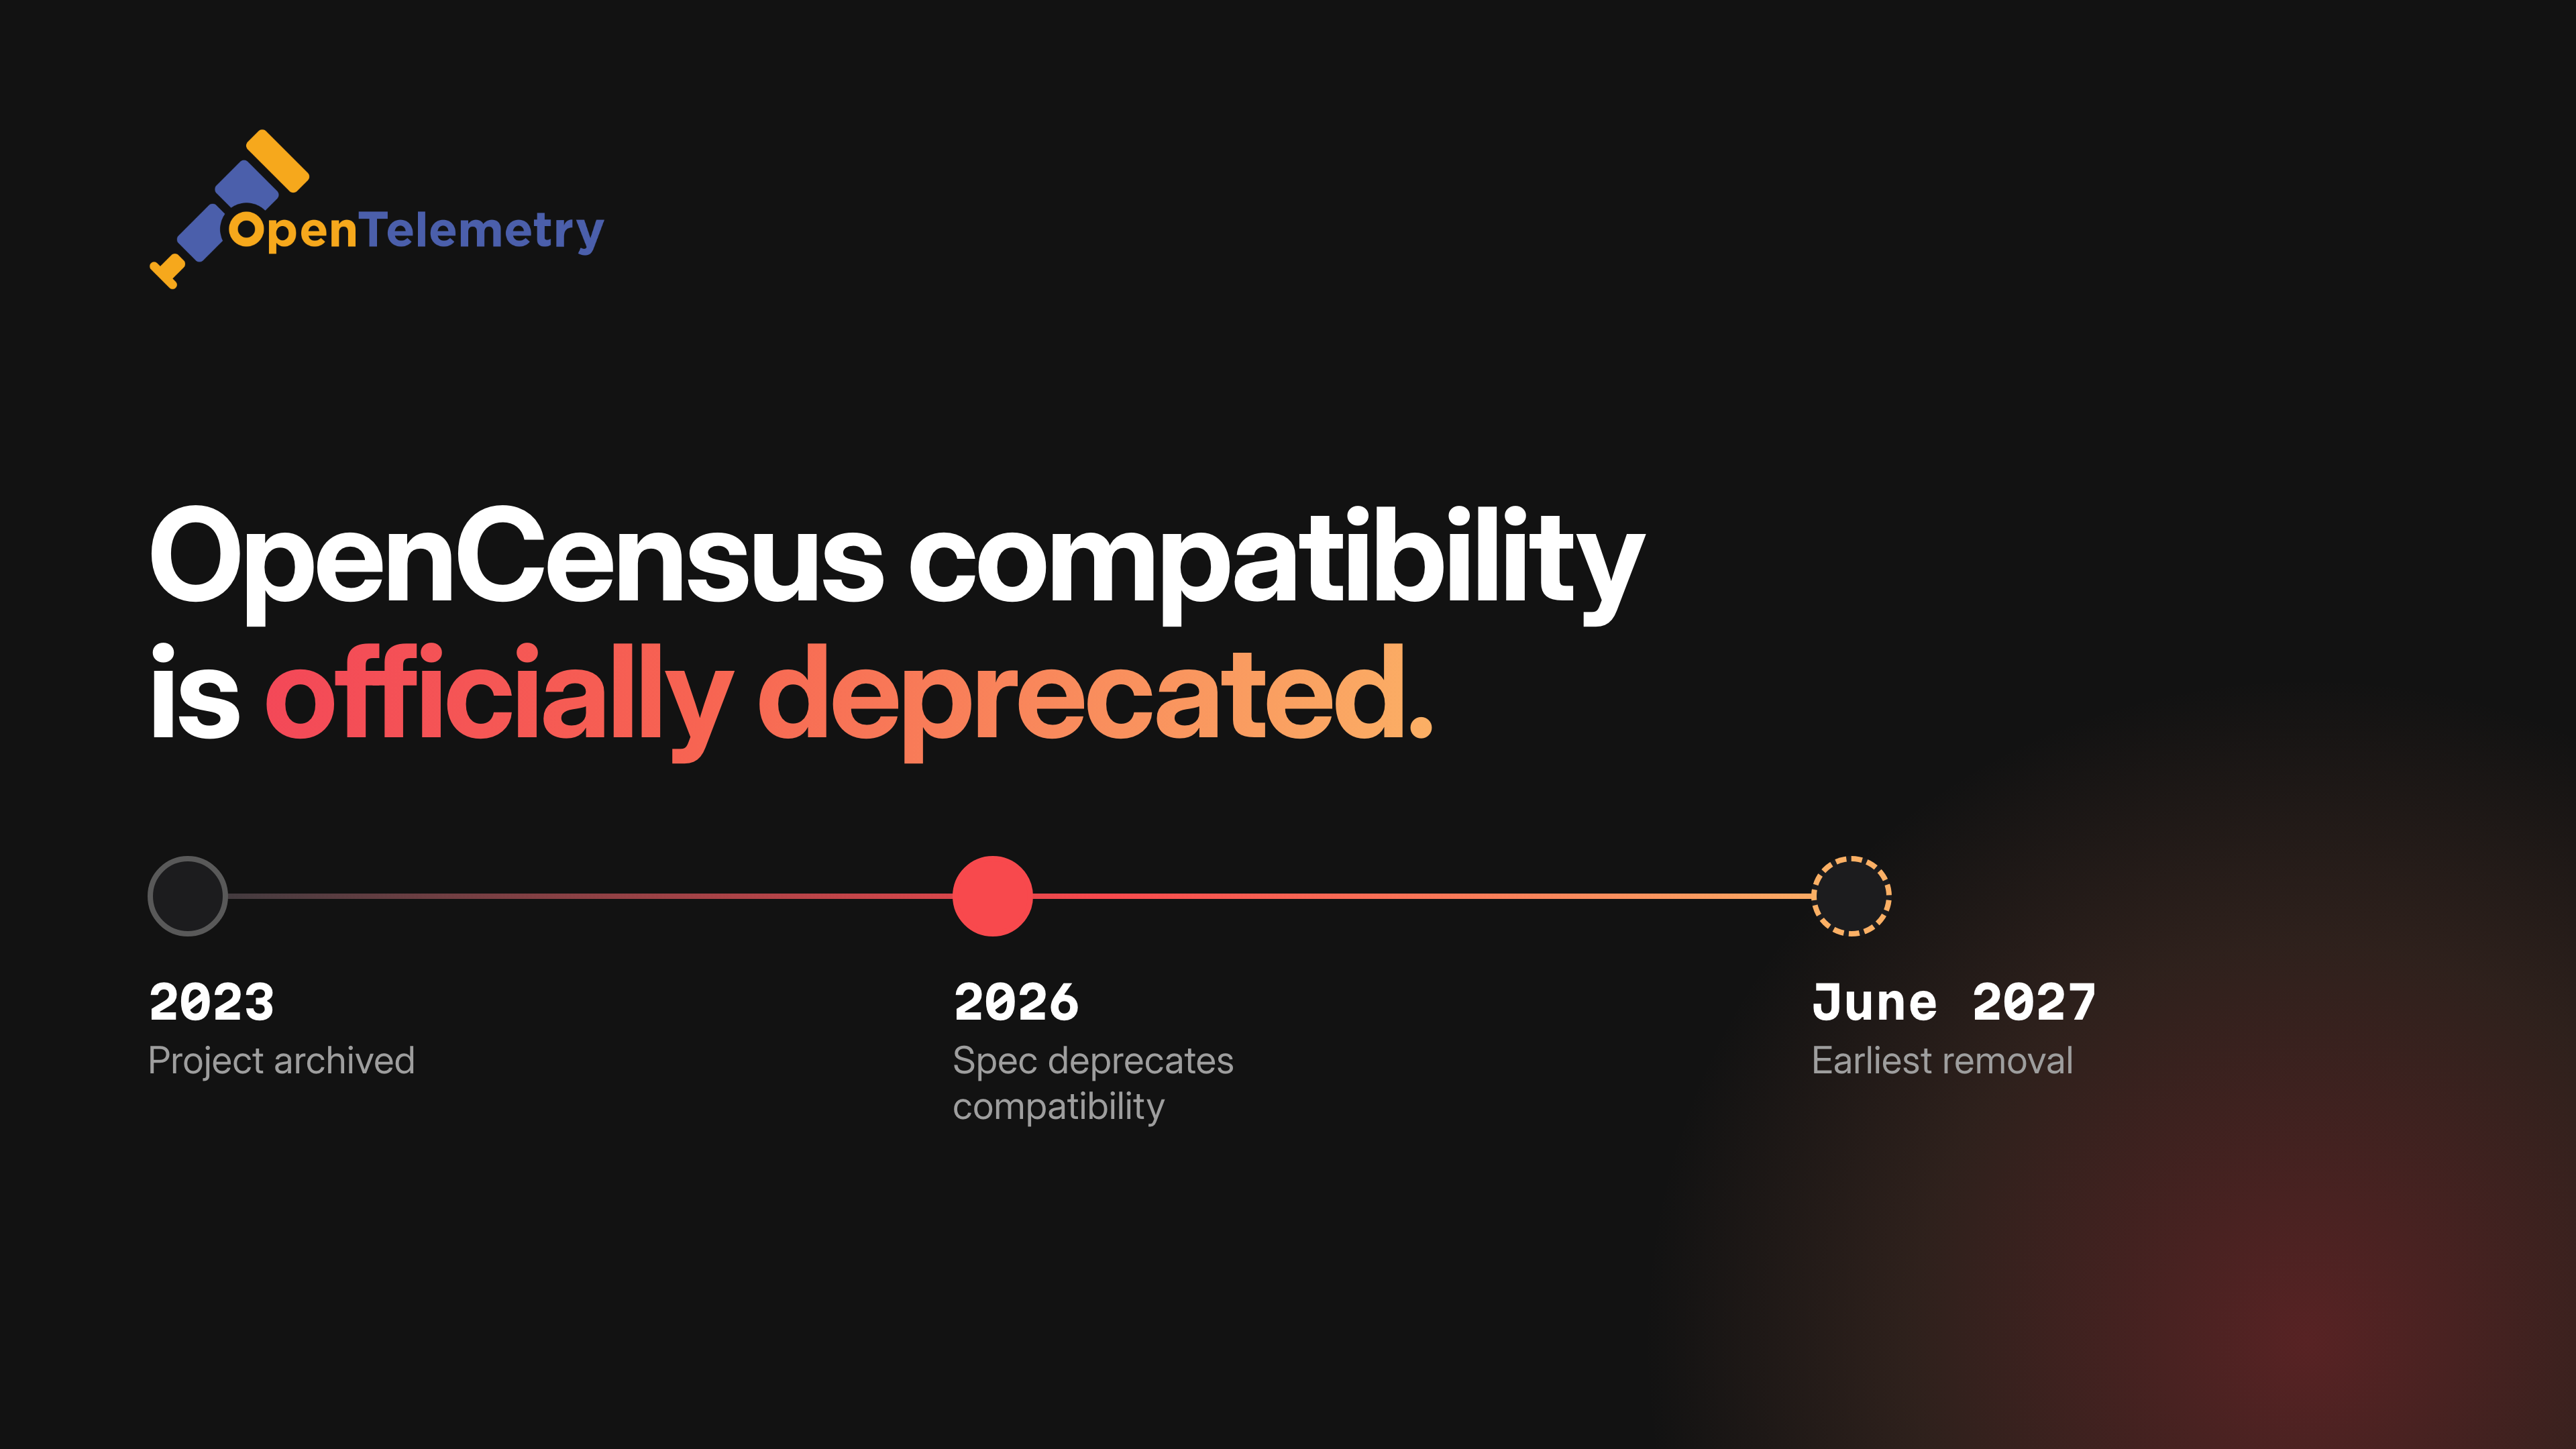
Deprecating OpenCensus compatibility requirements
OpenCensus has been archived since 2023, and the spec has now caught up: compatibility requirements are deprecated, with removal no earlier than June 2027. With OpenTracing receiving the same treatment earlier this year, both of OpenTelemetry's predecessors are now officially retired.
Platform teams should think tracing first
Kaspar von Grünberg argues platforms now serve two users: developers, and the coding agents working next to them. Agents can't squint past inconsistent naming the way humans do. "Think tracing first. Not because the tooling got better, but because the platform got a second user." His answer is Operator injection, conventions and sane defaults, so tracing stops being every team's homework.
Beyond Observability: Evolving Production Operations in the Age of AI
An InfoQ panel with Michael Hausenblas, Netflix's Sujana Sooreddy and groundcover's Noam Levi. Netflix found that moving from low- to high-cardinality data noticeably cut hallucinations in its first-responder agents. Turns out agents also do better when they can see what's going on.
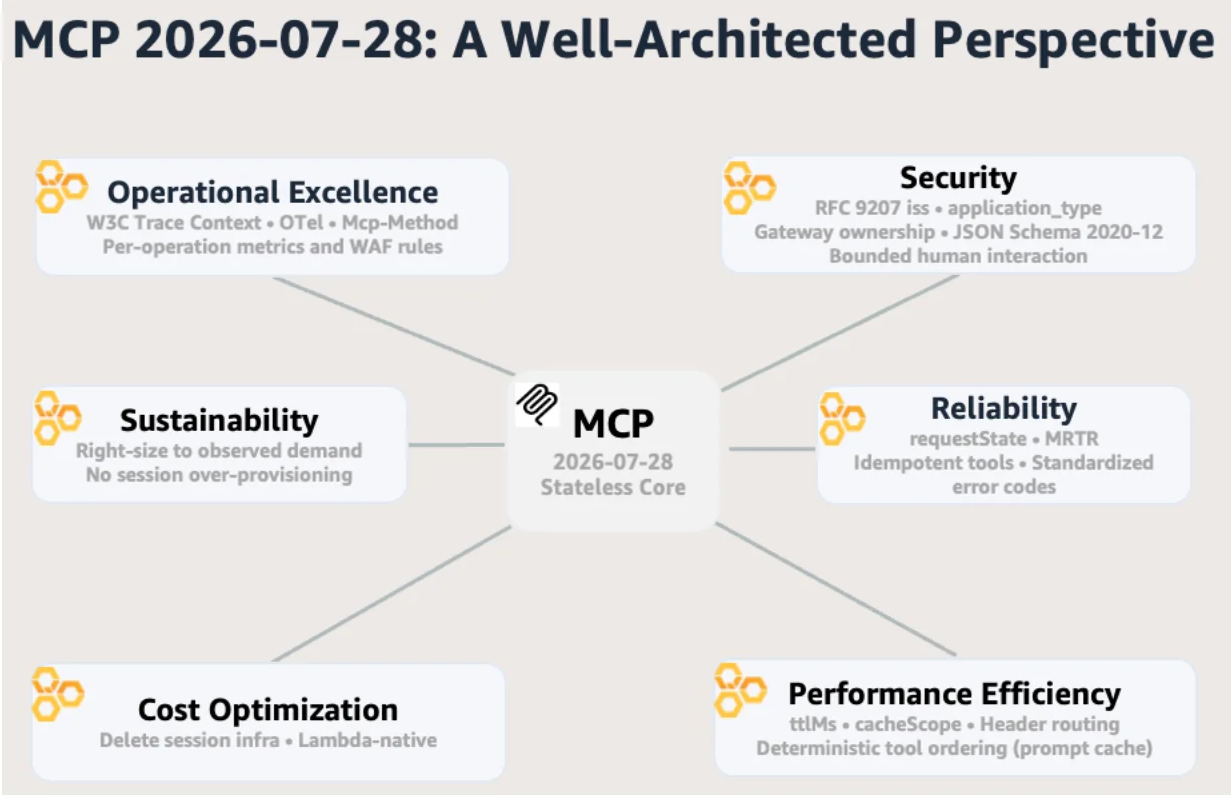
Stateless MCP Removes Session Affinity Requirements for AWS Server Deployments
The July MCP spec dropped the initialize handshake and session IDs, allowing requests to land on any server instance. It also added W3C Trace Context. With sessions gone, trace context becomes even more important if you want to understand a tool call as part of the wider agent workflow.
A few things also shipped in Dash0 over the last couple of weeks. Agent0 can now run threads in parallel, so starting a second investigation no longer means abandoning the first. You can import Agent0 skills straight from GitHub and GitLab and ask it about your AI SDLC Insights. Less agent-shaped but just as useful: cardholder data now gets redacted before we store it (fitting, given Juraci's post), there's a spend forecast on the Billing & Plans page, and new organisations can pick a second US region in N. Virginia.
From 13 to 16 October, the whole Dash0 team is in Croatia for our offsite, so if replies are slow, blame the Adriatic. After that, Adriana and I take the agents to KCD UK in Edinburgh, 19–20 October.
Until next time: scrub your attributes, set the target before you write the code, and never mistake silence for health.
Kasper, out!
Hi, my name is Kasper!
I'm Kasper Borg Nissen, Director of Developer Relations at Dash0. I'm passionate about Observability and bridging the gap toward developers through Platform Engineering. I've previously worked 8 years as a platform engineer, I'm a former co-chair of KubeCon+CloudNativeCon, and I'm genuinely obsessed with all things cloud-native and open standards.