
You’re here because your current log management tool is probably costing you a fortune, locking you into a proprietary ecosystem, or forcing you to juggle three different tools just to figure out why a service is failing.
The dream of “centralized log management” has, for many of us, turned into a nightmare of unpredictable bills, vendor lock-in, and painful troubleshooting workflows.
You’re tired of marketing fluff and just want to know what works. That’s why we’ve prepared a no-nonsense, opinionated guide to the best log management tools for cloud-native teams who value their time and their budget.
We’ll look at the big players, the open-source heroes, and some newer contenders, and we’ll look at search, cost, vendor lock-in, and, most importantly, how well these tools actually help you correlate logs with other signals to solve real problems.
Let’s get started!
1. Dash0

Dash0 is a modern, OpenTelemetry-native observability platform. It’s built from the ground up on open standards, which is a huge deal. This isn’t some legacy platform with an OTel integration bolted on the side; its entire architecture is based on OpenTelemetry, Prometheus, Perses, and other open standards.
It’s designed for cloud-native teams who are already invested in the CNCF ecosystem and are tired of being burned by proprietary tech and surprise bills. It unifies logs, metrics, and traces in a way that actually makes sense.
What’s good
- Truly OpenTelemetry-native: This is its biggest strength. Dash0 isn’t just “compatible” with OpenTelemetry; it thinks in OTel. This means all the rich context from OTel’s semantic conventions is used to its full potential, automatically correlating logs with their corresponding traces and the resources that emitted them. There’s zero vendor lock-in.
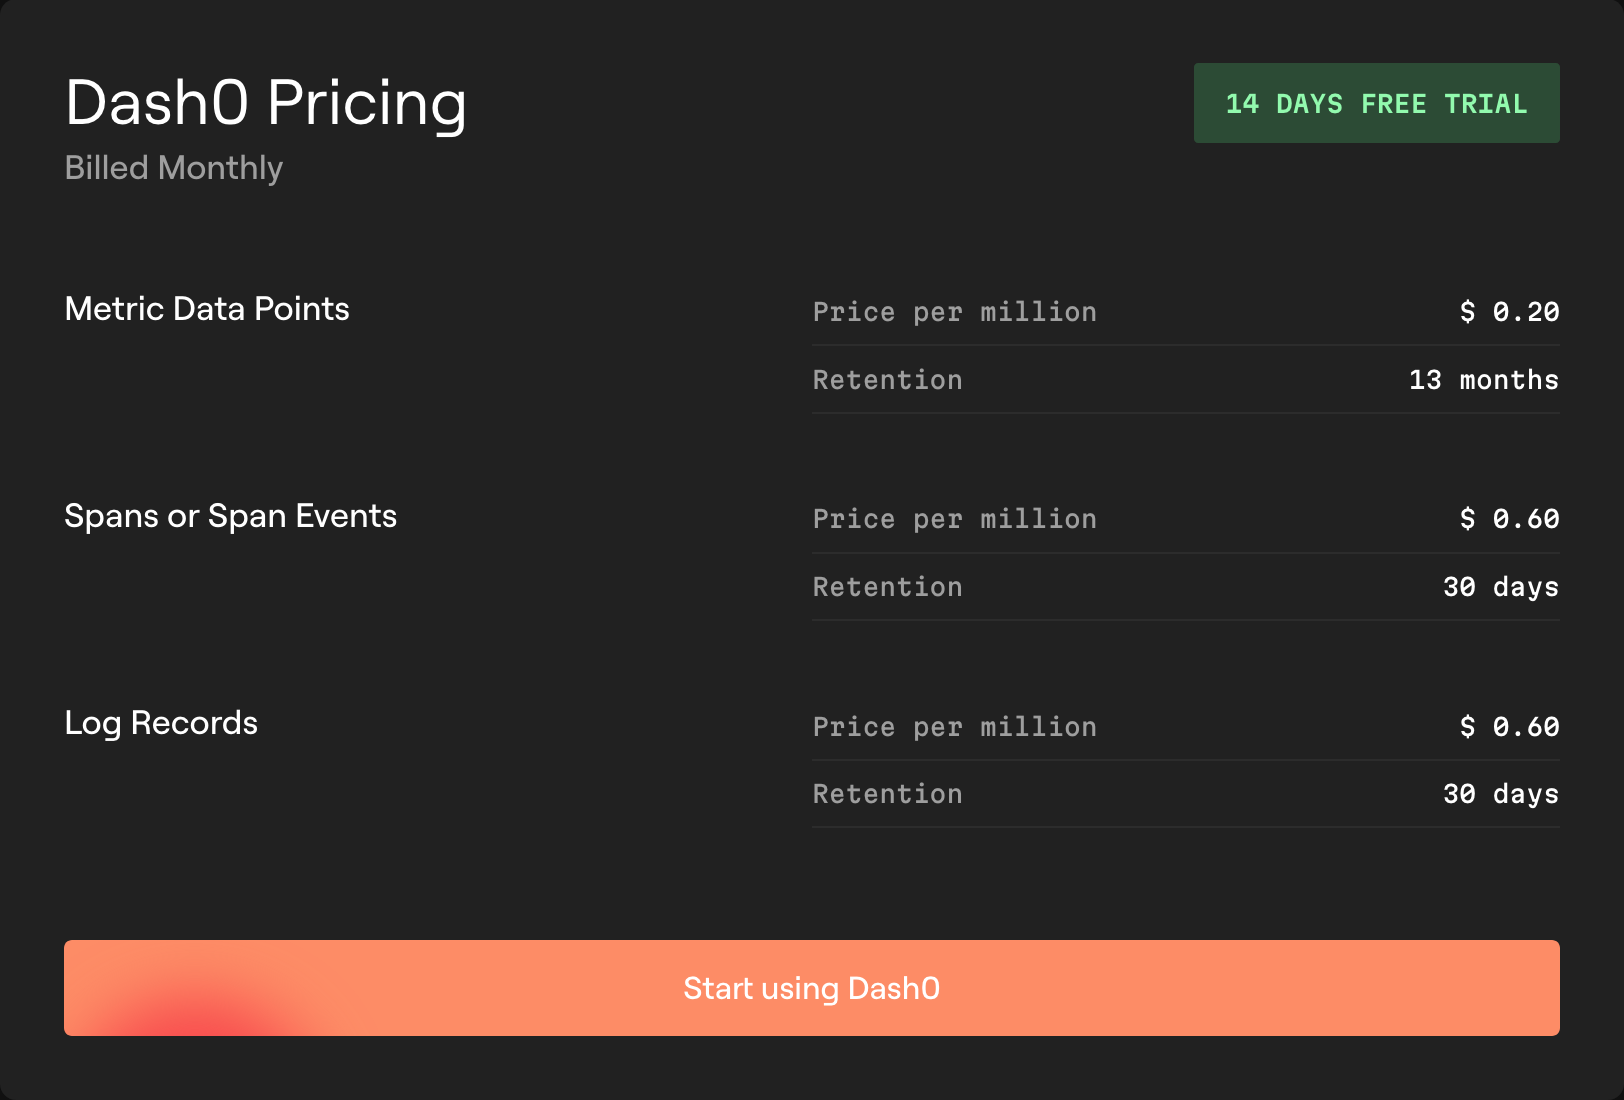
- Transparent and predictable pricing: The pricing model is dead simple. You pay per million logs, spans, or metric data points ingested. That’s it. No charges per user, per query, or for data volume in GB, which means you’re not penalized for sending rich, high-cardinality metadata. It’s designed to prevent bill shock.
- One query language for everything: You use PromQL to query logs, metrics, and traces. If your team already knows Prometheus, they already know how to use Dash0. This eliminates the friction of learning and switching between multiple proprietary query languages just to debug an issue.
The catch
Dash0 is laser-focused on the OpenTelemetry and Prometheus ecosystem. If you're deeply invested in proprietary instrumentation, switching may require upfront effort—though the long-term payoff is freedom.
The verdict
Dash0 is the clear choice for modern, cloud-native teams that want to escape vendor lock-in and unpredictable costs. If you believe OpenTelemetry is the future (and it is), then an OTel-native platform is a no-brainer.
It provides the unified context you need for effective log management and troubleshooting without the operational overhead of self-hosting or the wallet-draining complexity of legacy vendors. It’s built for engineers who’d rather solve problems than haggle with a sales rep over their bill.
Start your 14-day free trial of Dash0 today.
2. Datadog

Datadog is the 800-pound gorilla of observability. It’s a massive, all-in-one SaaS platform that does everything: infrastructure monitoring, APM, log management, security, RUM, and more.
It’s known for its slick UI, extensive list of integrations, and powerful features that appeal to large enterprises who want a single vendor to cover all their bases.
What’s good
- Comprehensive feature set: Datadog offers a vast array of tools. From log analysis to APM and security monitoring, it’s all in one place, which can be appealing if you want a single pane of glass, and you have the budget for it.
- Easy to get started: The initial setup is straightforward. The agent installation is simple, and you can start seeing data in minutes. Its dashboards are intuitive and visually appealing.
- Extensive integrations with major cloud providers, container platforms, and third-party services.
The catch
The pricing is famously complex and unpredictable. Datadog has numerous billing dimensions: per host, per GB of ingested logs, per million RUM sessions, per user, per continuous profiler, and on and on.
Costs can spiral out of control with a single spike in traffic or a developer accidentally setting logs to DEBUG in production. This model creates anxiety and forces teams to spend more time on cost optimization than on engineering.
And, of course, the whole system is built around its proprietary agent and data formats, creating significant vendor lock-in. Getting your data out is not part of their business model.

The verdict
Datadog is for large enterprises with deep pockets that have prioritized a single, all-in-one vendor over cost predictability and open standards. If you have a dedicated FinOps team to constantly monitor your Datadog bill and you’re willing to commit to their proprietary ecosystem for the long haul, it can be a capable solution.
For everyone else, especially fast-moving cloud-native teams, the risk of bill shock and vendor lock-in is just too high.
3. New Relic

New Relic is another one of the old-guard observability players, known for its strong roots in Application Performance Monitoring (APM). They’ve since expanded to cover the full observability spectrum, including a robust log management offering. They recently simplified their pricing to a more “all-in-one” platform approach, charging per user and per GB of data.
What’s good
- Strong APM capabilities: New Relic’s heritage is in APM, and it shows. It provides deep insights into application performance, and its ability to connect this data to logs and infrastructure metrics is solid.
- Generous free tier: They offer a perpetually free tier that includes 100GB of data ingested per month, which is great for small teams or for trying out the platform without talking to sales.
- Unified platform: Like Datadog, they offer a single platform for logs, metrics, and traces, which helps in consolidating tools.
The catch
While the pricing model seems simpler now, it can still be expensive at scale. The primary cost drivers are data volume and the number of “full platform” users, which can discourage widespread access for all engineers.
You might end up with a few gatekeepers who can access the full tool, which is an anti-pattern for a healthy DevOps culture. There are also complaints about a complex UI and a steep learning curve.
And while they support OpenTelemetry, the platform is not OTel-native, meaning you’re still being pushed toward their proprietary agent and data model for the best experience.
The verdict
New Relic is a contender for teams that are APM-centric and want a unified platform from a long-standing vendor. The per-user pricing model can be a “gotcha” for organizations that believe every engineer should have access to observability data.
It’s a step away from the hyper-complex pricing of Datadog, but it doesn’t fully embrace the transparency and open-standards ethos that modern teams need.
4. Dynatrace

Dynatrace is a heavyweight in the enterprise observability space, with a strong focus on AI-powered automation and root-cause analysis. Its platform is built around its OneAgent for data collection and its Grail data lakehouse for processing and querying. It’s designed for large, complex enterprise environments where automatic discovery and dependency mapping are critical.
What’s good
- AI-powered analysis: Dynatrace’s AI engine, “Davis”, is core to its value proposition. It automatically analyzes telemetry to identify anomalies and pinpoint root causes, which can reduce the manual effort of troubleshooting.
- Full-stack automation: The OneAgent is designed to automatically discover and monitor all components of your technology stack, from infrastructure to applications and user experience.
- Strong enterprise features: It has robust support for mainframe monitoring, business analytics, and other features tailored to the needs of large, traditional enterprises.
The catch
The cost is a major hurdle. Dynatrace is geared towards the high end of the market, and its pricing can be very complex and expensive.
The platform also has its own proprietary query language (DQL), which means your team will have to learn a new skill that isn’t transferable outside the Dynatrace ecosystem. This is a classic form of vendor lock-in.
The verdict
Dynatrace is for massive enterprises that are willing to pay a premium for a high-touch, AI-driven, and highly automated observability platform.
If you want a tool to do most of the thinking for you and you have a budget to match, Dynatrace is a powerful option. However, for most cloud-native teams, the cost, complexity, and proprietary nature of its query language make it a non-starter.
5. Splunk

Splunk is the original “big data” log analysis platform, with deep roots in IT operations and security (SIEM). It’s incredibly feature-rich and known for its powerful, albeit proprietary, Search Processing Language (SPL). For many years, Splunk was the default choice for any serious log management effort in the enterprise.
What’s good
- Powerful search and analytics: Splunk’s SPL is extremely capable for complex data analysis, and it’s the gold standard for many security and compliance use cases.
- Vast ecosystem: It has a huge ecosystem of apps and integrations built over many years, making it adaptable to a wide variety of data sources and use cases.
- Enterprise-grade security: Splunk is a leader in the SIEM space, and its security features are top-notch, making it a favorite among SecOps teams.
The catch
Two words: Splunk Tax. Splunk’s volume-based pricing is legendary for being exorbitant. As your data volumes grow, the costs can become astronomical, forcing teams to make painful decisions about what not to log.
Furthermore, it’s a log-centric world. While Splunk has added metrics and tracing capabilities (via acquisitions), they often feel bolted on rather than seamlessly integrated. And learning SPL is a significant investment in a proprietary skill that doesn’t apply elsewhere.
The verdict
If you're primarily buying for security, Splunk still leads. But as a pure log management tool for cloud-native ops? It's increasingly a dinosaur—powerful but prohibitively expensive for modern SRE teams.
6. Graylog

Graylog is a well-known open-source log management platform that offers a centralized solution for collecting, searching, and analyzing log data. It comes in a free open-source version, which you manage yourself, and paid Enterprise and Cloud versions that add commercial features and support.
What’s good
- Open source core: The core Graylog software is free, which gives you control over your data and avoids direct vendor lock-in. You can run it anywhere you want.
- Log processing capabilities: Graylog has powerful “pipelines” and “extractors” for parsing and enriching logs at ingest time, which helps in structuring messy log data.
- Cost-effective at scale (if you self-host): If you have the engineering resources, self-hosting Graylog Open can be significantly cheaper than commercial SaaS offerings, especially for large log volumes.
The catch
Running a scalable, highly-available Graylog cluster is a major operational burden. You are responsible for managing the underlying Elasticsearch/OpenSearch and MongoDB databases, as well as scaling, patching, and securing the Graylog components themselves. This requires significant in-house expertise and engineering time, which isn’t free.
The free version also lacks some of the advanced features found in the paid tiers, and there is limited out-of-the-box correlation with metrics and traces.
The verdict
Graylog is solid for teams that want basic log management without SaaS costs and are comfortable running infrastructure. But it falls short for full observability correlation across signals.
7. SolarWinds Papertrail

Papertrail is a cloud-hosted log management service that focuses on simplicity and real-time log tailing. It’s designed to be a straightforward tool for developers and small teams to quickly search and monitor logs from apps and servers without a lot of complexity.
What’s good
- Simplicity: Papertrail’s core feature is its “live tail,” which is fast and easy to use. It feels like running tail -f across all your systems at once.
- Easy setup: It’s very easy to get logs into Papertrail from a variety of sources. The setup is quick and the interface is clean and uncluttered.
- Affordable pricing: The pricing is generally considered reasonable, based on data volume and retention period, making it accessible for smaller projects.
The catch
Papertrail is primarily a log viewer and search tool; it’s not a full-fledged observability platform. It lacks deep integration with metrics and traces, making it difficult to correlate logs with other signals for root cause analysis.
Its search language is basic compared to more powerful tools, and it can become sluggish with very large log volumes. It’s a simple tool for a simple job, which means you’ll quickly outgrow it as your needs become more complex.
The verdict
Papertrail is a good fit for individual developers, small teams, or simple applications that just need a quick and easy way to view and search logs in real-time. If all you need is a centralized tail -f, it’s a great choice. But if you’re looking for a serious log management tool to be the backbone of your observability strategy, you’ll need something more capable.
8. Sematext

Sematext is a monitoring platform that offers log, infrastructure, and synthetic monitoring in a single SaaS product. They often position themselves as a more affordable, straightforward alternative to the big players like Datadog and New Relic.
What’s good
- Transparent pricing: Sematext is often praised for having a clear and more affordable pricing structure than its larger competitors. This makes it attractive to teams who are feeling the pain of high observability costs.
- Unified platform: It provides a single place for all your observability data, with good correlation between logs, metrics, and traces.
- Good feature set: It has a competitive set of features, including log parsing, alerting, and customizable dashboards, that covers the needs of most teams.
The catch
While it supports many open-source data shippers, the platform itself isn’t built on an open-source core. This means you’re still learning a vendor-specific UI and workflow. OpenTelemetry ingestion exists, but data gets normalized into their internal data format.
Some users may also find the UI less polished than that of the market leaders. It occupies a middle ground—more capable than a simple log viewer, but without the deep enterprise features or the open-standards commitment of a truly modern platform.
The verdict
Sematext is a strong contender for small to mid-sized teams looking for a cost-effective, all-in-one observability platform. It’s a pragmatic choice for those wanting to escape the high costs of Datadog without taking on the operational burden of a fully self-hosted solution. It’s a good balance of price and performance, but it doesn’t solve the long-term problem of vendor-specific workflows.
9. Grafana Loki

Grafana Loki is an open-source, multi-tenant log aggregation system inspired by Prometheus. Its core idea is to index only the metadata (labels) for each log stream, not the full text of the log lines. This makes it very storage-efficient and cost-effective, especially when paired with Grafana for visualization.
What’s good
- Cost-effective: Loki’s design of indexing only labels makes it dramatically cheaper to store and query logs compared to tools that index the full content.
- Prometheus-like workflow: It uses a label-based query language (LogQL) that will feel very familiar to anyone who uses PromQL. This makes it a natural fit for teams already in the Prometheus/Grafana ecosystem.
- Integration with Grafana: It integrates perfectly with Grafana, allowing you to correlate logs with metrics and other data sources in the same dashboards.
The catch
High operational overhead. Like any self-hosted solution, you are on the hook for everything. Running Loki at scale is complex; it consists of multiple microservices that are hard to configure and debug.
Performance can degrade quickly if you’re not careful with label cardinality, and a production setup requires object storage, which is another system to manage. The “cost-effectiveness” in software licenses is quickly offset by the engineering cost of running it.
The verdict
Grafana Loki is for hardcore DIY teams that are already deeply invested in the Grafana and Prometheus ecosystem and have the operational maturity to run a complex distributed system. If you have the engineering time to spare and your primary goal is to minimize direct software costs, Loki is a powerful choice. For most teams, however, the operational complexity is a deal-breaker.
10. Signoz

Signoz is an open-source, all-in-one observability platform that is a direct alternative to Datadog and New Relic. A key difference is that it’s built from the ground up to fully embrace OpenTelemetry. It provides logs, metrics, and traces in a single application, which you can self-host or use their cloud service.
What’s good
- OpenTelemetry-native: Like Dash0, Signoz is built on OpenTelemetry, which means no vendor lock-in and excellent support for modern instrumentation.
- Unified solution: It offers logs, metrics, and traces in one application, avoiding the need to stitch together multiple tools.
- Open-source and self-hostable: Being open-source gives you ultimate control over your data and your stack.
The catch
If you self-host, you face the same operational burden as with Loki. You’re responsible for deployment, scaling, and maintenance. While they offer a cloud version, it’s still a relatively young product compared to the established players.
As a complete, all-in-one system, it can be more complex to set up and manage than more focused solutions. Some users have found the learning curve to be steep.
The verdict
Signoz is an excellent choice for teams that want an open-source, OTel-native alternative to Datadog and have the resources to manage it themselves. It’s one of the most promising open-source projects in the observability space.
If you’re considering self-hosting, it’s a strong competitor to a DIY Grafana stack. For those who want the benefits of OTel-native without the operational headache, a managed service is still the better path.
11. Better Stack

Better Stack aims to provide a better-looking and easier-to-use observability platform. It combines log management, uptime monitoring, incident management, and status pages into a single product. It’s known for its slick UI and SQL-based query language.
What’s good
- Great user interface: The UI is modern, fast, and generally a pleasure to use. It makes searching and visualizing logs feel very intuitive.
- SQL for queries: You can use SQL to query your log data, which is a familiar language for many developers and data analysts.
- Integrated incident management: The platform includes on-call scheduling and alerting, which helps teams close the loop from detection to resolution.
The catch
While SQL is familiar, it’s not the standard for time-series observability data; PromQL has largely won that battle in the cloud-native world. And although they support OpenTelemetry, it's clear they don't truly prioritize it.
The pricing is bundled in tiers that combine logs, metrics, and uptime checks, which can be less flexible if you only need a subset of the features. It’s another beautiful, walled garden. You’re buying into their specific way of doing things, which can be a form of lock-in.
The verdict
Better Stack works well for startups that want basic centralized logging and simple incident management. But if you need true OpenTelemetry-native observability across distributed systems, it's not enough.
12. Mezmo
Mezmo (formerly LogDNA) is a log management platform that focuses on providing a fast, real-time logging pipeline. It has recently been investing heavily in features that allow you to control and shape your telemetry data as it flows through their system, positioning itself as an “observability pipeline” company.
What’s good
- Fast live tail: Like Papertrail, Mezmo is known for its speedy and responsive live log tailing feature, which is great for real-time monitoring.
- Telemetry pipeline features: It offers capabilities to parse, enrich, and route logs, giving you more control over your data before it’s stored and analyzed.
- User-friendly interface: The UI is clean and designed for ease of use, with a focus on powerful searching and filtering.
The catch
While its pipeline features are interesting, they are proprietary. The broader observability story (metrics and traces) is less mature than that of its all-in-one competitors.
The verdict
Mezmo is compelling if your priority is log processing pipelines and telemetry governance. But it's not a full observability solution when you need rich cross-signal correlation.
Final thoughts
The days of being locked into a single, expensive vendor for log management are over. The rise of open standards like OpenTelemetry has completely changed the game, and you no longer have to choose between a powerful platform and an affordable one.
The trend is clear: the future is open, interoperable, and transparent. The best log management tools don’t force you into a proprietary data format or a confusing pricing model.
They embrace the CNCF ecosystem, empower you with familiar query languages like PromQL, and give you the context needed to correlate logs with metrics and traces effortlessly.
While the old guard still offers powerful but costly solutions, modern tools built on an OpenTelemetry-native foundation offer a way out of the chaos. They let you focus on what actually matters: building reliable systems, not deciphering your monthly bill.
If you’re ready to switch to a platform that respects your budget and your workflow, give Dash0 a try.

