But how do you create these deployment events when you use Terraform? terraform apply is often the exact moment a deployment happens, but marking that moment in Dash0 used to mean stepping outside Terraform: the CLI, a CI step, a webhook. The dash0_deployment_event and dash0_log_event actions, introduced in the Terraform provider for Dash0 v1.16.0, close that gap.
dash0_deployment_event sends a dash0.deployment event that shows up as a dashboard annotation, so "what changed right before this graph moved?" has an answer.
dash0_log_event is its general-purpose sibling: send an arbitrary log event, mirroring the dash0 logs send CLI command.
Both need Terraform 1.14 or later and the provider's new otlp_url attribute (or DASH0_OTLP_URL), which points at the OTLP ingress endpoint rather than the API.
Time-series panels can now show your deployments as markers on the timeline, colored by whether the deployment succeeded or failed. Send a dash0.deployment log event from your pipeline and every chart can tell you when the code changed.
A chart shows latency doubling at 14:02, and the first question is always the same: did we ship something? Today you leave the dashboard, open your delivery pipeline, and line up timestamps by hand. The answer was in your telemetry the whole time, one chart away.
Dash0 now has a Deployments annotation type for time-series panels. Each deployment appears as a marker on the panel timeline, colored by its status, so a failed deployment reads as an error and a successful one stays neutral. Hover a marker to see the deployment's details. The annotation is not scoped to a single service, so one annotation covers everything your pipeline ships, and you can narrow it with filters. Deployments come from log events named dash0.deployment: emit them with the Send Log Event GitHub Action or with dash0 logs send from the Dash0 CLI. See Add Annotations for the setup.
Write action approval is a new Agent0 setting that makes Chat stop and ask you before it does anything that writes. Organization admins turn it on in Settings → Agent0.
Write action approval is a new organization-wide setting for Agent0. With it on, Agent0 Chat stops and asks you before it does anything that writes: posting a Slack message, creating an automation, calling a write tool on one of your MCP servers.
You get a card in the conversation with the action, Agent0's reason for it, and the exact arguments. Approve and it runs. Deny and Agent0 carries on without it. Reads aren't affected, so it keeps querying your telemetry while you decide. That way you can give Agent0 real work without handing it the last call on anything it changes, and Chat Details keeps a record of who decided what.
An organization admin turns it on in Settings → Agent0, and it's off until they do. It covers Agent0 Chat and the Agent0 panel inside Dash0. Agent0 running from Slack, Linear, an agentic workflow, or MCP won't ask, and GitHub and git actions follow the GitHub connector's own permissions instead. Approvals are single use, so reloading the page or clicking twice can't fire the same action again.
The Dash0 Operator for Kubernetes v1.151.0 introduces automatic instrumentation support for Ruby 3.3+.
Ruby applications historically have needed the OpenTelemetry SDK wired in manually before any traces or metrics appeared in Dash0. With auto-instrumentation enabled, the operator injects the Dash0 OpenTelemetry Ruby distribution at container startup.
Rails apps, Bundler-managed services, and plain Ruby scripts all gain distributed tracing out of the box.
The monitoring activates for apps running on Ruby 3.3 or later.
Workloads running older runtimes are unaffected — the distribution detects the version at startup and deactivates itself gracefully, so the flag is safe to enable in clusters with mixed Ruby versions.
To enable it, upgrade the Dash0 Operator for Kubernetes to v1.151.0, set operator.instrumentation.enableRubyAutoInstrumentation=true when installing or upgrading the Helm chart.
For now, Ruby monitoring is opt-in and off by default. But we plan to turn it on by default in future versions.
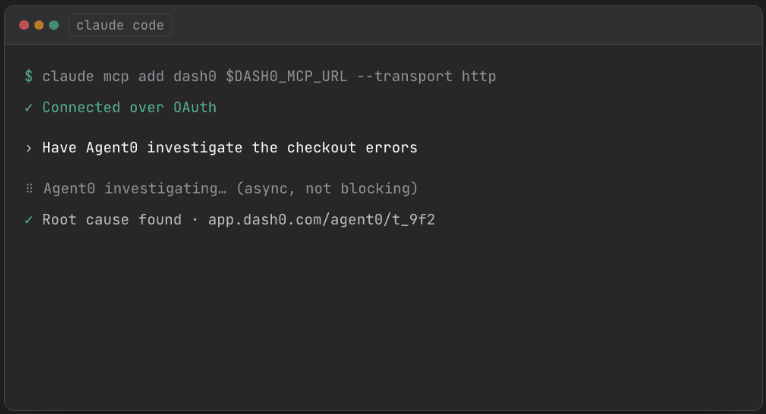
Agent0, Dash0's observability agent, can now be reached from Claude Code, Cursor, or any MCP client. Rather than your assistant running one query at a time, ask "why did checkout get slow at 14:00" and Agent0 investigates across your metrics, logs, traces, and profiles, then tells you what broke and why. It uses Dash0 credits, and organization admins can turn it off for everyone.
Your AI assistant could already read Dash0: run a metric query, pull log records, list failed checks. That works when you already know what to ask for. It works badly when you don't, because the assistant has to guess which attribute, which filter, which time range, and then guess again when the first answer looks wrong.
runTask hands the whole question to Agent0 instead. You describe the problem in plain language. Agent0 works out which telemetry to pull, follows what it finds, and reports back a conclusion. One of these is a delegation: one question, one investigation, one Agent0 thread in Dash0 you can open and read.
The MCP server gives your assistant read access to your telemetry: metrics, logs, traces, spans, services, failed checks. That is the right tool when you already know what you want. Agent0 has all of it, and more:
Continuous profiling. Not available through the telemetry tools at all, so questions about CPU and memory at the code level can only be answered this way.
What is inside your dashboards and check rules. Your assistant can list them. Agent0 can read them, which is how it works out what a renamed metric will break.
Validation before it hands anything over. When the answer is a new dashboard or check rule, Agent0 confirms it is valid first, so what you get back is something you can actually create.
Full user sessions, not just individual web events.
Deep links, so it can hand you a pre-filtered link into the Logs or Trace Explorer rather than telling you where to look.
Where your organization has connected them, it can also read context outside Dash0, such as your repository or issue tracker, to tie a change in the data back to a change someone made.
Handing an assistant a PromQL tool does not teach it Dash0's PromQL. It still has to work out how metrics are selected, how OpenTelemetry attribute names map to Prometheus ones, which attributes to fall back to when a metric is not where it expects, and how Dash0's synthetic metrics work. It will get some of that wrong, and a query that runs but returns the wrong thing looks exactly like one that is right.
Agent0 already knows, along with the equivalent for turning spans into latency percentiles and error rates, joining across logs, spans, and web events, and reading dashboards and check rules. It is the difference between a capable assistant guessing at an unfamiliar system and one that already knows it.
Quick questions come back inline. Anything substantial takes longer than a tool call should block for, so runTask hands you a thread link and Agent0 keeps working in the background while you carry on. Ask for the result when you want it, or open the link to watch the investigation in Dash0 and see exactly which telemetry it queried to reach its answer. Follow up on the same thread and it keeps the earlier context.
You do not have to take its word for it. Every step is on the thread, so a conclusion you doubt is one you can check.
An investigation uses Agent0 credits, billed exactly as a conversation in the Dash0 UI is. There is no flat rate per question. Cost scales with the work the question takes: how many steps Agent0 runs, and how much telemetry it analyzes. Checking whether a metric exists is cheap. Root-causing an incident across metrics, logs, and traces on a busy service costs more. Following up on a thread costs credits too.
The direct telemetry tools stay free. If you already know the exact value you want, ask for it directly and pay nothing.
Your organization's Agent0 credit limit applies here as everywhere else, so this cannot run past the cap you have set.
Worth knowing: your assistant decides when to delegate. It reads your question, judges it open-ended, and calls runTask on its own. You do not have to name Agent0 for a delegation to happen.
Over MCP, Agent0 investigates and reports. It does not edit code, open pull requests, post messages, or create, edit, or delete anything in Dash0. When the answer is a new dashboard or check rule, it hands you the definition to create yourself.
This is not a matter of trusting the model to behave. Every investigation started over MCP runs on a read-only credential, so a write is refused by the Dash0 API regardless of what the agent tries.
For the whole organization. An admin can switch off Agent0 via MCP under Settings → AI. It is on by default. Turning it off applies to everyone in the organization and in every MCP client, so it is the setting to use if you want a guarantee rather than a per-developer convention. Agent0 disappears from the MCP server; the read-only telemetry tools stay connected and stay free. Only organization admins can change it.
For yourself. There is no per-user setting in Dash0. If you want to keep delegation off in your own editor while the organization leaves it on, deny runTask and waitForTask in your MCP client. Claude Code takes them in permissions.deny; Claude.ai and Cursor have per-tool toggles.
MCP is a new door, not a new agent. The same Agent0 answers in Dash0 Chat, runs Automations on a schedule or a trigger, and replies in Slack. An investigation you start from your editor becomes a thread you can open in Dash0, hand to a colleague, or turn into an automation later.
If you have not used Agent0 before, Agent0 Overview is the shorter path than working it out from a tool description.
Any query in the Log Explorer, Trace Explorer, or Web Events Explorer can now be exported to a file. The button sits in the table header next to the display menu, with CSV as the primary action and TXT, JSON, and YAML in the disclosure menu.
The active query defines the file, not how far you scrolled. Filter, time range, ordering, and dataset are what get exported, so the same query exported twice gives you the same records. For spans and web events that includes a focused duration range picked on the heatmap, because that selection is part of what the table is querying.
Exports include up to 5,000 records. Beyond the cap, use the Dash0 CLI. The menu builds the command for your current query, ready to copy.
The export button in the Log Explorer table header. The menu carries the remaining formats, states the record cap, and builds a Dash0 CLI command for the query you are looking at.
You can now manage Dash0 teams as code using the Dash0 CLI, Terraform provider, and Kubernetes operator, so team definitions live in the same repository, review process, and rollout pipeline as everything else.
Each team is modelled as a CRD:
yaml
team.yamlapiVersion: dash0.com/v1alpha1
kind: Dash0Team
metadata:
  name: backend
  labels:
    dash0.com/id: team_01kvdm62v1e1hrz93egm447bxw
spec:
  display:
    name: Backend
    description: Owns backend services and the data platform.
    color:
      from: "#6366F1"
      to: "#8B5CF6"
  members:
    - alice@example.com
    - bob@example.com
You can download the YAML of a team from its page in the Organization settings:
Support is added in the CLI version v1.16.0 and above.
The teams command tree is currently experimental and requires the --experimental (-X) flag; apply picks up kind: Dash0Team documents without any flag.
sh
# Create or replace a team from a YAML file
dash0 apply -f team.yaml

# List all teams
dash0 -X teams list

# Get a team as YAML (round-trippable with `apply -f`)
dash0 -X teams get <origin-or-id> -o yaml

# Update a team by re-applying the edited YAML
dash0 apply -f team.yaml

# Delete a team
dash0 -X teams delete <origin-or-id> --force
The exported YAML round-trips through apply -f without post-processing, and membership renders as email addresses on read regardless of whether the write used emails or internal ids.
Using the Dash0 Operator for Kubernetes v1.50.0, create the Dash0Team resource in one of your namespaces with a Dash0Monitoring resource and your team will be synchronized with the Dash0 backend.
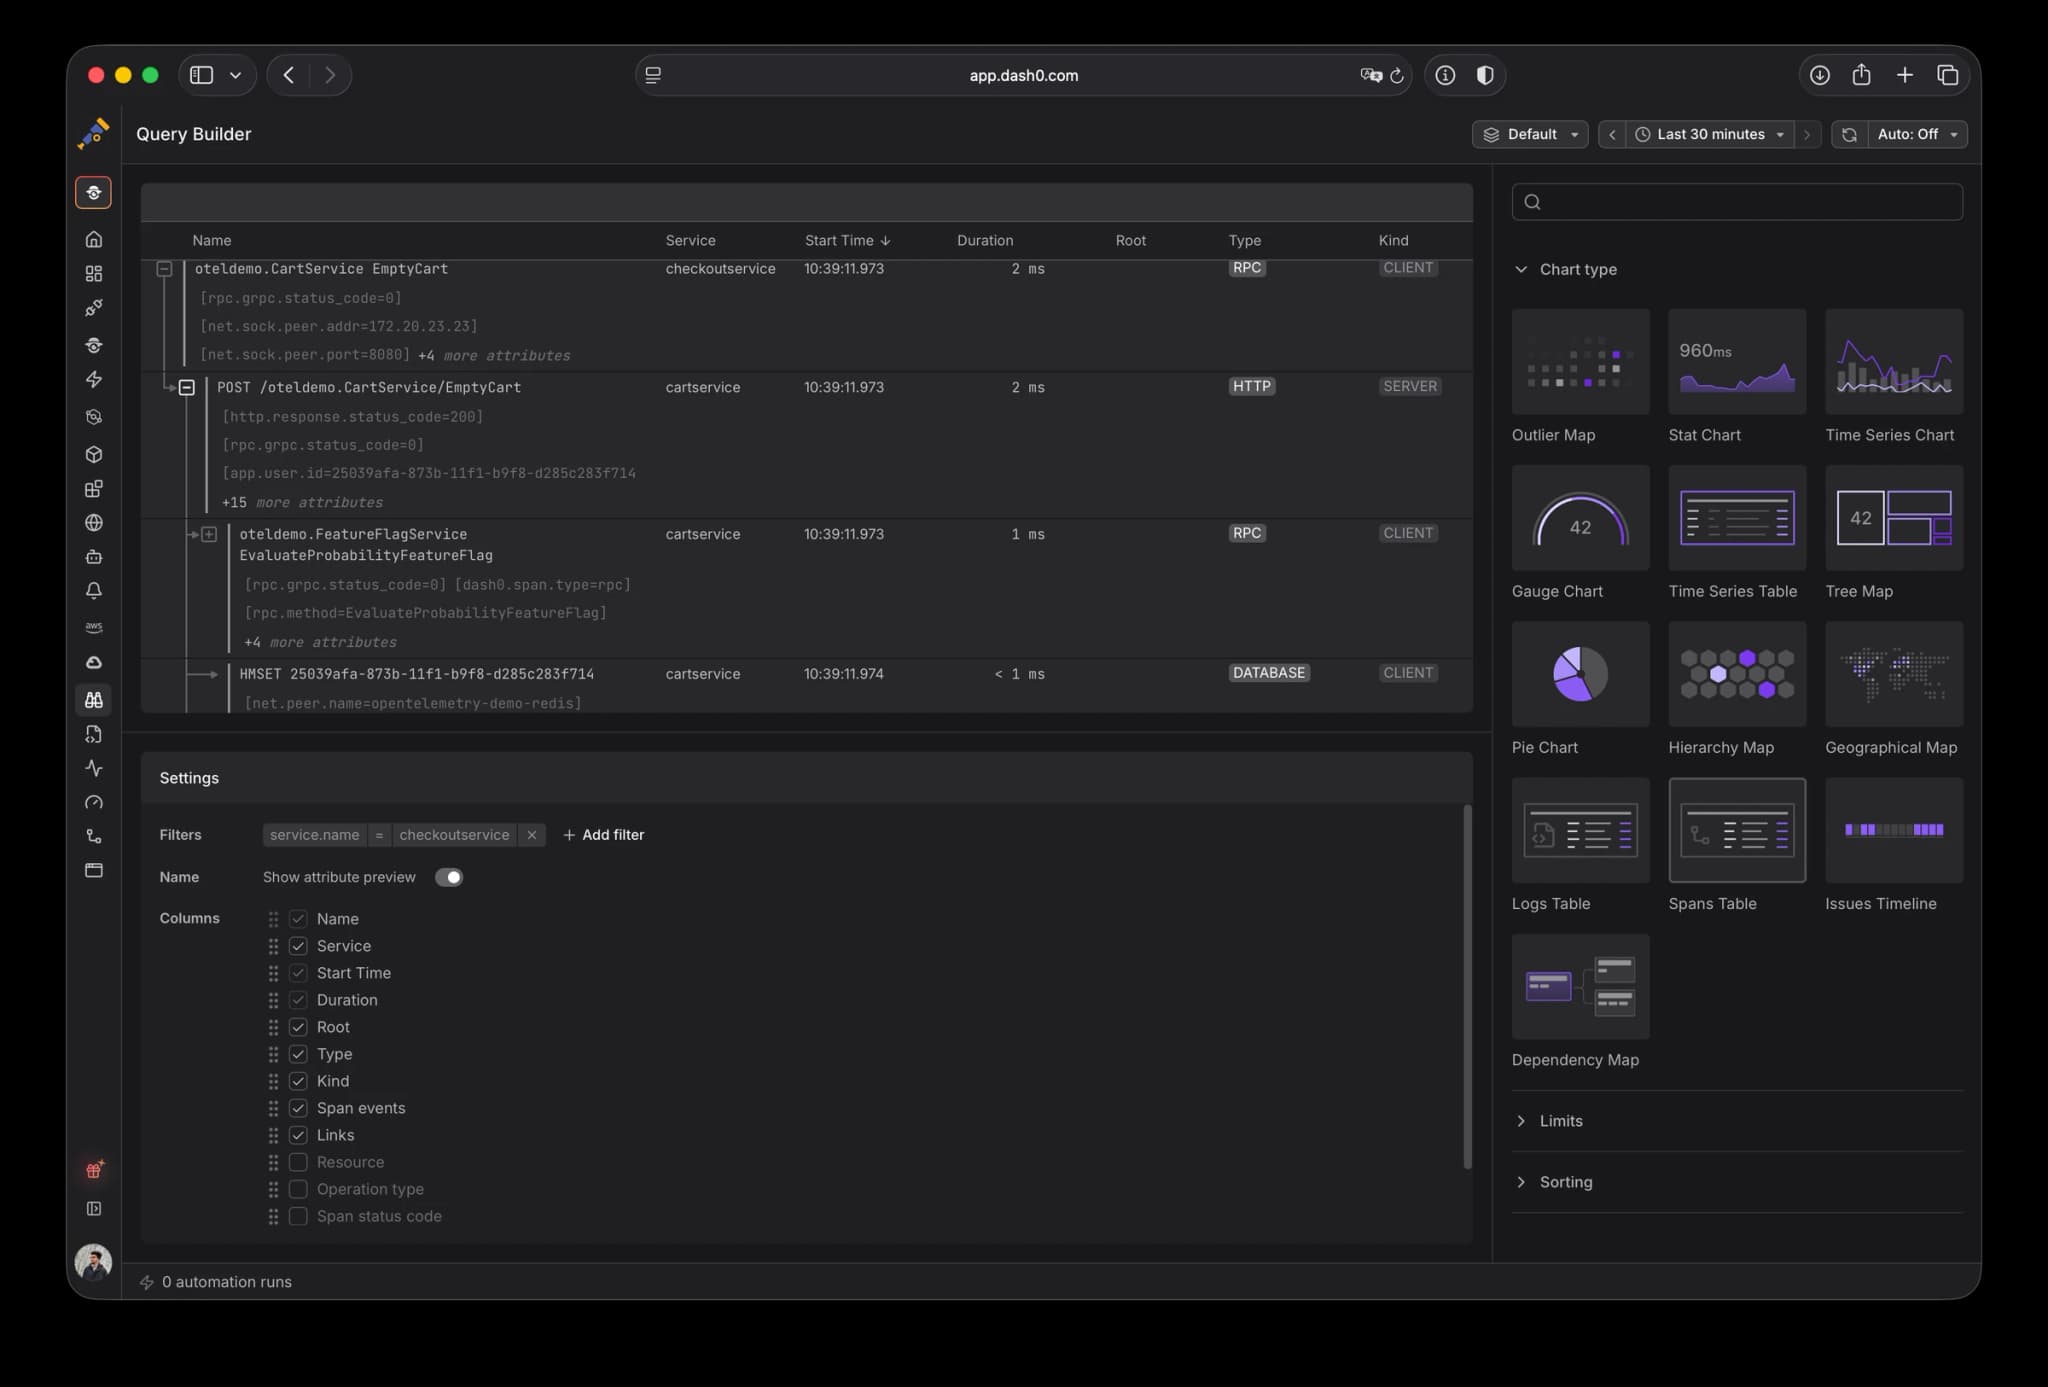
The new Spans Table widget brings a sortable, self-refreshing table of spans to your dashboards and the query builder.
Example spans table in query builder
Your dashboards could already pin a live Logs Table, but spans had no equivalent. If you wanted to see raw spans next to your charts, say the slowest requests to an endpoint or every span carrying an error, you had to break away from the dashboard and jump over to the Trace Explorer.
Now you can add a Spans Table widget to any dashboard. It fetches spans on its own and shows them in a sortable table. Sort by start time, duration, or status code, pick exactly the columns you want (name, service, duration, span kind, status, and more), add any attribute as its own column, and scope the whole table with filters and dashboard variables.
Every row links straight into the Trace Explorer and carries your columns and filters with it, so a single click takes you from the dashboard to the full trace and span detail with nothing to set up again.
The result is a dashboard that can show live spans right beside your metrics and logs, so the traces that matter stay in view instead of a tab away.
The old "Events & Logs" tab in the span sidebar is now "Related logs & events", offering you a one time-ordered list that interleaves log records and span events across the whole trace, resource, or both.
The new “Related logs & events” tab in the span sidebar.
A dropdown at the top of the tab lets you switch between four correlation scopes:
Trace (default): every log record and span event in the same distributed trace as this span. Best starting point for reconstructing a request.
Resource: everything on the same service within ±30 minutes of the span. Handy when the interesting logs live outside the span's own trace context (background jobs, scheduled tasks).
Resource & Trace: the union of the two above.
Span: only the log records and events directly attached to this span. Same behaviour as the old "Events & Logs" tab.
Inline marker rows show exactly where "This span started" and "This span ended" sit within the surrounding stream. Older records appear below, newer above. When you paginate away and click the duration pill above the list, it snaps you back to the span-start marker. Or, if you've drifted far enough that the marker is out of the cached window, it re-fetches around the anchor and centers there.
Clicking an event in the trace tree scrolls the list to that event and briefly highlights the row, so navigating from a span's timeline into the surrounding logs keeps your place.
The tab is built on the same virtualized list, cursor pagination, and row layout that the log sidebar's Related Logs tab already uses. Both sides share behaviour, keyboard focus, and infinite-scroll semantics.
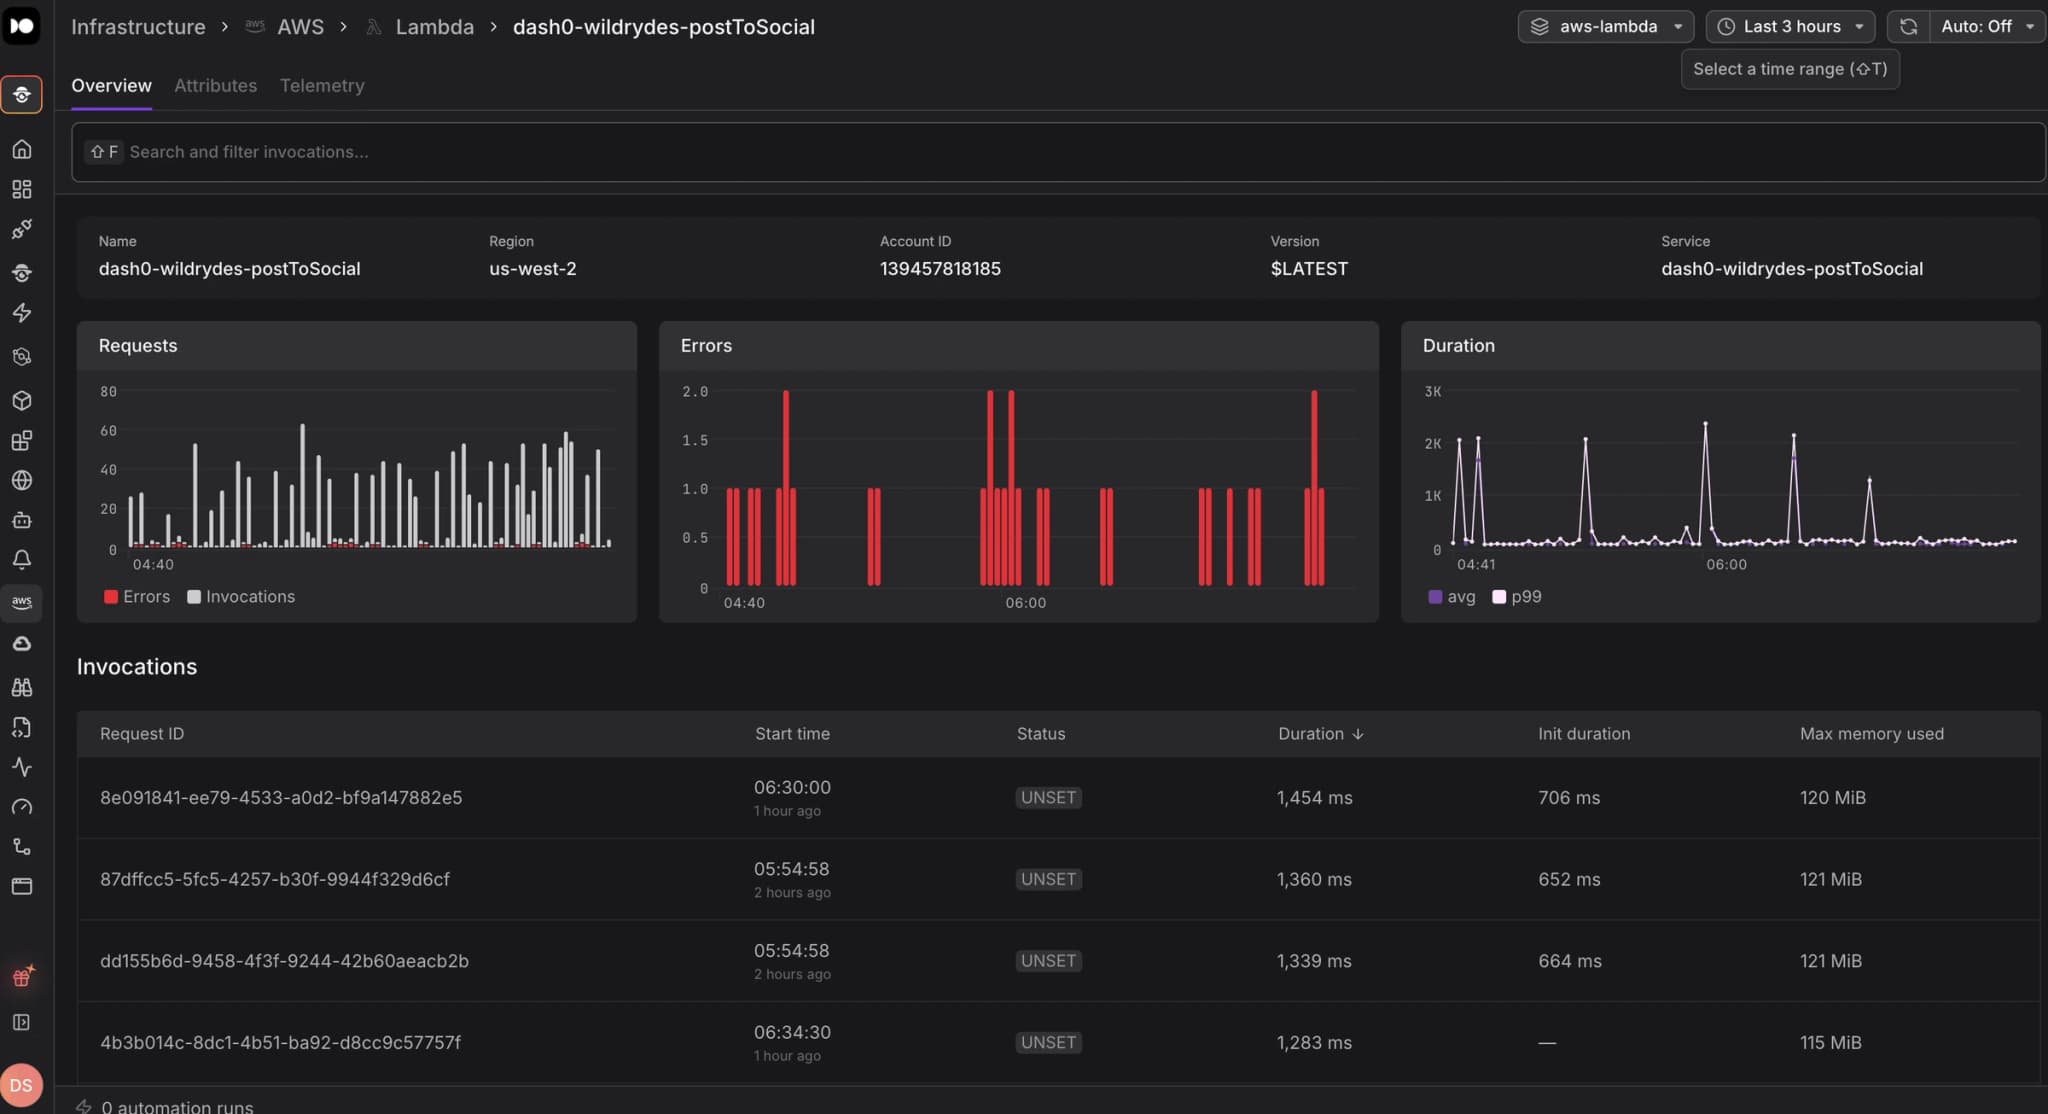
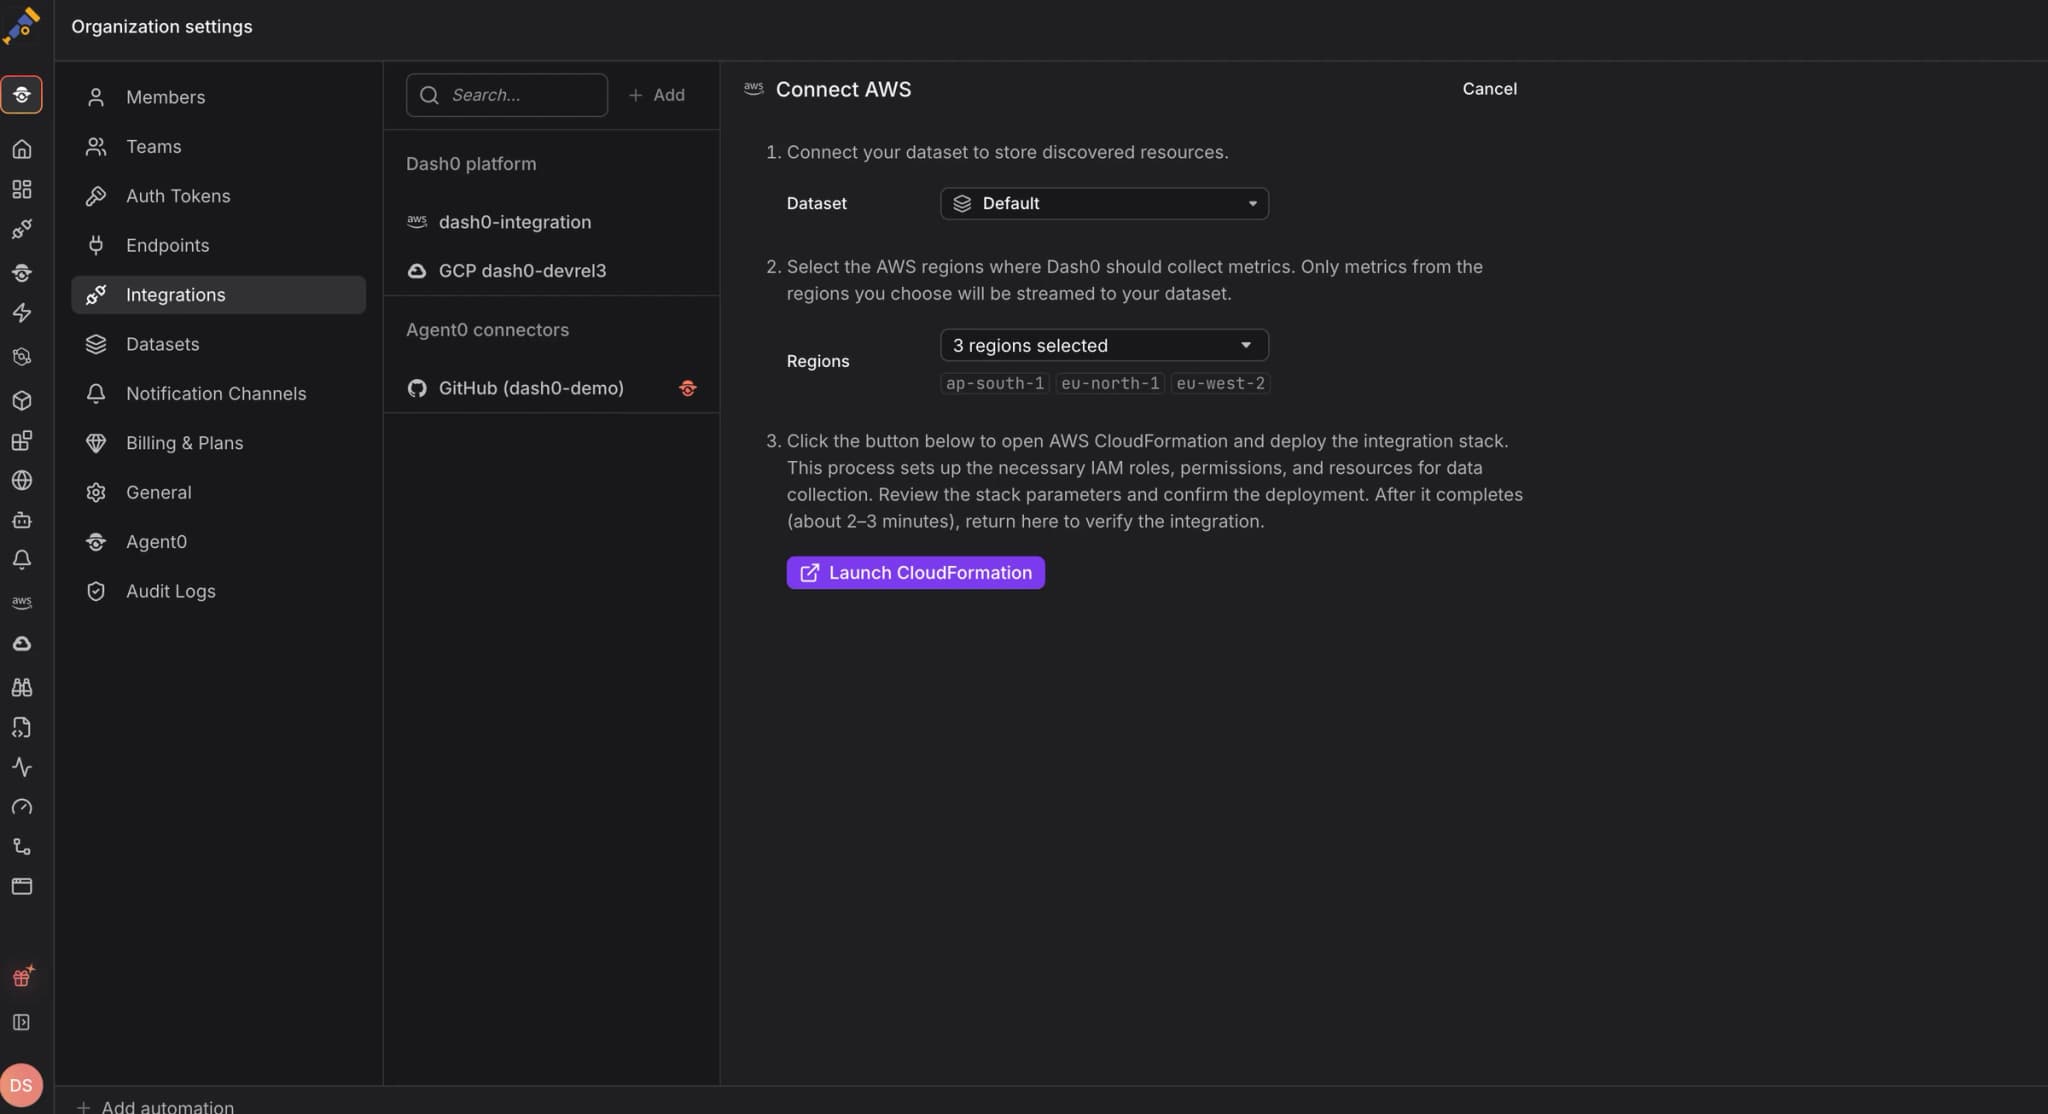
Full AWS Lambda observability is now in Dash0. Connect your account and see every function immediately, instrument to get traces with event payloads, correlated logs and synthetic traces for the failures that never produce telemetry.
Lambda observability used to mean gluing together CloudWatch and X-Ray, hand-managing OTel layers per function, and building dashboards from scratch, per account, per region, just to see which functions were erroring or cold-starting. And it drifted the moment someone redeployed without the layer.
Now you connect your AWS account to Dash0 and see your Lambda functions, invocations, errors, duration, and cold starts, with no dashboards or queries to set up.
What's included
One-click AWS account connection. Connect via CloudFormation in under five minutes. Dash0 uses cross-account IAM role assumption, so no credentials are stored on Dash0's side. Terraform and CDK paths are available for infrastructure-as-code teams.
Lambda resource catalog. Every Lambda function appears with invocation counts, error rates, duration, and cold start metrics, across all connected accounts and regions. Click any function for a full metrics breakdown and an invocation table filterable by result, duration, and memory usage.
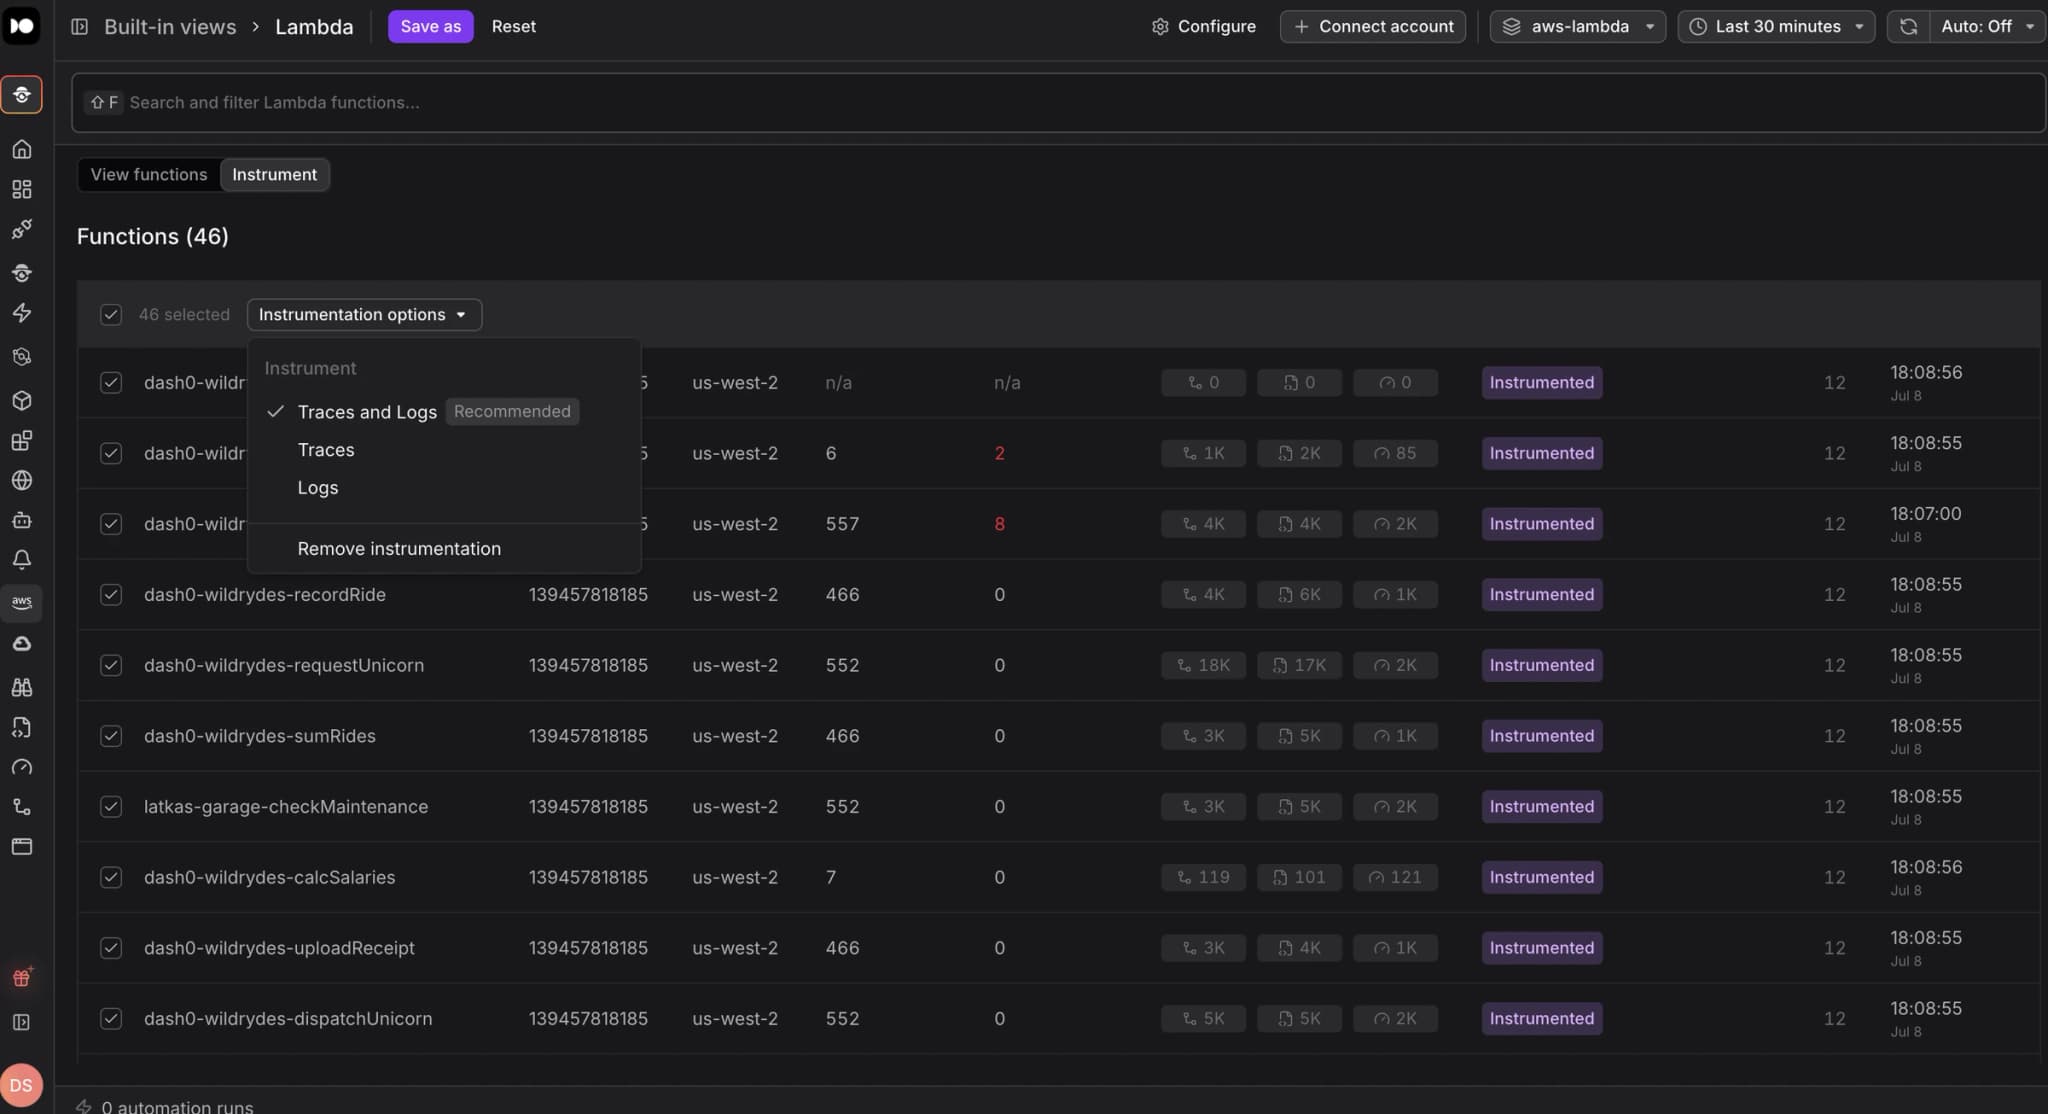
One-click instrumentation from the UI. Instrument functions without touching code or managing layers. Dash0 runs pre-flight validations, adds the Lambda Layer, and tracks status per function. Python, Node.js, and Java supported. Redeploy without the layer and Dash0 detects the drift and re-instruments automatically.
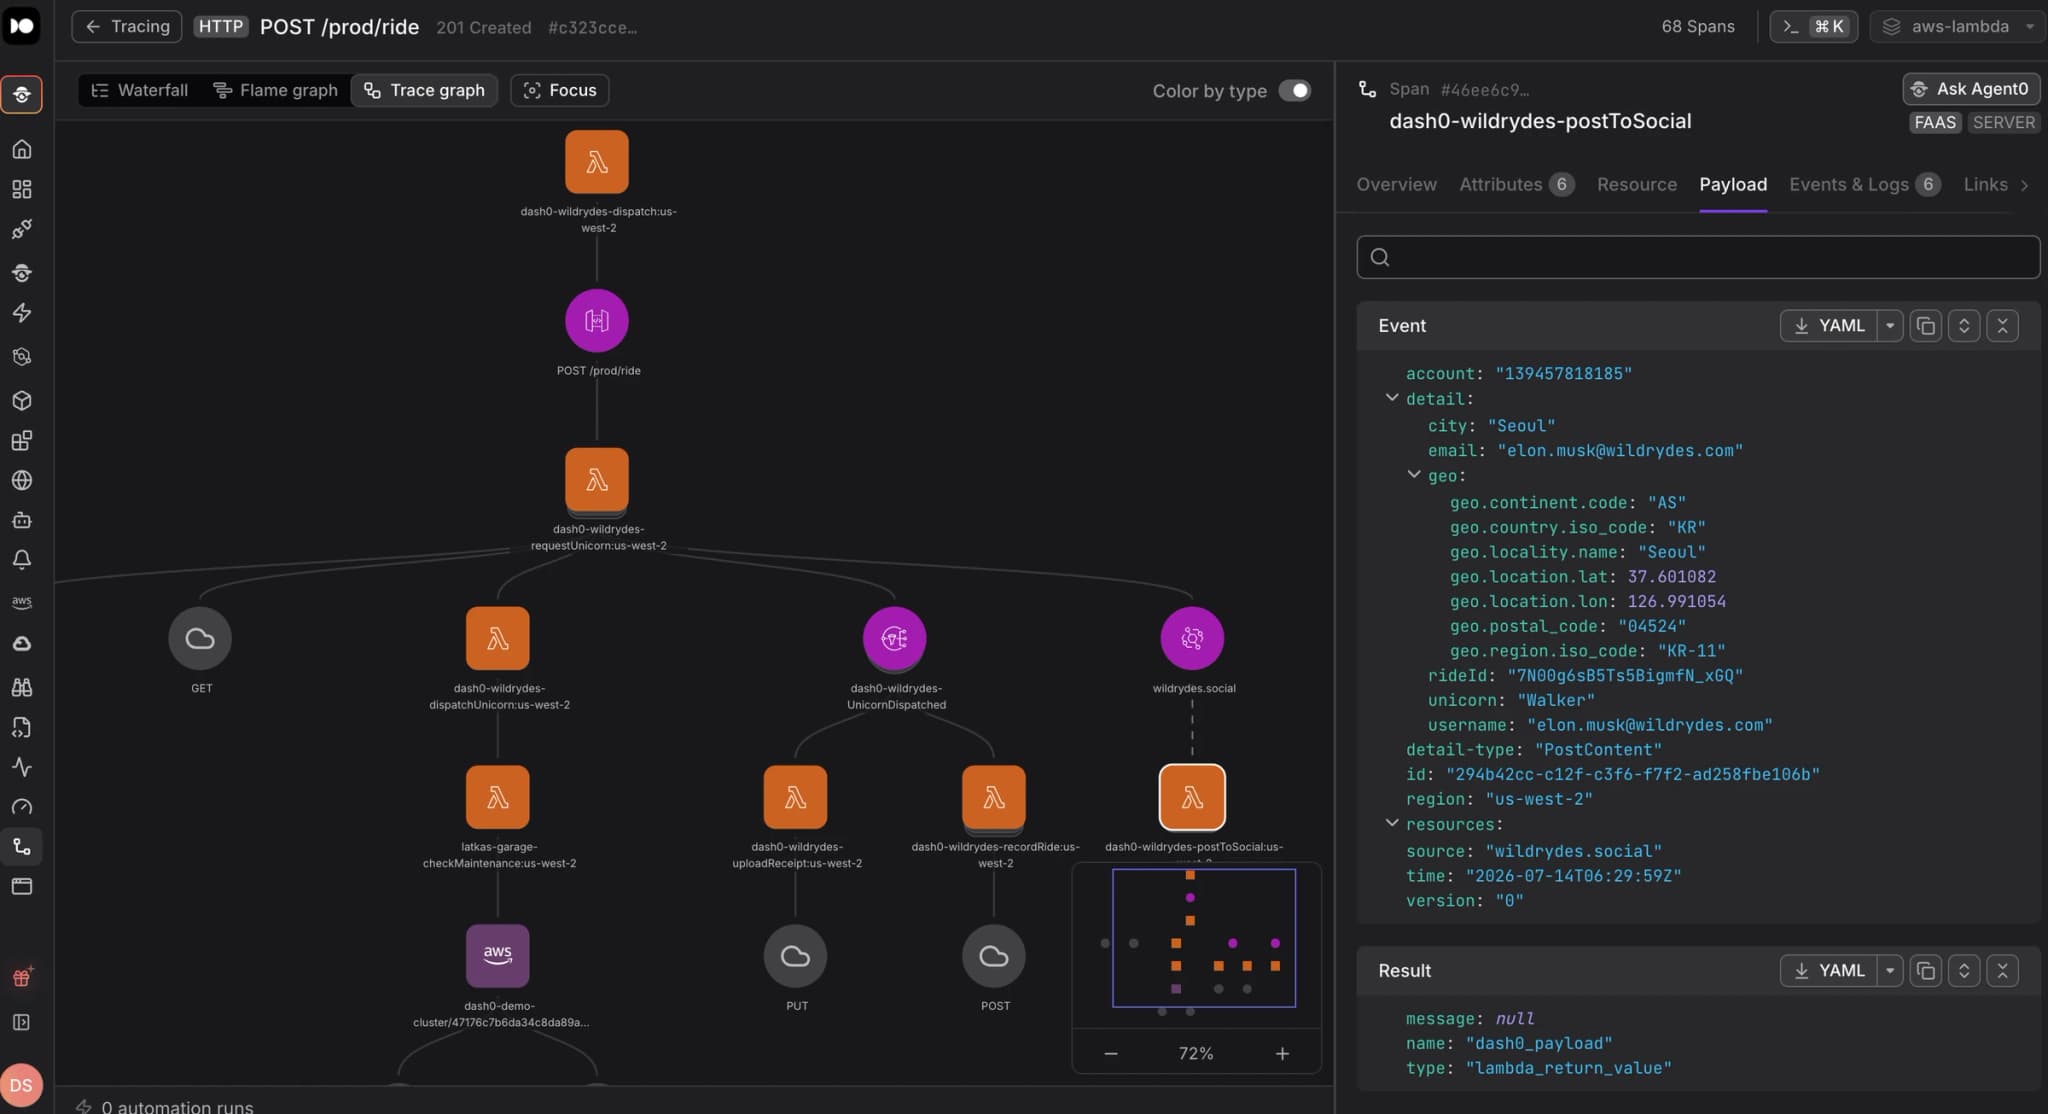
Drill-through to traces and logs. Jump straight from any function's detail page to its traces and logs.
Synthetic traces for timeouts and OOM. When a function is killed by a timeout or out-of-memory error before it can emit telemetry, Dash0 creates a synthetic trace with the duration, trigger source, and context around the failure.
Payload capture. The full event that triggered the function is attached to every trace. Outgoing calls to downstream AWS services are captured too, including request and response bodies. Sensitive values are masked by default.
To get started, go to Integrations and select Connect AWS account.
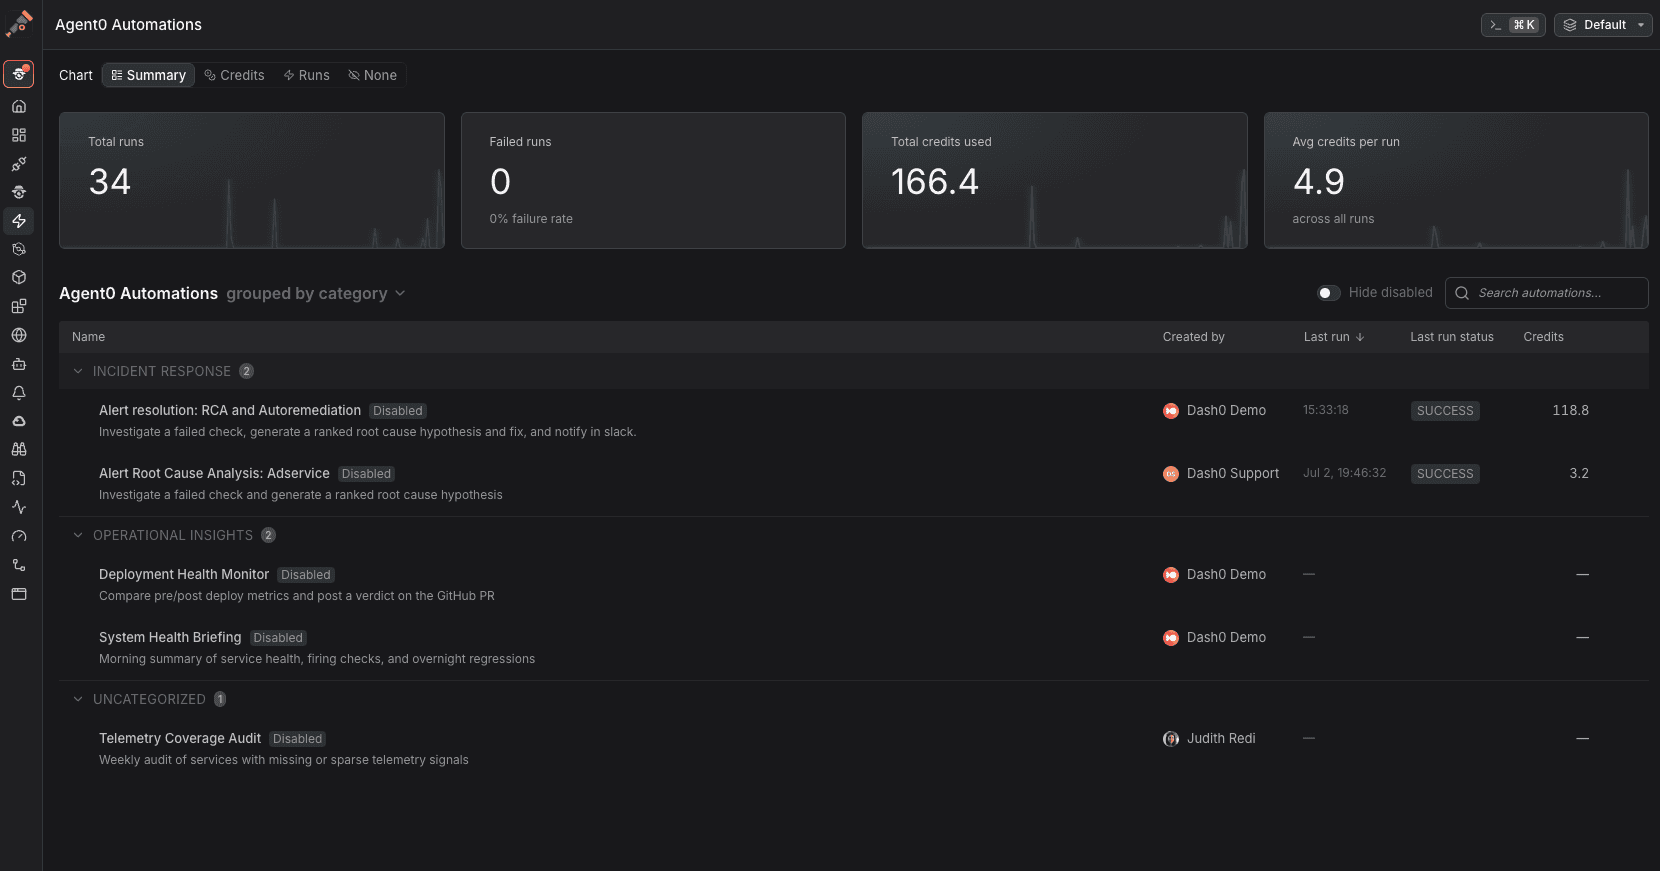
Agent0 investigates, fixes, and reports on its own, triggered by Slack messages, GitHub events, failed checks, webhooks or a schedule. No one has to be in the loop. Unless you want to. You are in control.
Automations are event-driven AI workflows that Agent0 executes on your behalf. You define what to watch and what to do. Agent0 runs the investigation, traces the cause, and delivers the result — no human needs to be in the loop for any of it.
Agent0 automations are GA from today and, as such, consume Agent0 credits on each run.
Event-driven triggers: Respond to Slack messages, GitHub pull requests, failed checks, Linear comments, or run on a schedule.
AI-powered execution: Agent0 analyzes context, queries your Dash0 data, and takes action based on the instructions you write.
Guardrails you control: Read actions run automatically. Write actions like opening a pull request are off by default — you allow or deny tools per automation, explicitly, before anything runs.
Concurrency management: Choose how simultaneous triggers are handled with parallel, queue, skip, or supersede policies.
Notifications: Findings are delivered to Slack, email, or Dash0 with a direct link to the full investigation.
Templates: Start from a catalog of pre-built automations for incident triage, PR review, SLO monitoring, and more, or build one from scratch with a full-view prompt editor.
Spam filters keep unwanted telemetry out of Dash0, but until now they worked silently. Each spam filter now comes with a chart showing exactly how much data it dropped over time, so you can tell at a glance which filters are earning their keep and which ones have gone stale.
Open the spam filter settings and every filter shows its own time series of dropped signals. Log records, spans, metric data points, and web events are each counted separately. A filter that has been quiet for weeks is a candidate for cleanup, while one that suddenly spikes might be telling you that a service started misbehaving upstream. Either way, you no longer have to guess whether a filter is actually matching anything before you edit or delete it.
These charts are available in the UI in the same place you can see all your spam filters
Under the hood, every dropped signal is now attributed to exactly the filter that matched it.
These charts are powered by the dash0.spam_filters.{logs,metric_data_points,spans,web_events}. They are metrics we record for you and you do not pay for, and you (or Agent0) can use them to create your check rules.