


Lambda observability used to mean gluing together CloudWatch and X-Ray, hand-managing OTel layers per function, and building dashboards from scratch, per account, per region, just to see which functions were erroring or cold-starting. And it drifted the moment someone redeployed without the layer.
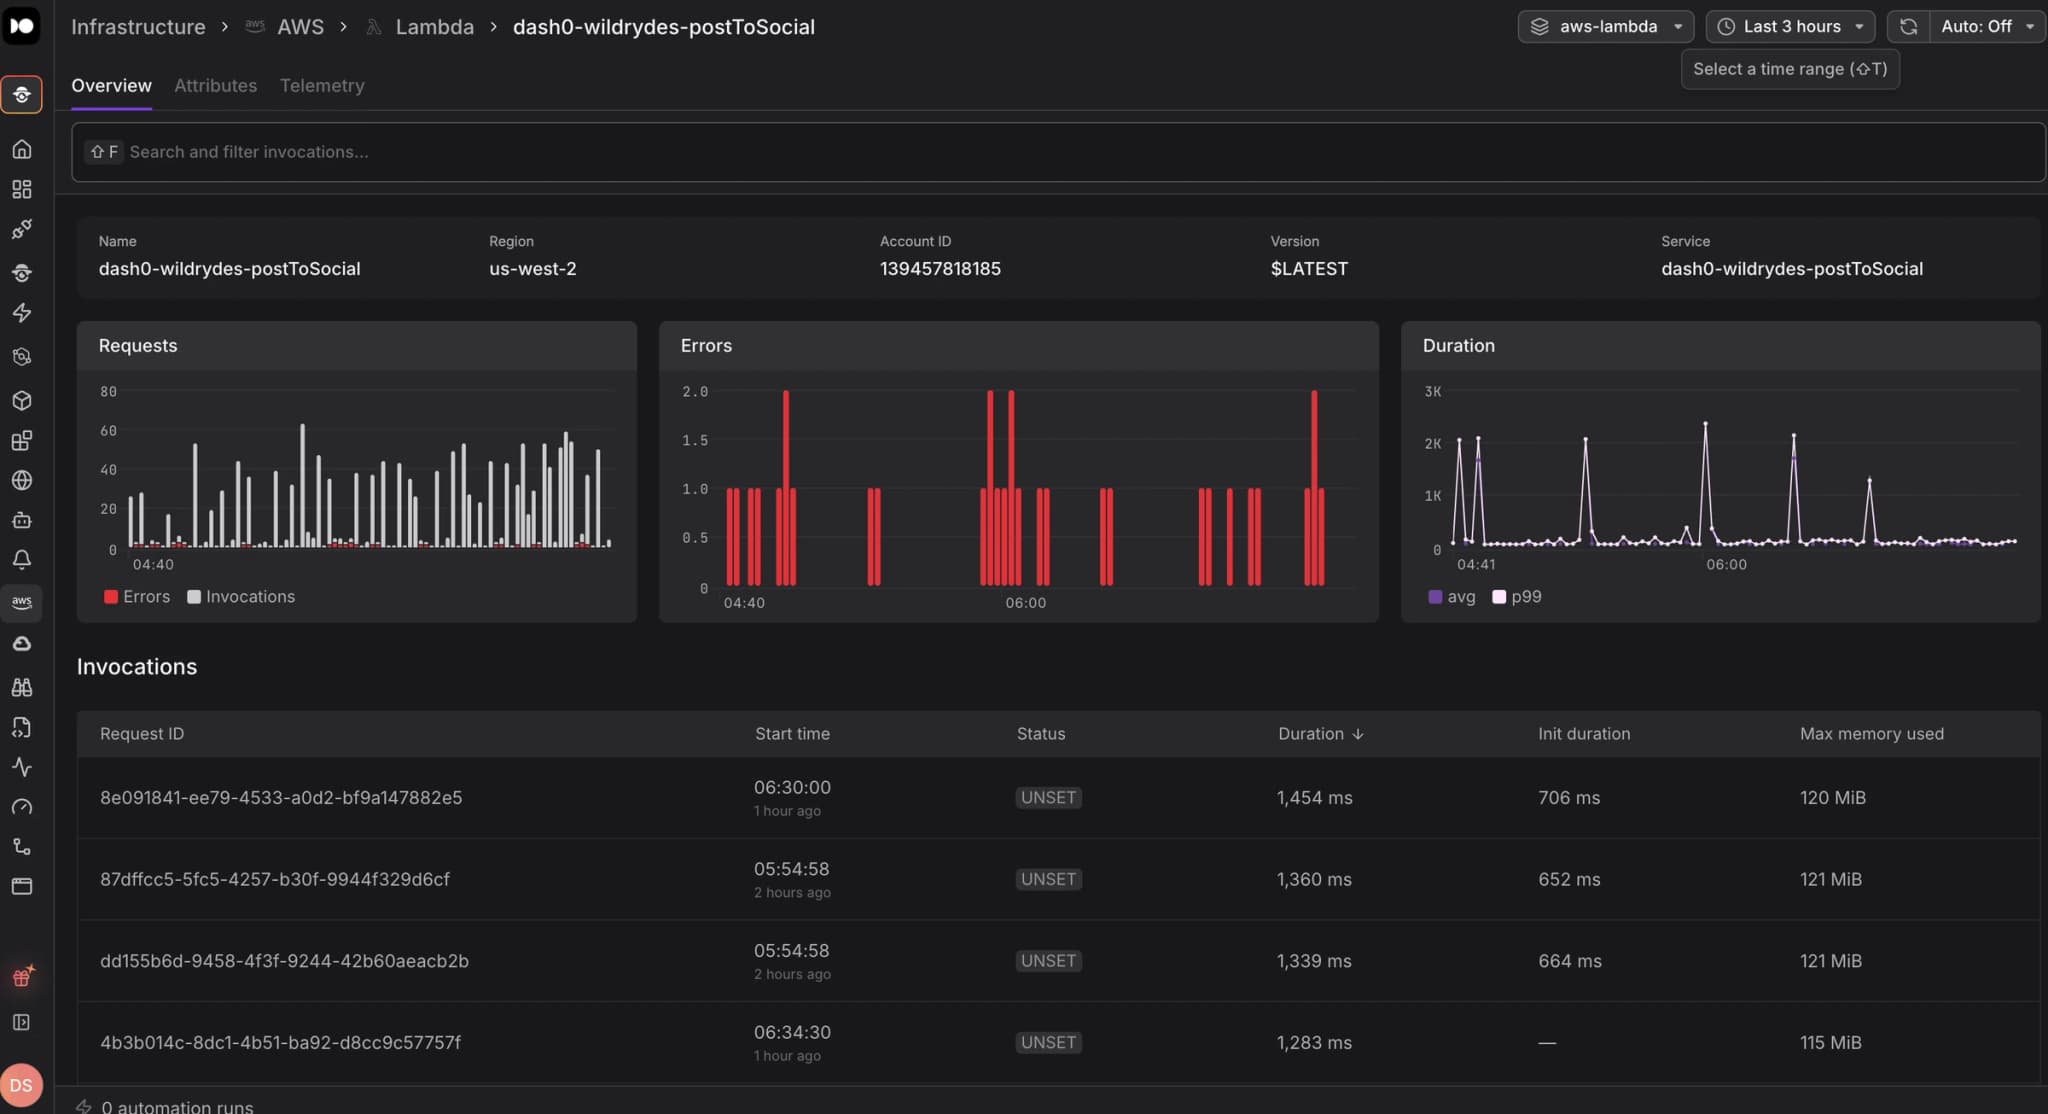
Now you connect your AWS account to Dash0 and see your Lambda functions, invocations, errors, duration, and cold starts, with no dashboards or queries to set up.
What's included
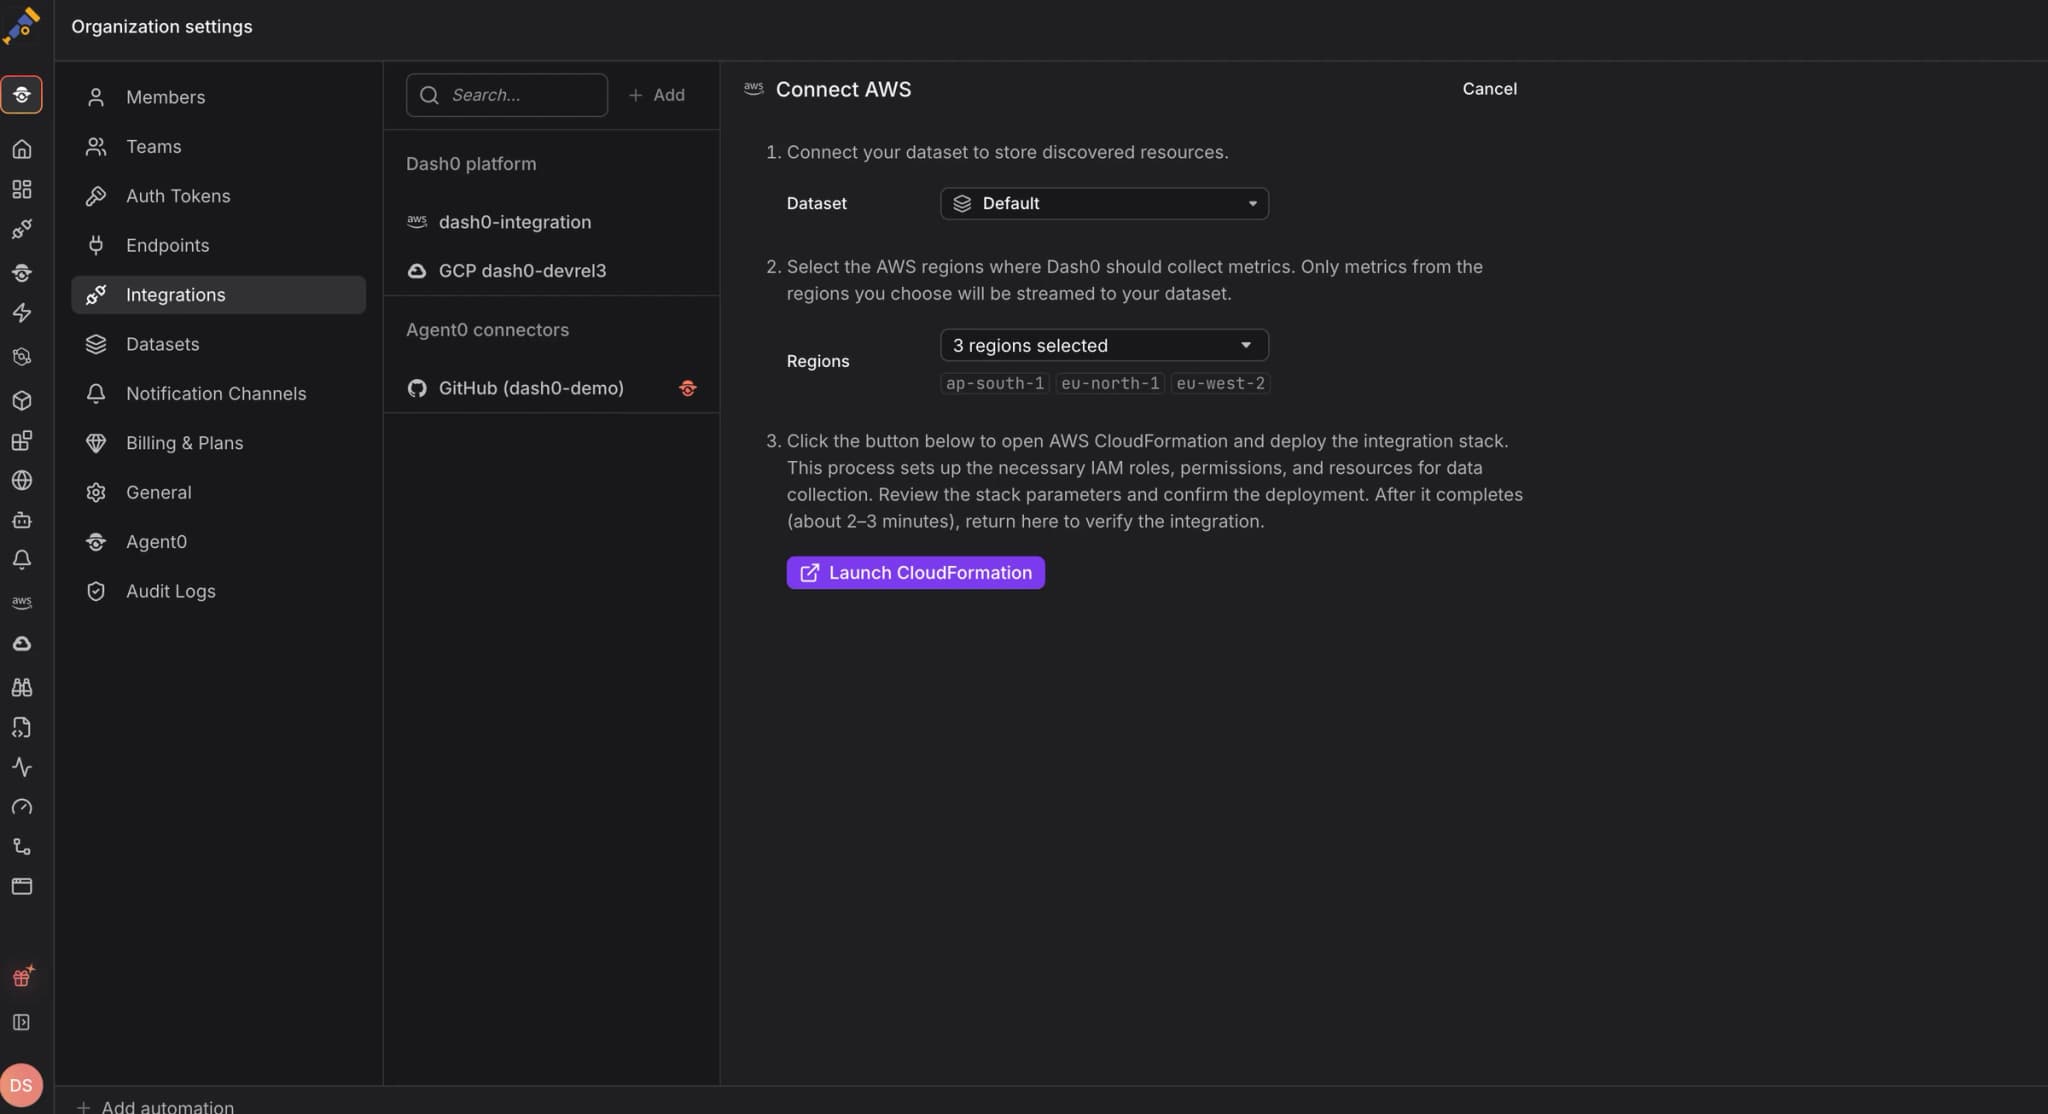
One-click AWS account connection. Connect via CloudFormation in under five minutes. Dash0 uses cross-account IAM role assumption, so no credentials are stored on Dash0's side. Terraform and CDK paths are available for infrastructure-as-code teams.
Lambda resource catalog. Every Lambda function appears with invocation counts, error rates, duration, and cold start metrics, across all connected accounts and regions. Click any function for a full metrics breakdown and an invocation table filterable by result, duration, and memory usage.
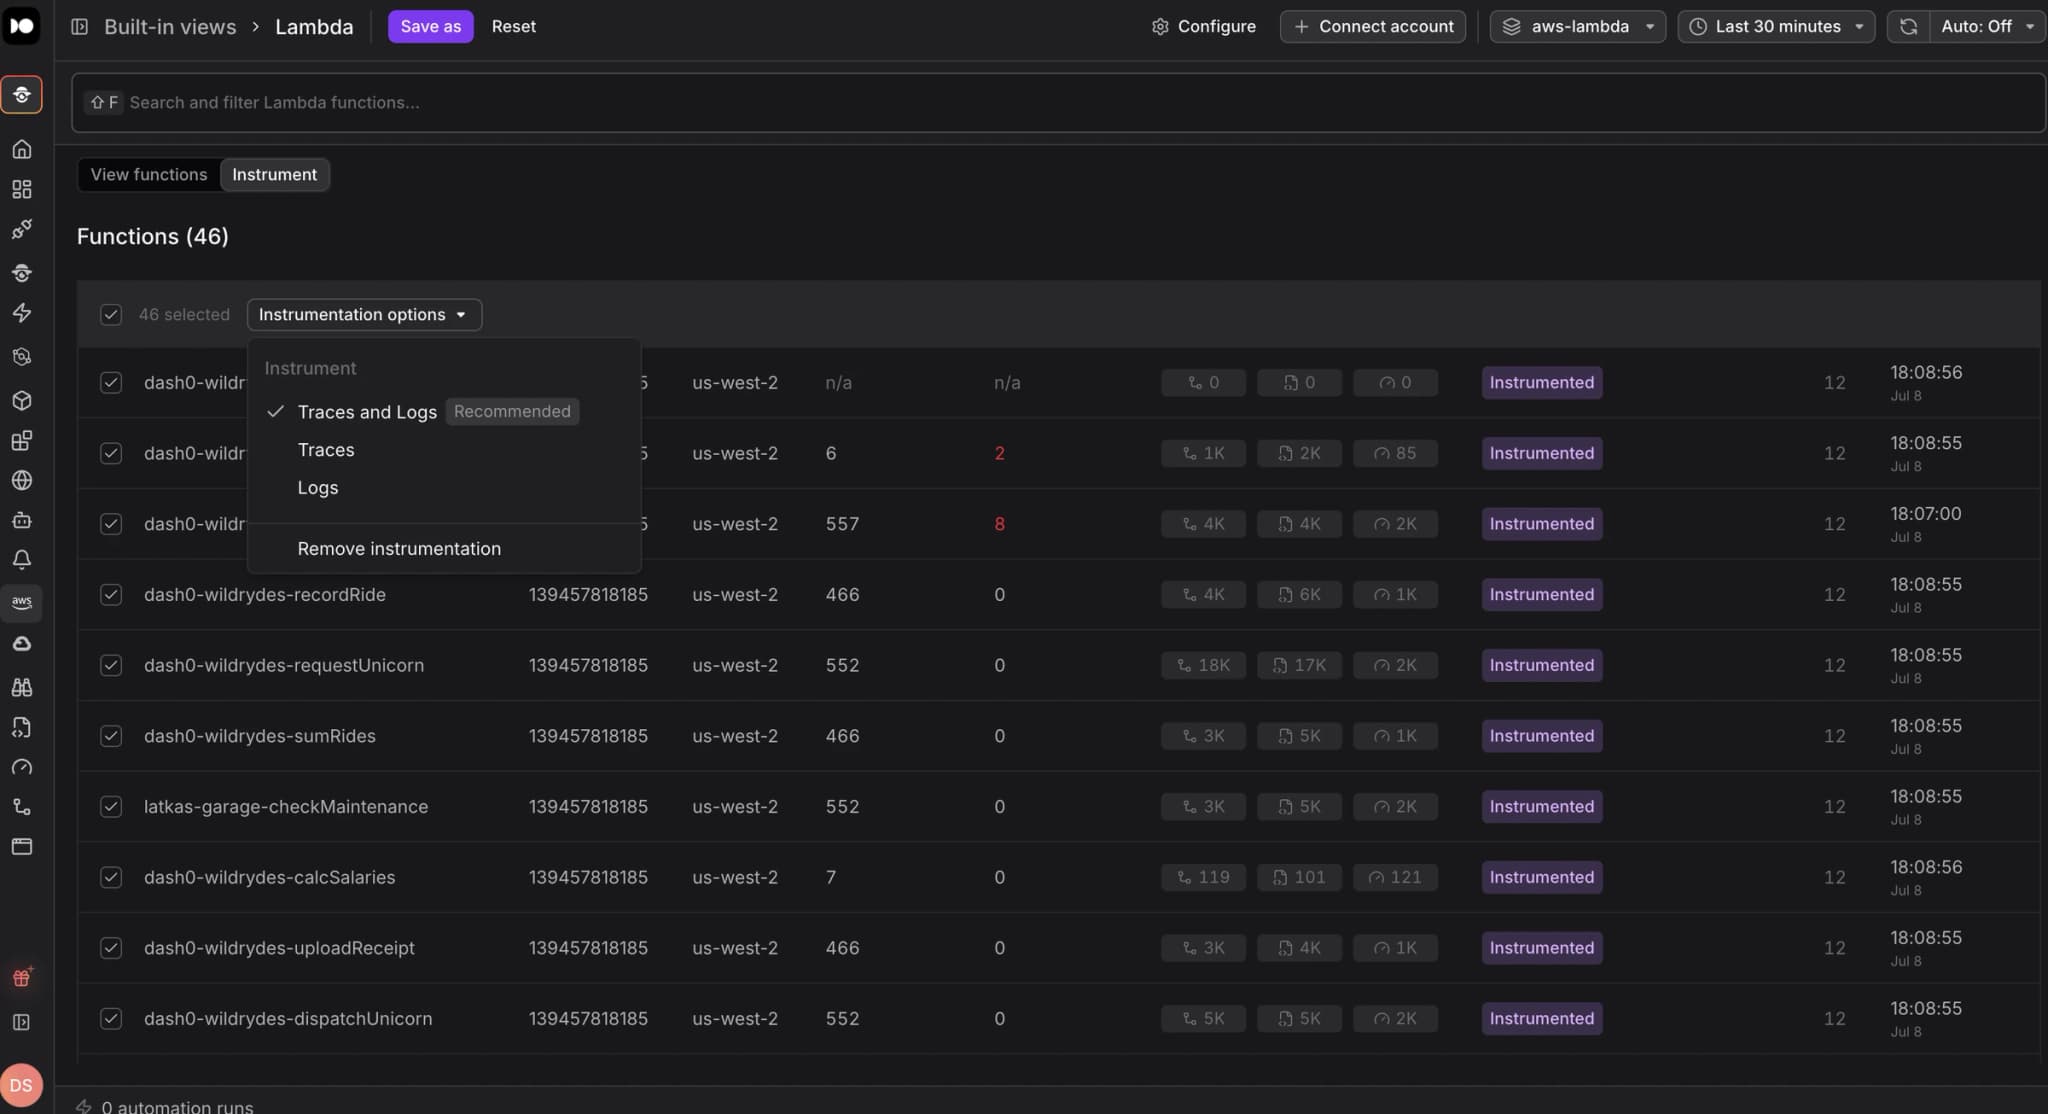
One-click instrumentation from the UI. Instrument functions without touching code or managing layers. Dash0 runs pre-flight validations, adds the Lambda Layer, and tracks status per function. Python, Node.js, and Java supported. Redeploy without the layer and Dash0 detects the drift and re-instruments automatically.
Drill-through to traces and logs. Jump straight from any function's detail page to its traces and logs.
Synthetic traces for timeouts and OOM. When a function is killed by a timeout or out-of-memory error before it can emit telemetry, Dash0 creates a synthetic trace with the duration, trigger source, and context around the failure.
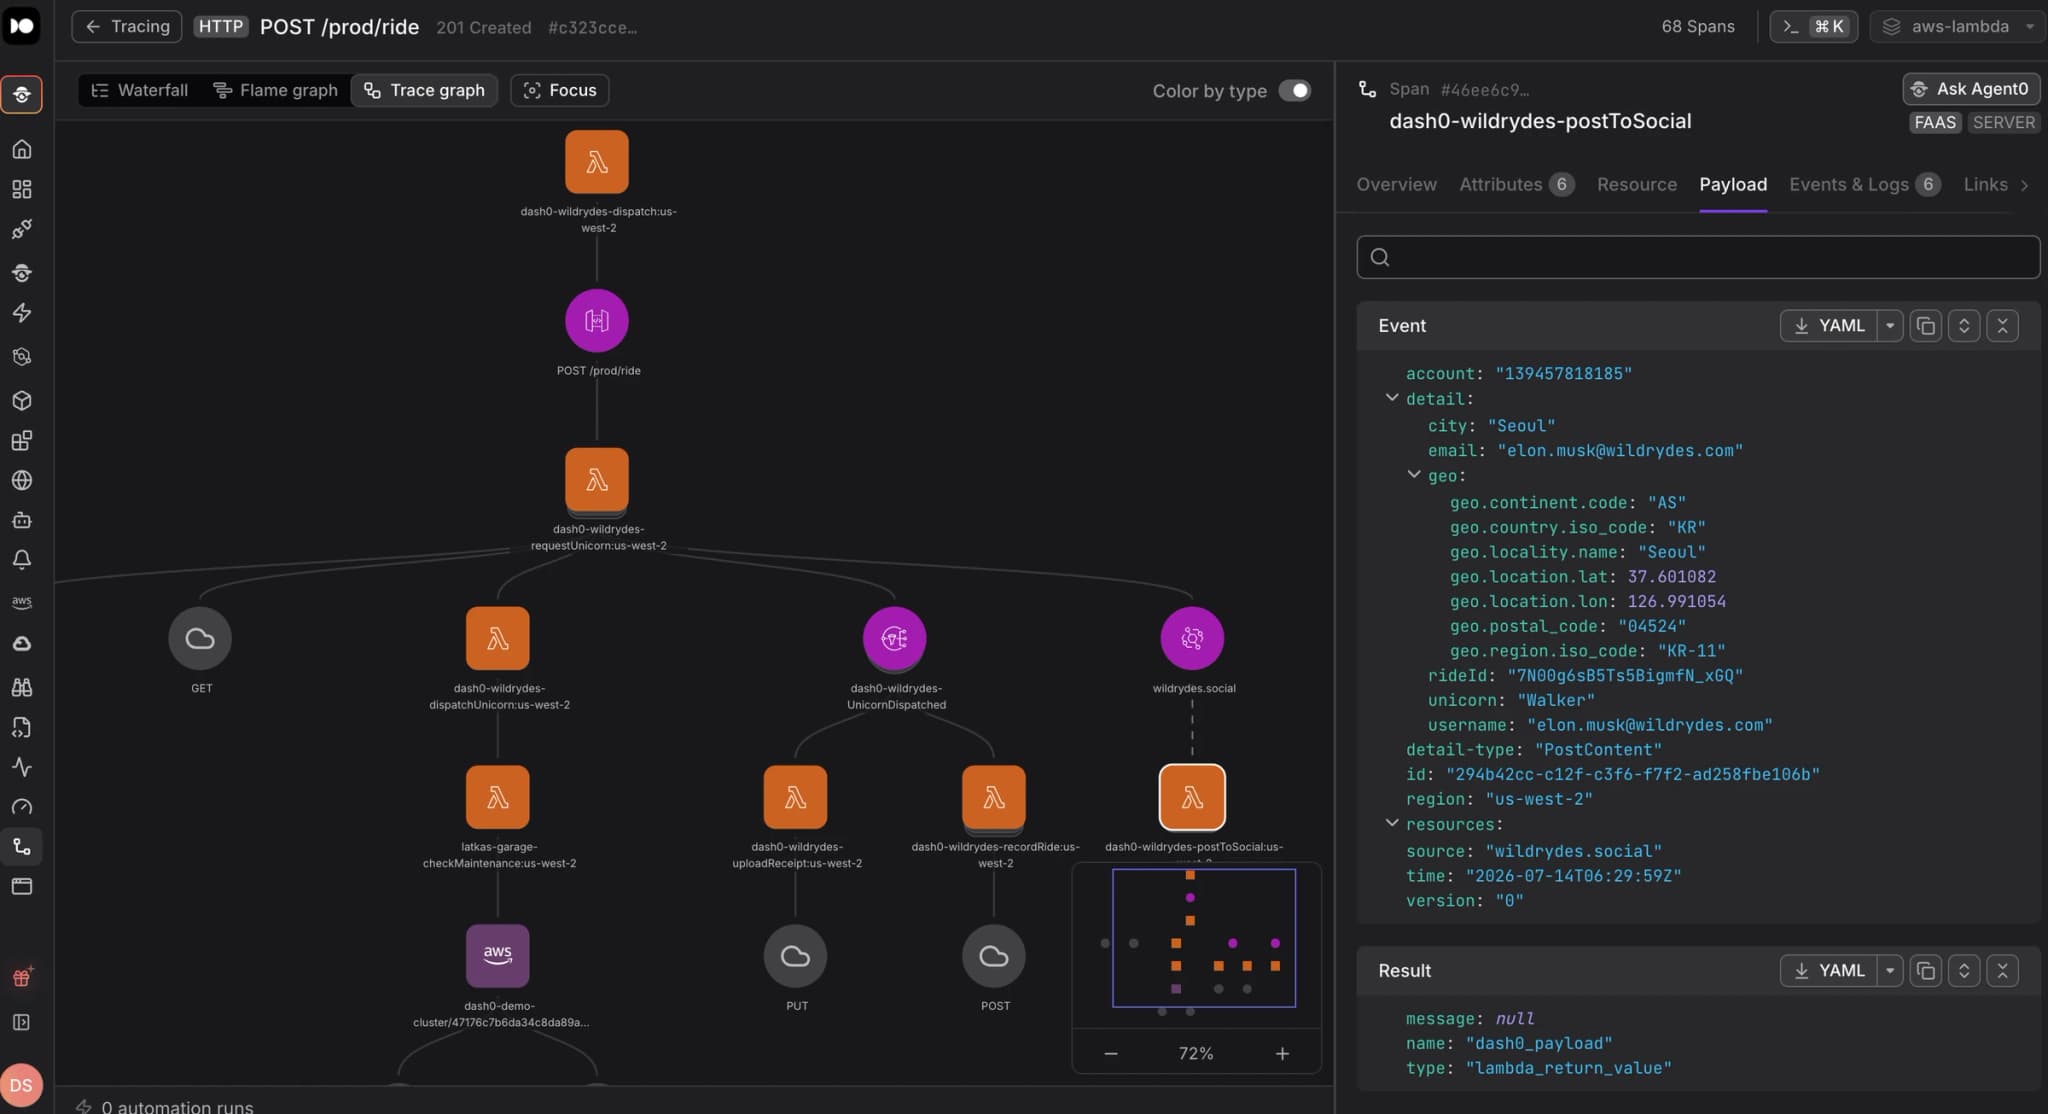
Payload capture. The full event that triggered the function is attached to every trace. Outgoing calls to downstream AWS services are captured too, including request and response bodies. Sensitive values are masked by default.
To get started, go to Integrations and select Connect AWS account.