See how much your spam filters catch
Open the spam filter settings and every filter shows its own time series of dropped signals. Log records, spans, metric data points, and web events are each counted separately. A filter that has been quiet for weeks is a candidate for cleanup, while one that suddenly spikes might be telling you that a service started misbehaving upstream. Either way, you no longer have to guess whether a filter is actually matching anything before you edit or delete it.
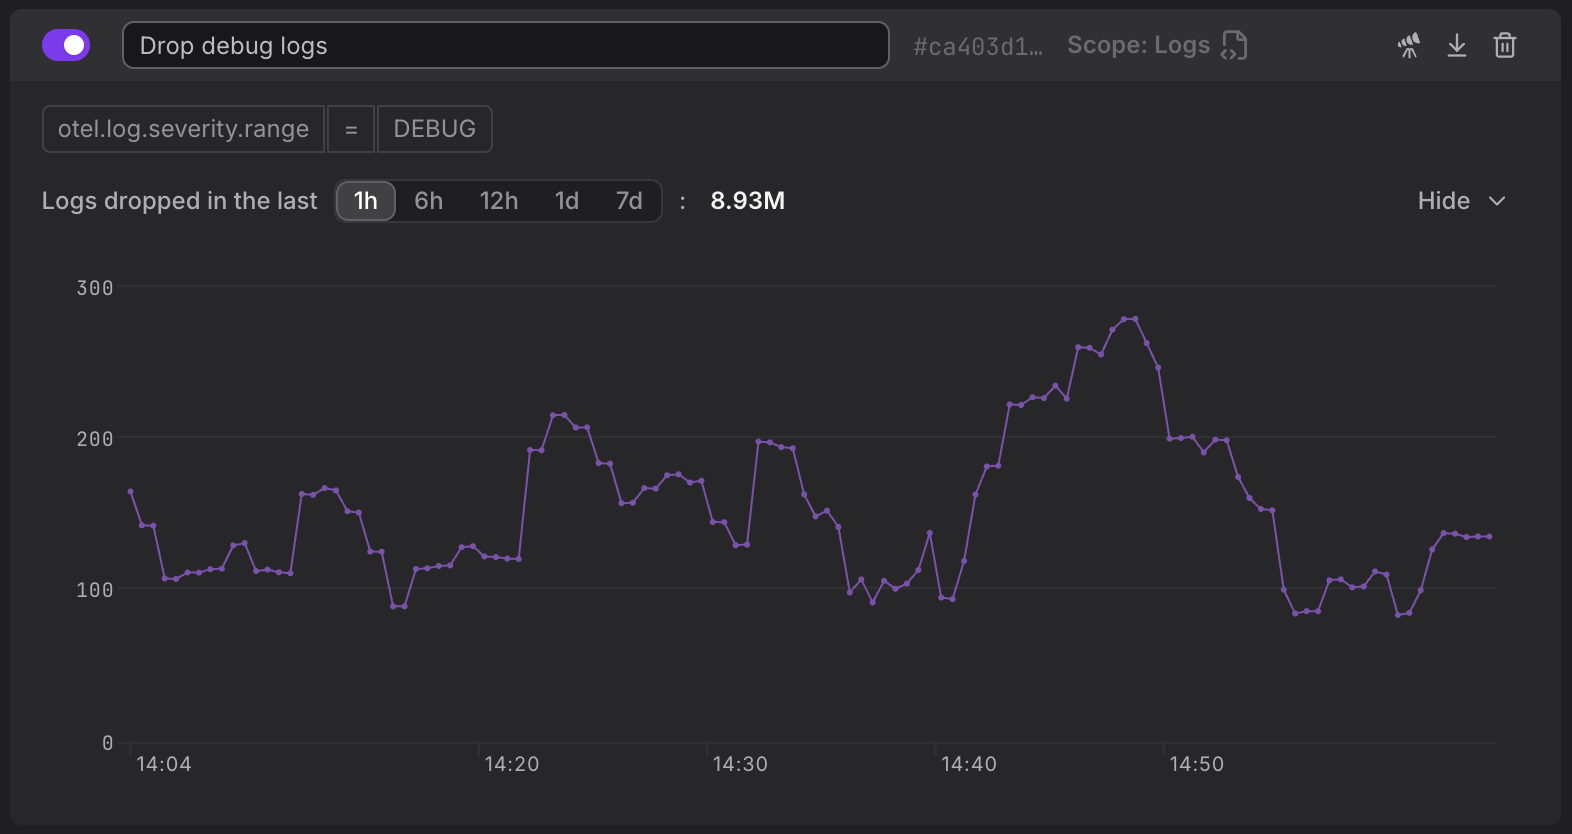
Under the hood, every dropped signal is now attributed to exactly the filter that matched it.
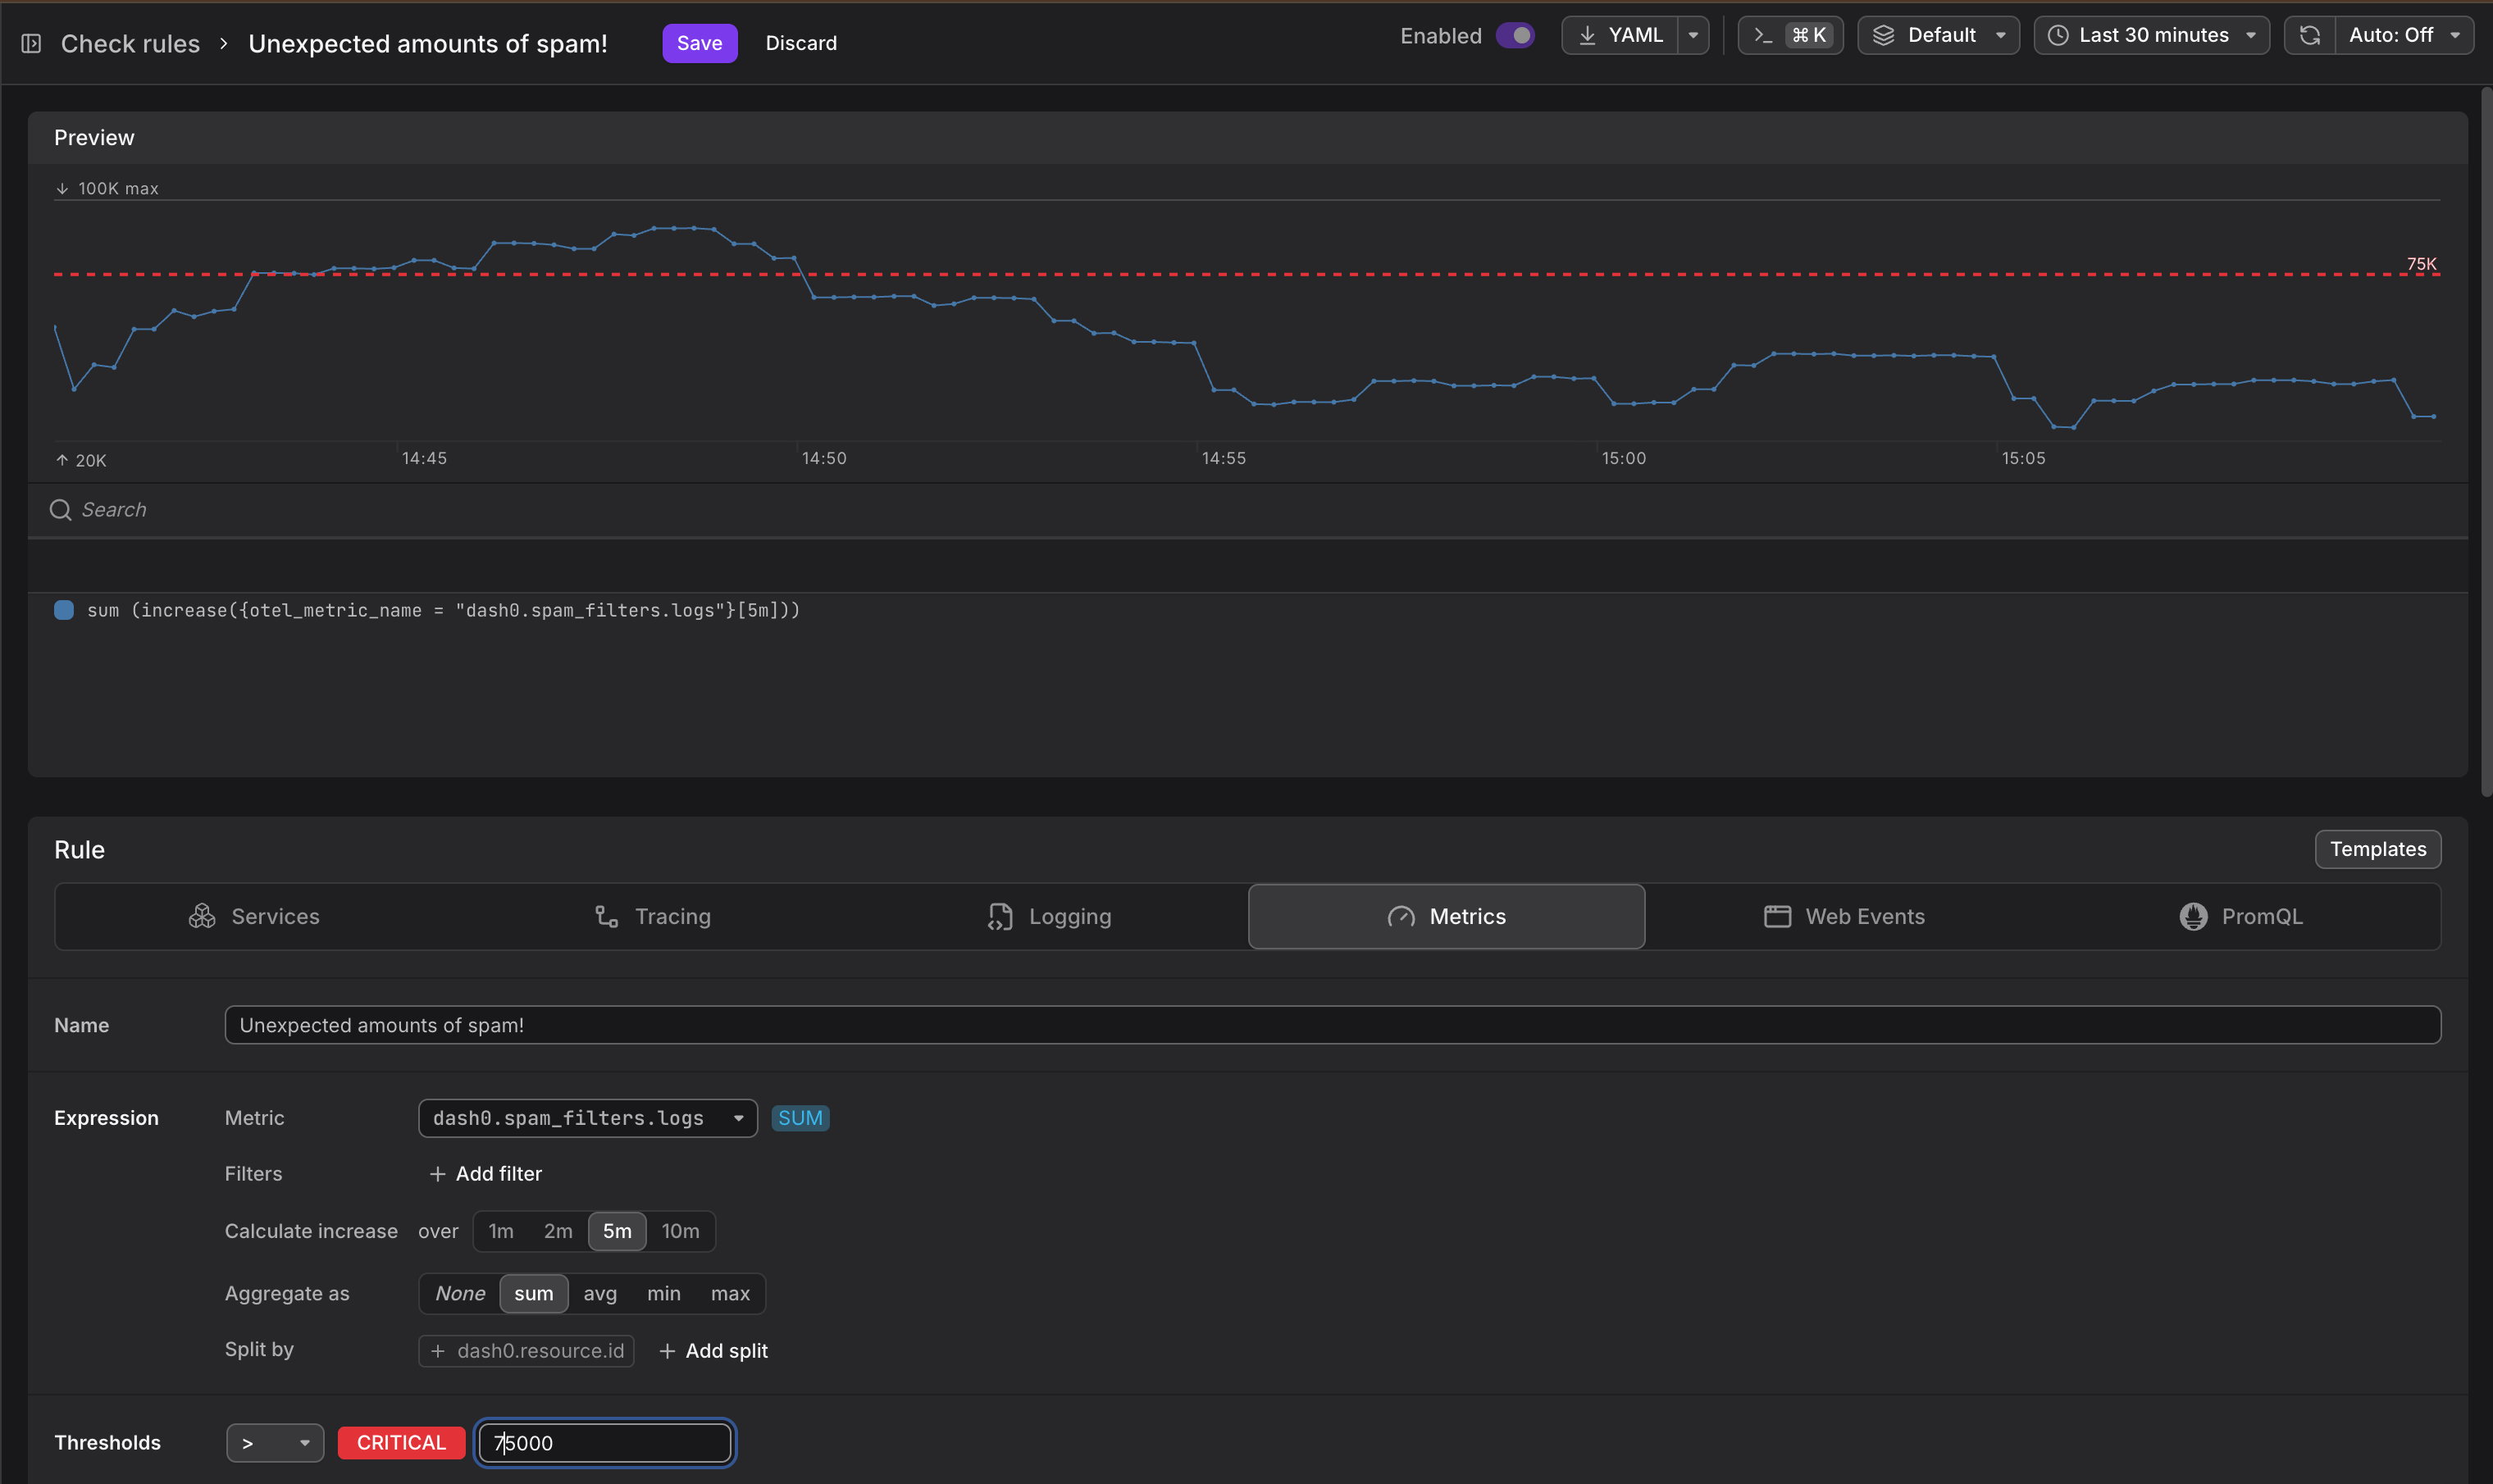
You can alert on it too
These charts are powered by the dash0.spam_filters.{logs,metric_data_points,spans,web_events}. They are metrics we record for you and you do not pay for, and you (or Agent0) can use them to create your check rules.