Last updated: March 31, 2026
OpenTelemetry Spans: Everything You Need to Know
Every distributed trace tells a story, and spans are the chapters that compose it. A span represents a single, named operation within a larger request: an inbound HTTP call, a database query, a message published to a queue, or a chunk of business logic that you explicitly chose to measure. Together, spans form a tree that reconstructs what happened, in what order, and how long each step took.
This article covers OpenTelemetry spans in-depth. You'll learn what fields a span carries and why each one matters, how to create spans in practice, how to attach the attributes and events that make spans useful for debugging, and how to make good decisions about span granularity so your traces stay informative without drowning you in noise.
If you're looking for a broader introduction to how OpenTelemetry tracing works, including the SDK architecture, auto-instrumentation, and the role of the OpenTelemetry Collector, see our companion article on how OpenTelemetry tracing works.
Understanding traces, spans, and the tree they form
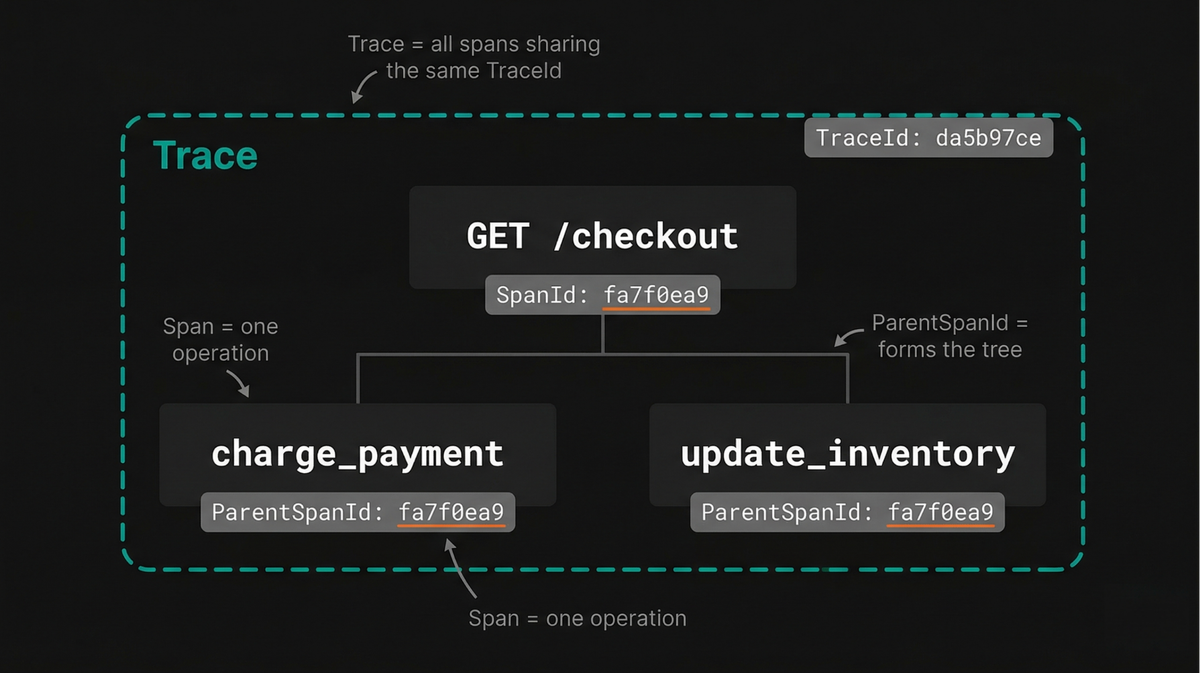
A trace is the complete record of a single request's journey through a
distributed system. It doesn't exist as its own standalone data structure, but
emerges from a collection of spans that all share the same TraceId.
An observability backend reconstructs the full timeline by following the
ParentSpanId on each span, building a hierarchy in much the same way a file
system rebuilds a directory structure from individual entries that reference
their parent.
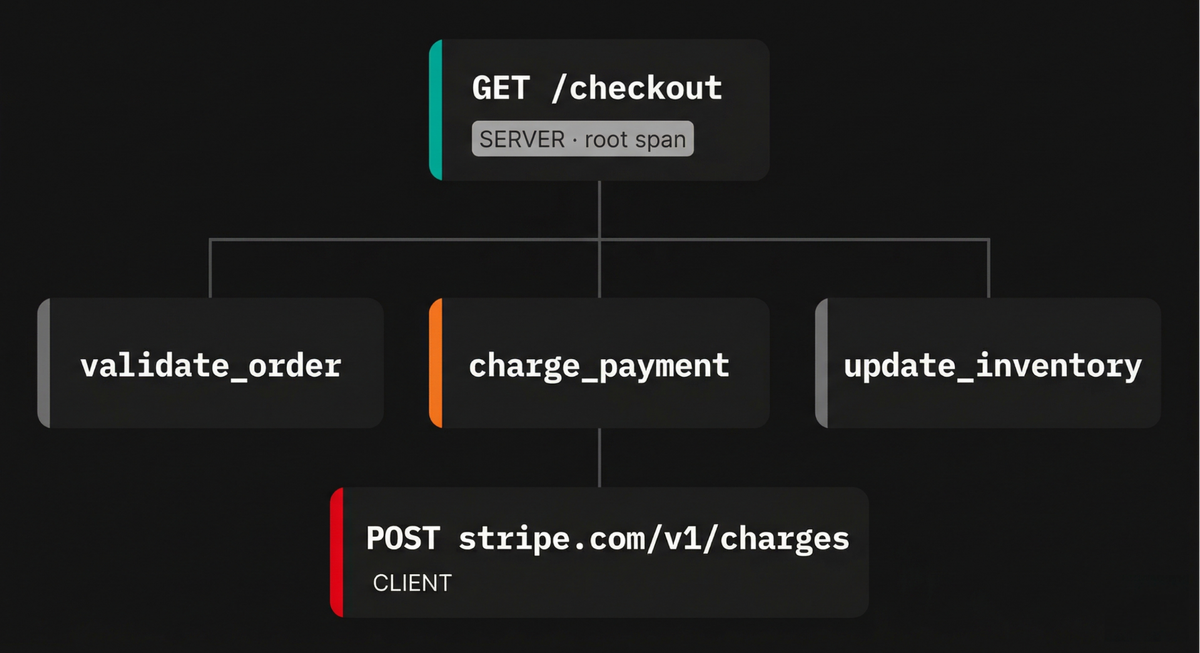
At the top of this hierarchy is the root span, the first span created for a
request. It has no ParentSpanId and typically represents the outer boundary of
work, such as an HTTP server handling an incoming request.
Consider a request to a checkout endpoint that validates the order, charges a payment provider, and updates inventory. The root span represents the full HTTP request, with child spans for each of these steps.
If the payment step makes an outbound call to Stripe, that operation creates another child span under the payment span. As spans accumulate, the trace forms a tree that mirrors the actual execution path of the request.
This hierarchy is what makes tracing useful. Since each span is connected to its parent, you can follow the flow of execution and understand how work is sequenced and related.
When a request is slow, you don't just see that something took time. You see exactly which branch of the tree was responsible, and can drill down step by step until you reach the underlying cause, whether that's a slow database query, a network retry, or some contention in your own code.
This emphasis on relationships between operations is central to how tracing works and aligns with the broader goal of making complex distributed systems easier to reason about and debug in practice
Anatomy of an OpenTelemetry span
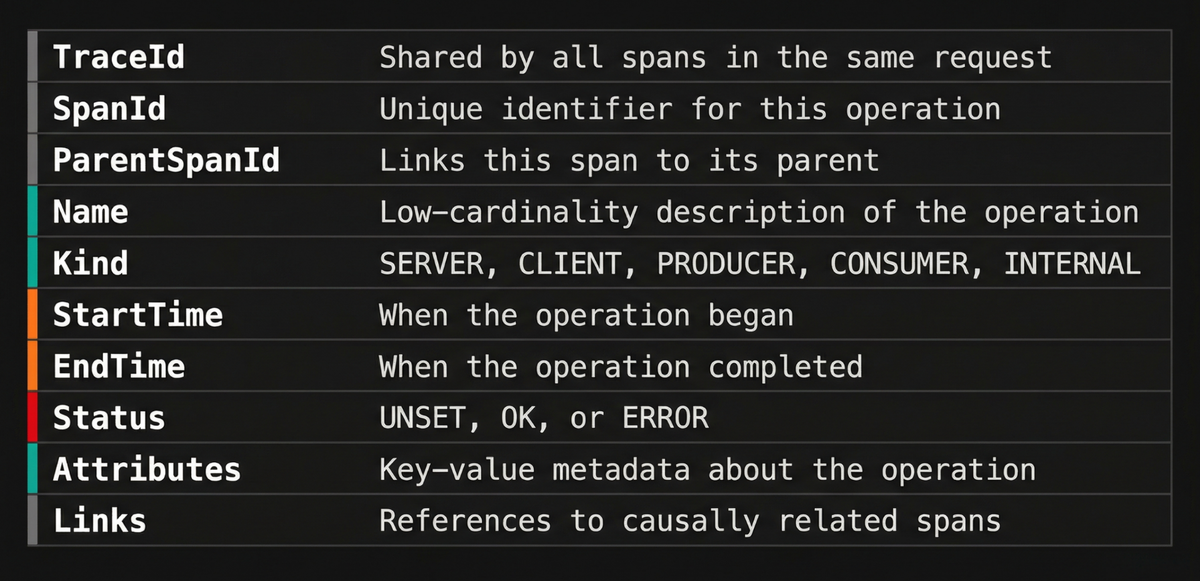
The OpenTelemetry specification defines a set of fields that every span carries. A good way to understand them is by grouping according to the questions they answer:
- Where does this span belong? (trace and parent relationships)
- What operation is this? (name and kind)
- What happened? (timing, status, attributes, events)
With that mental model in mind, let’s walk through each group of fields.
Trace and span identifiers
Every span carries three identifiers that help position it within the trace tree:
-
TraceIdis a 16-byte (128-bit) globally unique identifier shared by every span in the same trace. It's the primary key you'll use to look up an entire request. -
SpanIdis an 8-byte (64-bit) identifier that is unique within the trace. It distinguishes a specific operation from all the others in the same request. -
ParentSpanIdis theSpanIdof a span's parent. Observability backends use this field to reconstruct the tree, so ifParentSpanIdvalues are lost or corrupted (because context propagation broke between two services for example), the affected spans appear as orphans and the trace looks fragmented. Any span without a parent will be regarded as a root span.
The span name
The span name is a low-cardinality, human-readable description of the operation. Good span names describe the class of operation, not the specific instance.
For example, GET /users/{id} is a good HTTP span name because it groups all
requests to that route, while GET /users/8675309 is a poor name because it
produces a unique entry for every user ID, which is more difficult to group in
your backend.
OpenTelemetry's
semantic conventions provide
naming guidance for common operations:
HTTP spans
follow the pattern {method} {target},
database spans
use {db.query.summary} or {db.operation.name} {target}, and
RPC spans use
{rpc.method}.
Auto-instrumentation libraries typically set span names that conform to these conventions automatically, but when you create manual spans, following the same patterns keeps your traces consistent and searchable:
123456789// Good: low-cardinality, describes the class of operationtracer.startActiveSpan("process_order", async (span) => {span.setAttribute("order.id", orderId); // high-cardinality fields belong in attributes});// Bad: high-cardinality, unique per ordertracer.startActiveSpan(`process_order_${orderId}`, async (span) => {// ...});
Keep specifics like IDs, paths, and query parameters in attributes, not in the span name.
Span kind
The span kind clarifies the role a span plays in a distributed interaction by encoding two independent properties: the direction of the call (outgoing or incoming) and the communication style (synchronous request/response or deferred execution).
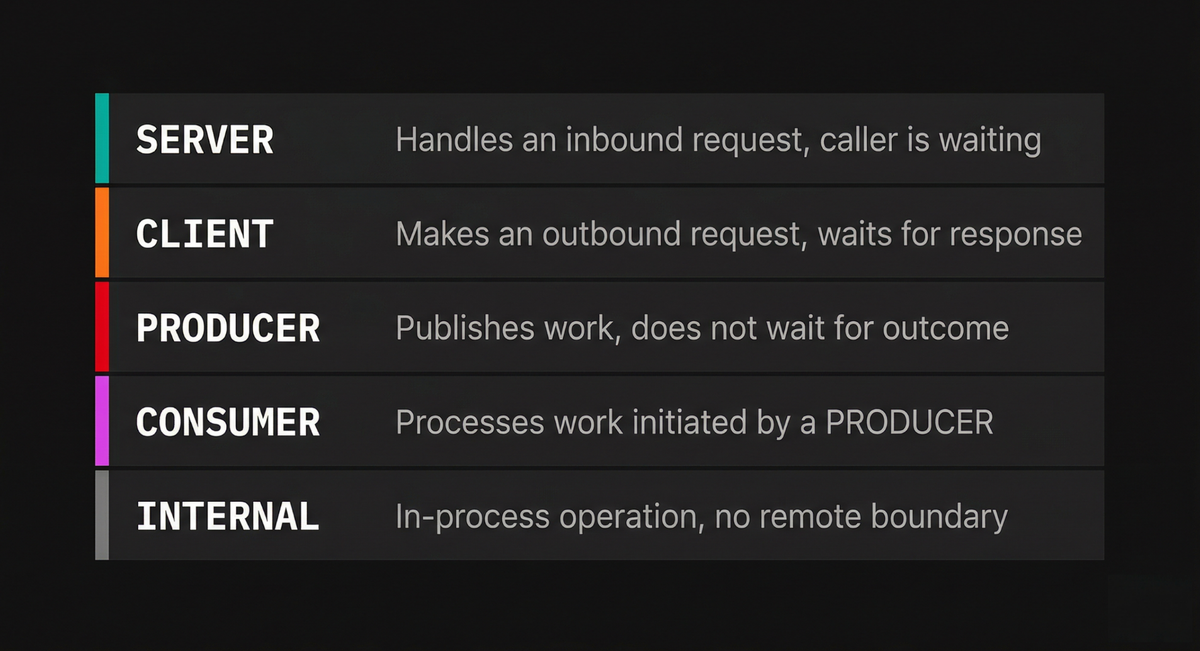
Together, these two axes produce the five possible values:
-
CLIENTrepresents an outgoing request where the caller waits for a response, such as an HTTP call to another service or a database query. When the context of aCLIENTspan is propagated, it typically becomes the parent of aSERVERspan in the receiving service. -
SERVERrepresents the handling of an incoming request that a remote client is waiting on, such as processing an inbound HTTP request or gRPC call. -
PRODUCERrepresents the initiation or scheduling of work where the caller does not wait for the outcome, such as publishing a message to Kafka or SQS. ThePRODUCERspan often ends before the correspondingCONSUMERspan even begins. -
CONSUMERrepresents the processing of work that was initiated by aPRODUCER. Because the producer did not wait for the result, the consumer's span is typically linked to the producer's span rather than being a direct child of it. -
INTERNALis the default. It indicates an operation that stays within the boundaries of a single application, with no remote parent or child. Manual spans for business logic typically use this kind.
Timestamps and duration
The StartTime and EndTime fields are timestamps recorded by the SDK, and the
span duration is derived from these two values. The OTLP wire format represents
them in nanoseconds since the Unix epoch, but the actual precision you get
depends on the language runtime
You'll most likely never need to set timestamps manually. The SDK records
StartTime when you create the span and EndTime when you call span.end().
If you forget to end a span, the SDK may never export it (depending on the
implementation), and the operation will be invisible in your traces.
Span status
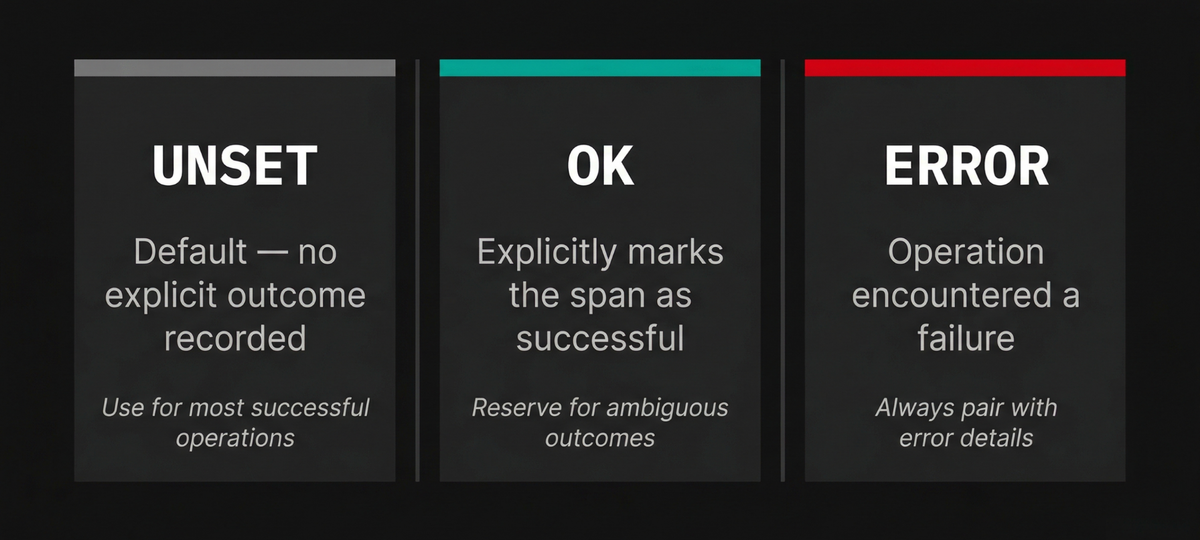
A span's status indicates whether the operation it represents succeeded or failed. OpenTelemetry defines three status codes:
-
UNSETis the default, and it means no explicit status was recorded. For most successful operations, this is the correct value, because the absence of an error is sufficient to indicate success. -
OKexplicitly marks the operation as successful. It should be reserved for when you need to explicitly mark a span as successful rather than stick with the default ofUNSETfor potentially ambiguous outcomes. -
ERRORindicates that the operation encountered an error. When you set this status, you should also record the exception or error details on the span so that someone investigating the trace can see what went wrong without having to correlate with a separate log stream.
It's usually unnecessary to set OK on every successful span, since UNSET
already implies the absence of a known error. Reserve explicit status changes
for cases where the default inference would mislead an investigator.
Span attributes
Attributes are key-value pairs that carry structured metadata about the operation. They're the primary mechanism for encoding both standardized context (via semantic conventions) and domain-specific context.
Semantic conventions define well-known attribute names for common operations.
For HTTP spans,
these include
http.request.method, http.response.status_code, url.full, and
server.address.
For database spans, you'll find db.system.name, db.query.text, and
db.operation.name. Auto-instrumentation libraries populate these
automatically, giving you a baseline of structured context without writing any
code.
Beyond the standard attributes, you can attach your own domain-specific attributes: order IDs, user IDs, tenant identifiers, feature flag states, or anything else that would help you diagnose an issue. These custom attributes are where spans become truly powerful for root cause analysis.
For example, here's how you'd set up span attributes in JavaScript environments:
1234567const span = trace.getActiveSpan();span.setAttributes({"order.id": orderId,"payment.provider": "stripe","payment.amount_cents": 4999,"user.tier": "enterprise",});
A practical guideline is that any value that'll help you debug an issue with that specific operation is a good candidate for its span attributes.
Span events
Span events are timestamped annotations (basically logs) attached to a span. They capture discrete moments within the span's lifetime, such as when a cache miss occurred, when a retry was attempted, or when a downstream dependency responded.
These events carry their own set of attributes, which lets you record context that's specific to that moment. Unlike creating a child span, adding an event does not create a new node in the trace tree; it only adds a data point within the current span's timeline.
Events are well suited for marking transitions or noteworthy moments that do not warrant their own span. If the moment represents a discrete operation with its own start and end time and you'd want to measure its duration independently, then a child span is the better choice.
Historically, span events were recorded through the Tracing API using methods
like span.addEvent() and span.recordException():
1234567891011// These methods should no longer be used in new codespan.addEvent("cache.miss", {"cache.key": `user:${userId}`,"cache.backend": "redis",});try {// Some operation} catch (err) {span.recordException(err);}
However, OpenTelemetry is deprecating these methods in favor of log-based events emitted through the Logs API and correlated with the active span context. The deprecation targets the recording mechanism, not the concept of events appearing on spans. Meanwhile, existing span events will continue to work, and backends will continue to display them on the span timeline.
If you're writing new instrumentation, just use logs to emit events and capture
context rather than calling addEvent() or recordException(). You only need
to make sure the logs are correlated with the active span context so they show
up on the span timeline, preserving the workflow you get with the (now
deprecated) span event API. For more on how this correlation works, see our
article on
how logging works in OpenTelemetry.
Span links
Most spans participate in a single, straightforward parent-child chain. But some operations are causally related to spans in other traces or to multiple parent spans within the same trace, and the parent-child model cannot express these relationships.
Span links solve this by creating an explicit association between two spans
without implying a parent-child hierarchy. Each link references a TraceId and
SpanId and can carry its own attributes.
The canonical use case is asynchronous message processing. When a producer publishes a batch of messages to a queue, each consumer that processes a message later creates its own span and adds a link back to the producer's span. The consumer's span has its own parent (the consumer's server span), but the link to the producer's span preserves the causal chain across the asynchronous boundary.
123456789101112131415161718192021222324252627import { trace, context } from "@opentelemetry/api";import { W3CTraceContextPropagator } from "@opentelemetry/core";const propagator = new W3CTraceContextPropagator();// Extract the producer's span context from// the message metadataconst extractedCtx = propagator.extract(context.active(),message.headers,getter,);const producerSpanCtx = trace.getSpan(extractedCtx)?.spanContext();const tracer = trace.getTracer("consumer-service");tracer.startActiveSpan("process_message",{links: producerSpanCtx ? [{ context: producerSpanCtx }] : [],},async (span) => {span.setAttribute("messaging.message.id", msgId);// ... process the message ...span.end();},);
Links also appear in fan-in scenarios, where a single operation aggregates results from multiple upstream requests. A batch processing job that collects items from several producers can link to each of them, making it possible to trace the full lineage of every item in the batch.
Identifying where spans come from with resource attributes
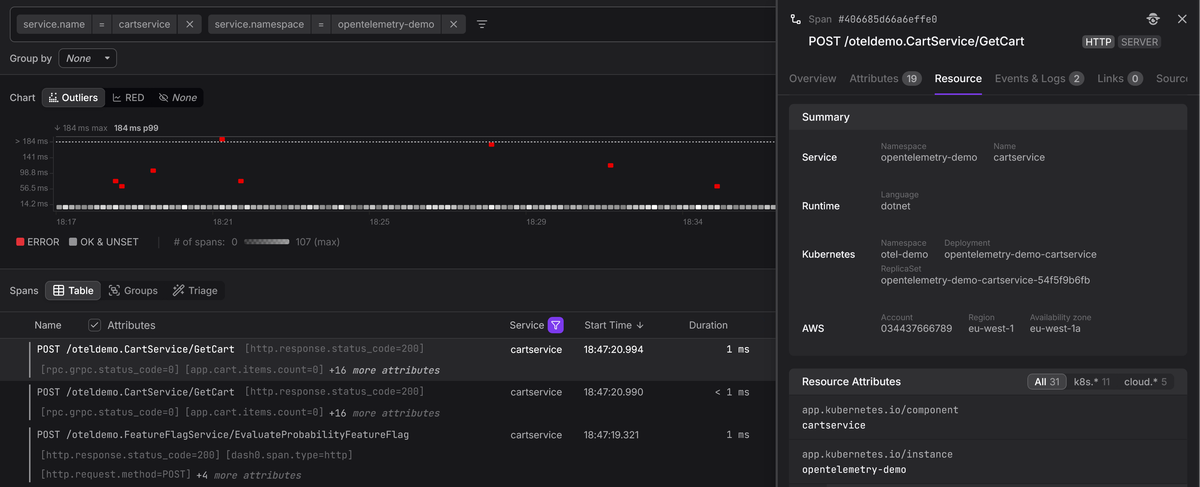
The fields we've covered so far all live on individual spans, but every OpenTelemetry span is also associated with a Resource that describes the entity that produced it. Resource attributes are not per-operation metadata; they are per-process metadata that applies to every span a service emits.
At minimum, you should configure the following three resource attributes:
service.nameidentifies which service produced the span, and it is what your backend uses to group spans into a service in the service list and service map.service.versionlets you correlate a latency regression or error spike with a specific deployment.- And
deployment.environment.namelets you separate production traffic from staging or development, which matters the moment you start filtering traces.
123456789101112import { Resource } from "@opentelemetry/resources";import {ATTR_SERVICE_NAME,ATTR_SERVICE_VERSION,ATTR_DEPLOYMENT_ENVIRONMENT_NAME,} from "@opentelemetry/semantic-conventions";const resource = new Resource({[ATTR_SERVICE_NAME]: "checkout-service",[ATTR_SERVICE_VERSION]: "2.4.1",[ATTR_DEPLOYMENT_ENVIRONMENT_NAME]: "production",});
Without consistent resource attributes, even well-structured spans lack the context needed to answer the most basic triage questions like which service is failing, which version introduced the problem, and which environment is affected.
The OpenTelemetry Collector can enrich resource attributes automatically through processors like resourcedetection (which detects cloud provider, host, and OS metadata) and k8sattributes (which adds Kubernetes metadata like pod name, namespace, and node).
These processors let you keep your application code free of infrastructure-specific configuration while still ensuring every span carries the context needed for effective troubleshooting.
Creating OpenTelemetry spans in practice
The mechanics of creating spans differ between languages, but the general pattern is consistent: acquire a tracer, start a span, annotate it with attributes, do work, and end the span. The SDK handles recording timestamps, managing the active context, and exporting the finished span:
123456789101112131415161718192021222324252627282930import { trace, SpanStatusCode } from "@opentelemetry/api";import logger from "./logger.js"; // Pino instanceconst tracer = trace.getTracer("checkout-service");async function processOrder(orderId, userId) {return tracer.startActiveSpan("process_order", async (span) => {span.setAttributes({"order.id": orderId,"user.id": userId,});try {await validateOrder(orderId);await chargePayment(orderId);await updateInventory(orderId);span.setStatus({ code: SpanStatusCode.OK }); // if deemed necessary} catch (err) {logger.error({ err, orderId }, "order processing failed");span.setStatus({code: SpanStatusCode.ERROR,message: err.message,});throw err;} finally {span.end();}});}
The startActiveSpan() method creates the span and sets it as the current
active span on the context. Any child spans created inside the callback (for
example, by auto-instrumented HTTP or calls within chargePayment())
automatically become children of process_order. The finally block ensures
the span is always ended, even if an exception is thrown.
Retrieving and enriching the active span
You don't always have a direct reference to the current span, especially when you want to add context from deep inside a call stack without threading the span object through every function signature. In such cases, you can retrieve the active span from the current context and attach attributes to it:
12345678910111213141516import { trace } from "@opentelemetry/api";function applyDiscount(cart) {const span = trace.getActiveSpan();if (!span) return calculateTotal(cart);const discount = resolveDiscount(cart);span.setAttributes({"discount.code": discount.code,"discount.percent": discount.percent,"cart.item_count": cart.items.length,});return calculateTotal(cart, discount);}
This pattern is useful when auto-instrumentation has already created a span for
the current request, and you want to enrich it with business context rather than
creating a new child span. The getActiveSpan() call returns whatever span is
currently active on the context, or undefined if none exists, so guarding
against a missing span keeps the code safe in situations where tracing is not
configured.
Context propagation is how spans connect across services
A trace that stays within a single process is useful, but the real value of distributed tracing comes from connecting spans across service boundaries. This connection depends on context propagation, the mechanism that carries trace identifiers from one service to the next.
When an instrumented service makes an outbound HTTP call, the OpenTelemetry SDK injects the current span's context into the request headers. The most widely used format is the W3C Trace Context standard, which uses two headers:
-
traceparentcarries the trace ID, the current span ID, and trace flags (including the sampling decision) in a compact, hyphen delimited format:text1traceparent: 00-da5b97cecb0fe7457507a876944b3cf2-fa7f0ea9cb73614c-01 -
tracestateis an optional header that allows vendors or applications to carry additional, vendor-specific trace metadata alongside the standard context.
When the receiving service processes the request, its SDK extracts the
traceparent header, creates a new span with the extracted TraceId and uses
the incoming SpanId as its ParentSpanId. This is how a request that passes
through five services, each running a different language runtime, can appear as
a single, coherent trace in your observability backend.
Context propagation also works over messaging systems. When a producer publishes a message, the SDK injects trace context into the message metadata, and the consumer extracts it when processing the message. Depending on the relationship model, the consumer either creates a child span (for direct request-reply patterns) or adds a link to the producer's span (for batch or fan-out patterns).
If context propagation breaks at any point, whether because a proxy strips the
traceparent header, a service is not instrumented, or a middleware does not
forward the headers, the trace fractures. Downstream spans will start new traces
with fresh TraceId values, and the end-to-end view is lost. This is one of the
first things to check when traces appear incomplete.
For a deeper look at the W3C Trace Context standard, see our article on traceparent and tracestate.
Deciding when to create a span
Not every function call deserves its own span. Over-instrumentation produces deep, noisy trace trees that are hard to navigate and expensive to store, while under-instrumentation leaves blind spots that force you back to log-based debugging. The goal is to find a balance where every span in a trace contributes to your ability to understand what happened and why.
A useful heuristic is creating a span when the operation crosses a boundary or represents a decision point that you would want to investigate independently.
Good candidates for spans
-
Inbound and outbound network calls are almost always worth tracing. Auto-instrumentation handles these for you in most frameworks, so you get HTTP, gRPC, database, and messaging spans without writing any code.
-
Significant business logic operations that represent a distinct step in a workflow, such as "validate order", "calculate shipping", or "apply discount rules", benefit from manual spans. These give you visibility into the parts of your application that auto-instrumentation cannot reach.
-
Operations that might fail independently or have variable latency, such as calls to external providers, cache lookups with fallback logic, or retry loops, are valuable to trace because they are common sources of production issues.
Poor candidates for spans
-
Pure computation that runs in microseconds and never fails independently (like a string formatting function or a simple arithmetic calculation) does not warrant its own span. The overhead of creating, recording, and exporting a span would dwarf the cost of the operation itself.
-
Iterations within a loop are rarely useful as individual spans. If you are processing 1,000 items in a batch, creating 1,000 child spans makes the trace nearly impossible to read. Instead, create a single span for the batch operation and use attributes to record aggregate information (item count, success count, failure count).
-
Thin wrapper functions that immediately delegate to another instrumented function produce redundant spans that clutter the trace without adding information. If the inner function already has a span (from auto-instrumentation or its own manual span), wrapping it in another span just adds an extra level of nesting.
When in doubt, start with auto-instrumentation alone, then examine the traces it produces. Identify the gaps where you lack visibility into business logic or complex decision paths, and add manual spans only for those operations.
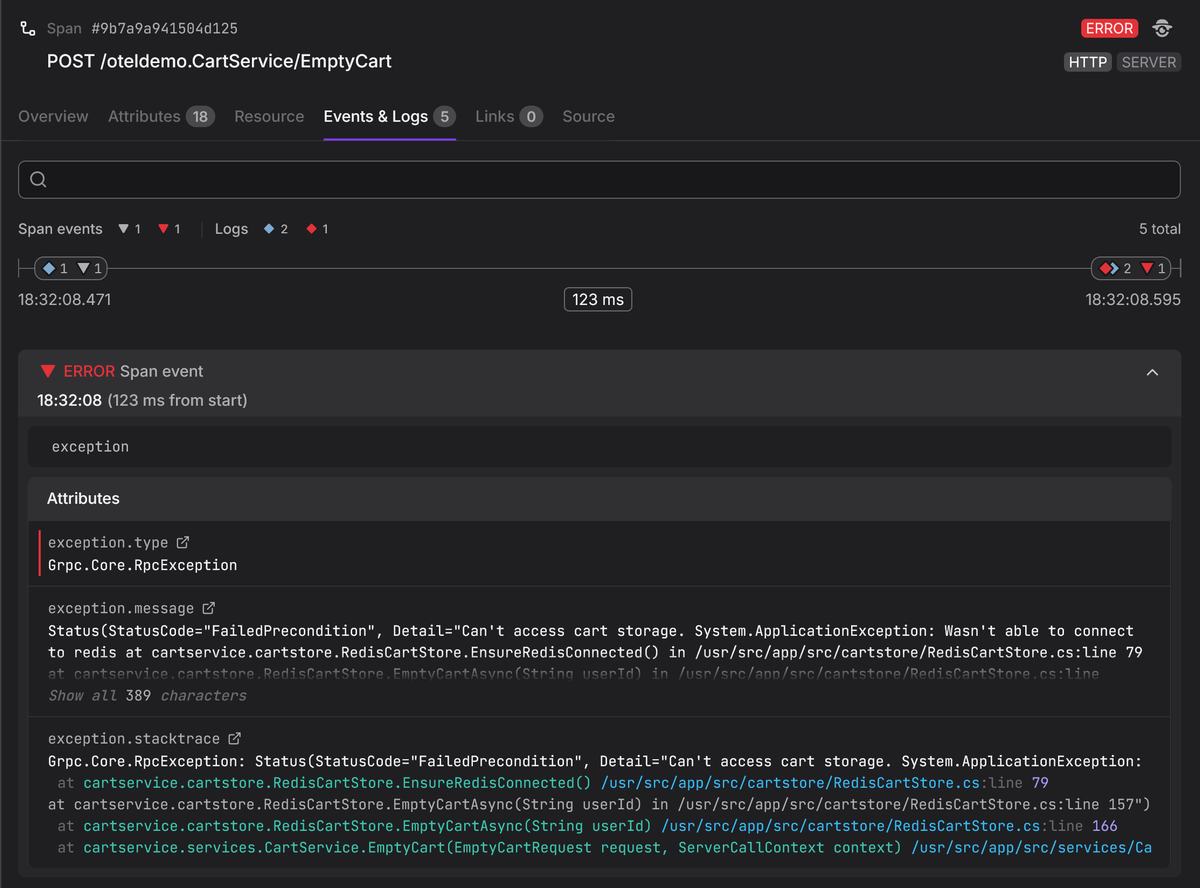
Recording errors on spans
When an operation fails, the span that represents it should capture enough information for an engineer (or AI Agent) to understand what went wrong without needing to cross-reference logs or reproduce the issue.
There are two parts to this: setting the span status to ERROR so the span
shows up in error-focused queries, and logging the error details so they are
available in the span's context.
123456789101112import logger from "./logger.js"; // Pino instancetry {const result = await callExternalService();} catch (err) {logger.error({ err }, "external service call failed");span.setStatus({code: SpanStatusCode.ERROR,message: err.message,});throw err;}
Setting the span status to ERROR is what makes the span appear in
error-focused queries and dashboards. Without this step, the span will look
normal regardless of what you log, because backends use the status field to
determine whether a span represents a failure.
The logger.error() call captures the exception details (type, message, stack
trace) as a structured log record. With an OpenTelemetry log bridge configured,
the active span's trace and span IDs will be attached to the log record, so your
backend can display the error directly on the span's timeline.
This replaces the older recordException() pattern, which created a span event
internally; the log-based approach produces the same diagnostic value while
aligning with OpenTelemetry's direction of unifying events under the Logs API.
Viewing and analyzing traces in practice
Understanding span fields in the abstract is useful, but the payoff comes when you use them to diagnose production issues. When a trace arrives in an OpenTelemetry-native backend, each span's full structure is preserved: identifiers, timing, attributes, events, status, and links.
A typical investigation starts by searching for traces that match a symptom:
elevated latency on a specific endpoint, errors for a particular customer, or
failures in a specific region. The attributes you attached to your spans are
what make these queries possible. Without a user.id attribute, you cannot
filter for a specific customer's traces, and without
deployment.environment.name resource attribute, you cannot isolate production
traffic from staging.
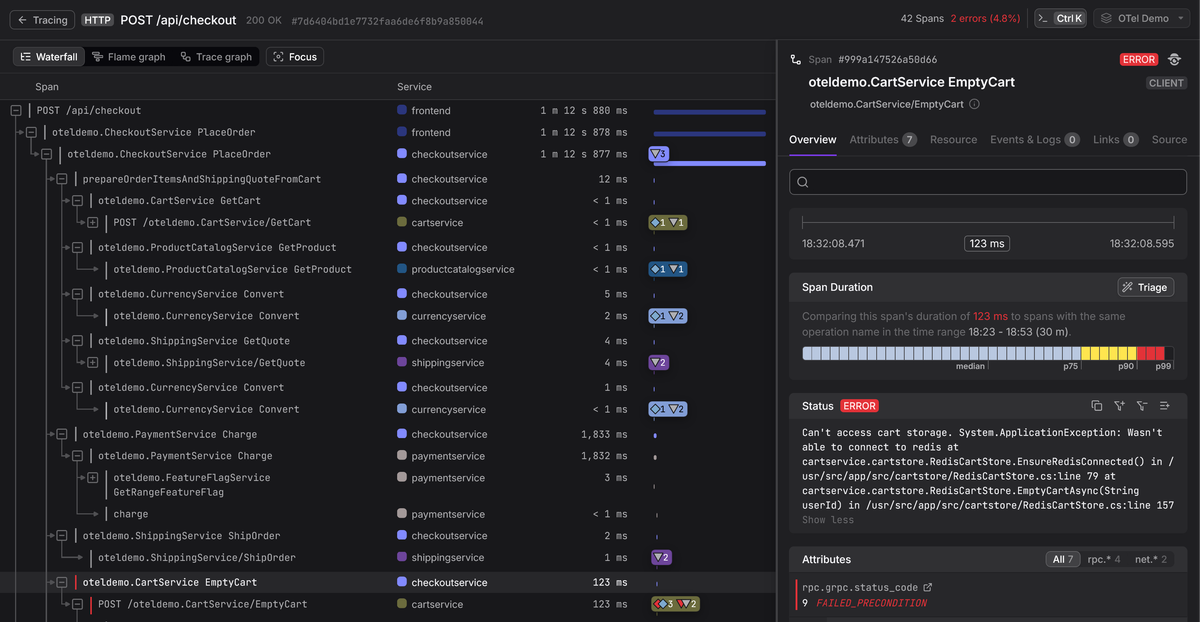
Once you find a relevant trace, the tree view shows you the hierarchy of spans.
You can immediately see which branch of the tree consumed the most time,
identify spans marked with ERROR status, and drill into individual spans to
inspect their attributes and events. If the root cause is a slow database query,
you will find it as a child span with a long duration and attributes like
db.query.text that tell you exactly which query was responsible.
At scale, though, manually inspecting individual traces is not always practical. When a service is producing thousands of error spans, you need a way to find the pattern across all of them, not just diagnose one trace at a time. This is where the attributes on your spans compound in value.
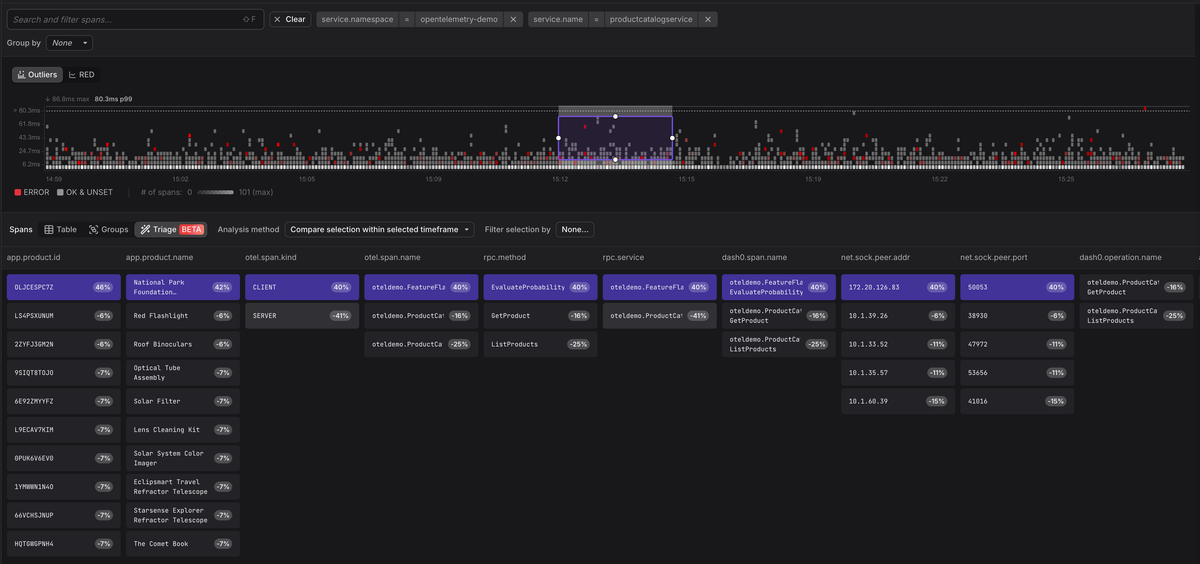
Dash0's
Triage
feature analyzes the attributes across a set of spans to surface the
commonalities and differences between error spans and healthy ones. Instead of
you formulating hypotheses about what might be causing failures, Triage examines
the metadata and tells you, for example, that 100% of the failing spans share a
specific app.product.id value, or that errors are concentrated on a single
deployment version. The richer the attributes you attach to your spans, the more
patterns Triage can find.
This workflow is what makes distributed tracing operationally valuable, and spans are the unit of data that makes it all work. Consistent naming, rich attribute selection, and careful error recording are what directly determine how quickly you can move from "something is wrong" to knowing why.
Final thoughts
Spans are the building blocks of distributed tracing. Getting them right is not about following a long checklist of rules; it's about understanding that every field on a span exists to help someone (possibly you), answer a question about why a request failed or why it was slow.
Start with auto-instrumentation to cover the common operations (HTTP, databases, messaging) and layer in manual spans for the business logic that only you understand. Attach attributes that you would want to filter by when debugging, and record errors with enough context to be self-explanatory.
If you'd like to see how these concepts work in a backend designed around OpenTelemetry from the ground up, start a free Dash0 trial. Dash0 ingests OTLP, preserves the full span data model, and provides the trace navigation and filtering tools that make spans operationally useful.
Thanks for reading!
