Last updated: July 14, 2026
About Logging
The Log Explorer lets you search, filter, and analyze log records across all your services and infrastructure.
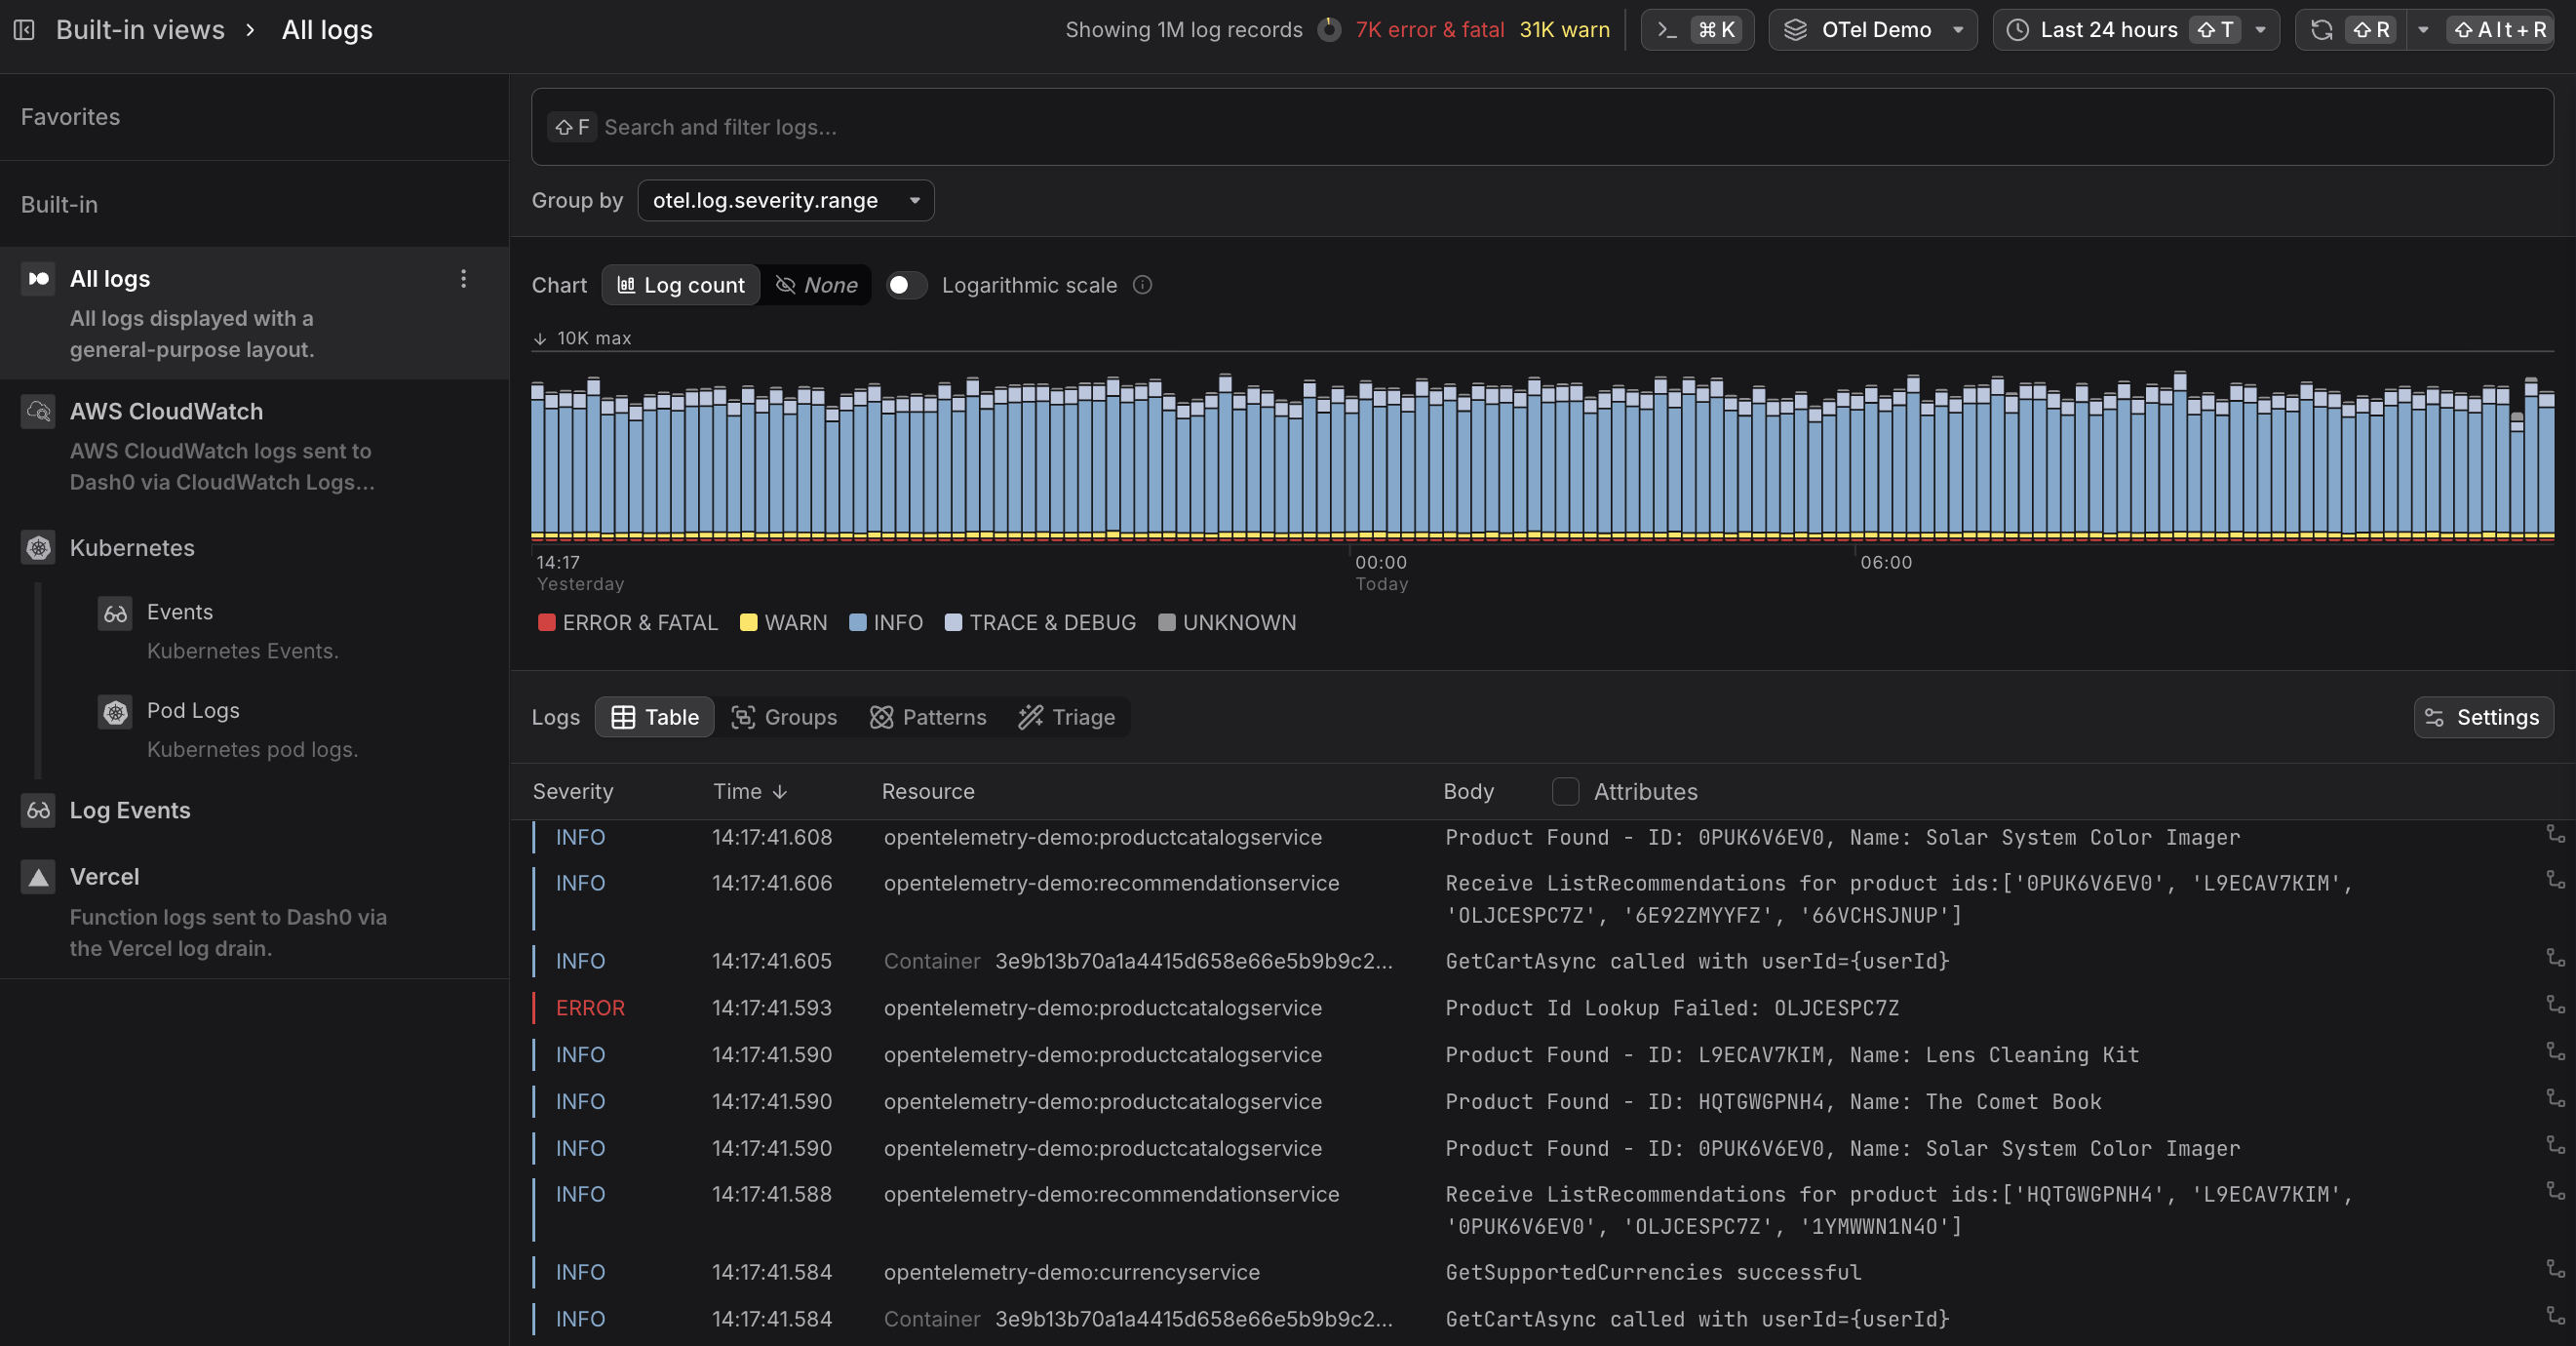
It is organized into the following areas:
Global Controls
- Filter — narrows the log data shown across all views. More here...
- Command Menu — provides quick access to common actions and navigation. More here...
- Time Picker — sets the time range for all views. More here...
- Views Explorer — the vertical navigation panel running along the left of the Log Explorer that organizes saved log views into Favorites, Built-in, and Custom sections, providing quick access to pre-configured and user-defined perspectives on log data. More here...
Log Visualizations
- Severity Chart — a time-bucketed bar chart showing log volume broken down by severity group, making it easy to spot error spikes and warning outliers at a glance. More here...
Log List Modes
- Table — displays log records in reverse chronological order with configurable columns for severity, time, resource, body, and trace context. More here...
- Groups — aggregates log records by a selected attribute (e.g.
resource.service.name) and displays per-group counts broken down by severity in a sortable table. Each row is drillable, allowing you to navigate into the records for that group. More here... - Patterns — automatically clusters log records with similar message bodies into templates, replacing variable parts such as IDs and timestamps with placeholders to surface recurring message structures. More here...
- Triage — performs automated comparative analysis to identify attributes that differentiate erroneous or anomalous logs from a baseline, supporting comparisons by severity group or across time windows. More here...
Log Detail Panel
- Log Sidebar — a context-sensitive detail panel that opens when a log record is selected, surfacing the message body, log attributes, span context, resource metadata, and raw OpenTelemetry payload data across dedicated tabs. More here...
From Logs to Dashboards, Check Rules, and Agent0
Once you have the view you want, use the buttons at the top of the Log Explorer, for the following.
![]()
- Click Add to dashboard to add the current query as a panel to a new or existing dashboard.
- Click Create check rule to open the check rule editor with this query pre-filled as the rule expression.
- Click Analyze with Agent0 to analyze the logs, within the selected time range, with Agent0.
Control Costs with Spam Filters
Log data can generate significant telemetry volume, especially for verbose applications or high-traffic services. Use spam filters to drop low-value log records at ingestion time and reduce storage costs.
For full context on cost control including spam filters, monthly budgets, and cost forecasting, see About Billing & Cost Control.
Common use cases for spam filtering logs include:
- Debug logs in production — filter out verbose debug-level logs that were accidentally left enabled in production environments.
- Health check logs — drop log records generated by monitoring endpoints that create high volume but provide little diagnostic value.
- Noisy third-party libraries — exclude repetitive log messages from chatty dependencies that don't require monitoring.
- Development environments — filter out logs from non-production services to focus your observability budget on production traffic.
To create a spam filter for logs:
- Navigate to the Log Explorer and define filter criteria that match the log records you want to exclude (e.g.,
severity = DEBUGorbody contains "health check"). - Click the Spam button in the toolbar.
- Review the filter definition and click Flag as spam to activate it.
Once active, matching log records will be dropped at ingestion and will not count toward your storage costs or dataset quotas.
Data dropped by spam filters cannot be recovered. Test your filter criteria carefully before activating a spam filter, especially in production datasets.
Further Reading
-
How Log AI Processes Logs. Explains how Dash0 automatically infers severity levels and extracts named attributes from unstructured log messages using AI, and how to use the resulting patterns and attributes in queries, filters, and check rules.
-
How Dash0 Processes JSON Logs. Describes how Dash0 parses structured JSON log records at ingestion time, including how fields are mapped to log body, severity, timestamps, trace context, and framework-specific conventions such as Pino, journald, and Java MDC.
-
How Dash0 Processes NGINX Logs. Details the NGINX log formats Dash0 recognizes automatically and how their fields are mapped to OpenTelemetry semantic attributes, including HTTP request and response data, performance metrics, and upstream server information.
-
Understand Log Events. Explains what log events are, how they differ from regular log records, how to send them, and how to use them in Dash0, including Kubernetes events and dashboard annotations.
-
Send Vercel Logs to Dash0. Covers forwarding logs from Vercel projects to Dash0 via the Dash0 Vercel integration or by configuring Vercel log drains manually.
-
Send Pino Logs to Dash0. Covers best practices for getting the most out of Pino, a popular Node.js logger, including log level modeling and exporting logs via Pino's OpenTelemetry transport.