Last updated: July 27, 2026
Inspect Log Details
Dash0 provides quick access to relevant information based on context.
The Log Sidebar on the right-hand side opens when a record in the Log Table is selected
Overview Tab
The Overview tab is active by default and contains the most relevant information for quick access and navigation.
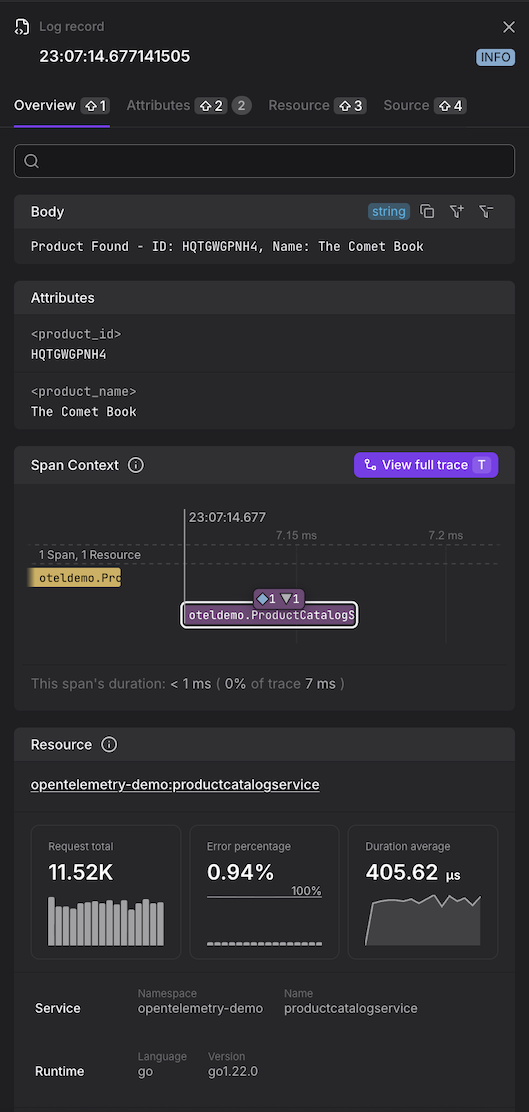
- Body — the log message content.
- Log Attributes — a subset of key attributes. For the full list, open the Attributes tab.
- Span Context — the relevant part of the distributed trace, showing the span (highlighted) in which the log record was created. The trace is limited to the span before and after the highlighted span. Summaries indicate how many spans from how many resources are not shown in the overview. For more on how distributed traces are structured and how log records connect to them, see About Tracing.
- Resource — a summary of the resource that emitted the log. For the full attribute list, open the Resource tab.
- RED Metrics — Request, Error, and Duration metrics for the resource.
- Attributes — the full list of log attributes.
Source Tab
The Source tab contains the raw data of the log record, including all fields and attributes.
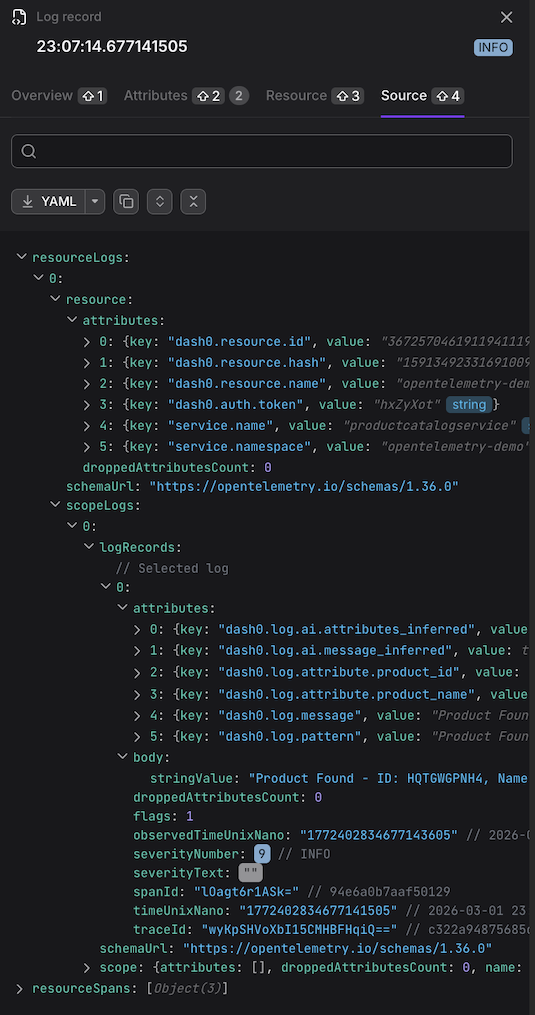
The Source tab shows the log record as OTLP JSON. This is how Dash0 represents the log internally — it does not mean the log was received via OTLP or that it was originally encoded as JSON.
Troubleshooting Missing Span Context
If the Span Context section is empty for a log record that you expect to be part of a trace, the most likely cause is that the trace context was attached to the log using attribute names that Dash0 does not recognize.
How Span Context Should Be Set
Dash0 extracts trace and span IDs from log records in the following ways, evaluated in order:
-
OTLP standard fields. When logs are sent over OTLP,
TraceIdandSpanIdare first-class fields on the log record, not attributes. This is the correct approach when using an OpenTelemetry SDK or collector pipeline and requires no additional configuration. -
Recognised attribute aliases. When logs arrive through other paths — for example, as JSON forwarded via a log drain — Dash0 looks for trace and span IDs in log record attributes. The full list of recognized attribute names is in the JSON log processing reference. These include common conventions such as
trace_id,traceId,TraceId,span_id,spanId, andSpanId, as well as framework-specific names.
Common Mistakes
The most frequent cause of missing span context is an attribute name that looks correct but does not match any recognized alias. Examples encountered in real instrumentation:
- Using
SpanIdorTraceId(mixed case) as custom attributes when sending non-OTLP logs — these are now recognized, but older instrumentation may use variants that are not. - Placing span and trace IDs under bespoke attribute names that differ from the OpenTelemetry conventions and are not in the recognized alias list.
To diagnose this, open the Source tab for a log record that should have span context and look for the raw attribute names your instrumentation is using. Then check them against the supported alias list.
If your instrumentation uses an attribute name that is not currently recognized, contact support to have it added to the alias list.