Last updated: July 27, 2026
Understand Log Events
In OpenTelemetry, a log event is a log record that has the event_name OTLP field set or carries, as fallback, the otel.event.name attribute.
Notable Types of Log Events in Dash0
- Service Events: Log events that also carry a
service.nameattribute, together with, optionally, aservice.namespaceattribute. These can overlap with Kubernetes Events and other log events. - Kubernetes Events: The Dash0 Operator for Kubernetes (v0.92.1+) automatically collects Kubernetes events from monitored namespaces and ingests them as log events.
Sending Events
Any structured log record with an otel.event.name attribute is a log event
Via a Structured Logger
To emit a log event through a structured logger that you're already using, include otel.event.name as a field in the log record. An OTel log bridge will carry it through as an attribute, and Dash0 will recognize the record as a log event.
Using Pino with pino-opentelemetry-transport, as an example:
123456789101112import pino from 'pino';const logger = pino({transport: {target: 'pino-opentelemetry-transport',},});logger.info({'otel.event.name': 'user.login','user.id': '42',}, 'User logged in');
Via the OpenTelemetry Collector
Dash0 provides enhanced support for Kubernetes events collected via the k8seventsreceiver component of the OpenTelemetry Collector.
These events are automatically transformed upon ingestion to match via resource centricity with the rest of Kubernetes resources.
Kubernetes Events can be accessed via a specialised events view and are automatically collected by the Dash0 Operator v0.92.0 and above.
Users of the OpenTelemetry Operator and otel-collector-contrib can enable Kubernetes event collection with the following snippet:
12receivers:k8s_events:
The kubernetesEvents preset of the OpenTelemetry Operator unfortunately enables a different receiver component than k8seventsreceiver, which is NOT supported for automatic event enhancement in Dash0 and will result in the transmission of regular log records instead of log events.
Via the Dash0 CLI and GitHub Action
You can also create log events directly from the Dash0 CLI or via the send-log-event GitHub action based on the CLI.
Work with Log Events
Log events in Dash0 are queryable, alertable, and visualizable using the same tools available for any log record. You can explore them in the dedicated Events View, build check rules to alert on event patterns, and overlay them as dashboard annotations to correlate spikes or anomalies with specific occurrences like deployments or restarts.
Query Events
In Dash0, events can be accessed like any other log record, and there is a specialised Events View.
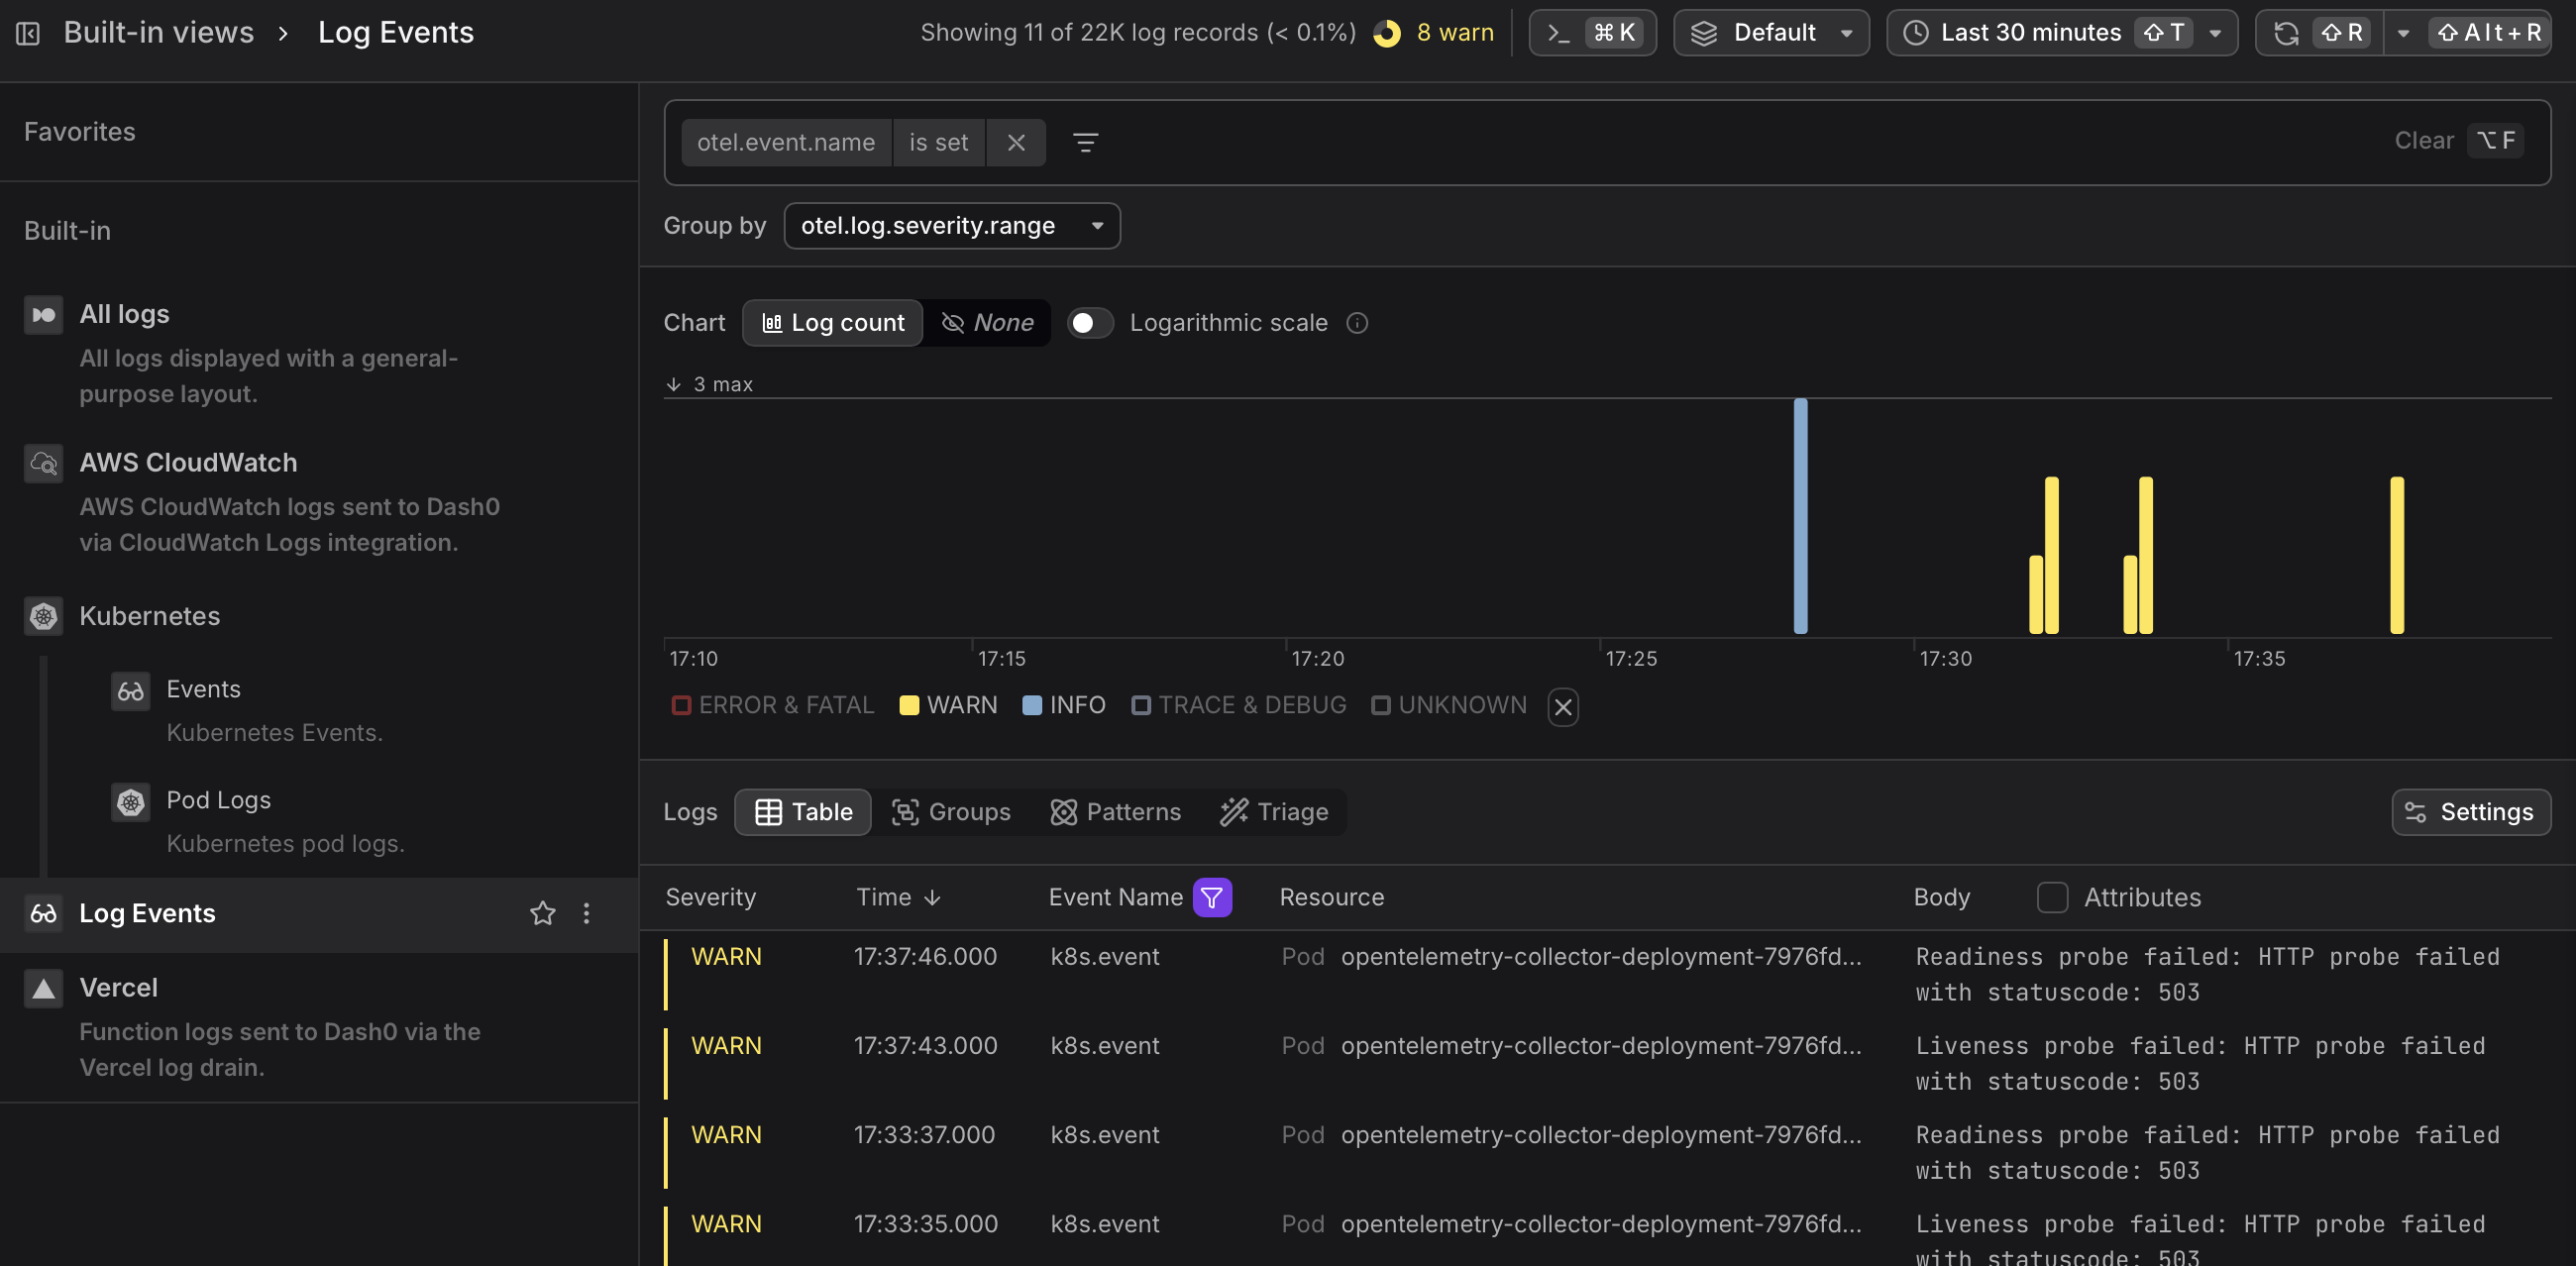
Log events are a special form of log record. All analysis methods that work on logs in Dash0 also work for log events.
Create Check Rules based on Log Events
Since log events are a special form of log record, check rules on log events can be created using the same flow as for any other log record.
The fastest way to create a check rule from the Events view is to click Create check rule above the Severity Chart. This opens the check rule editor with the current event query pre-filled as the rule expression, letting you set up alerting on event patterns — such as spikes of a specific event type — without building the query from scratch.
See the Create Check Rules Manually documentation for full details.
Add Log Events as Dashboard Annotations
Annotations overlay log events onto the timelines of dashboard chart panels, visually correlating metric spikes or anomalies with specific events such as a deployment or a container restart.
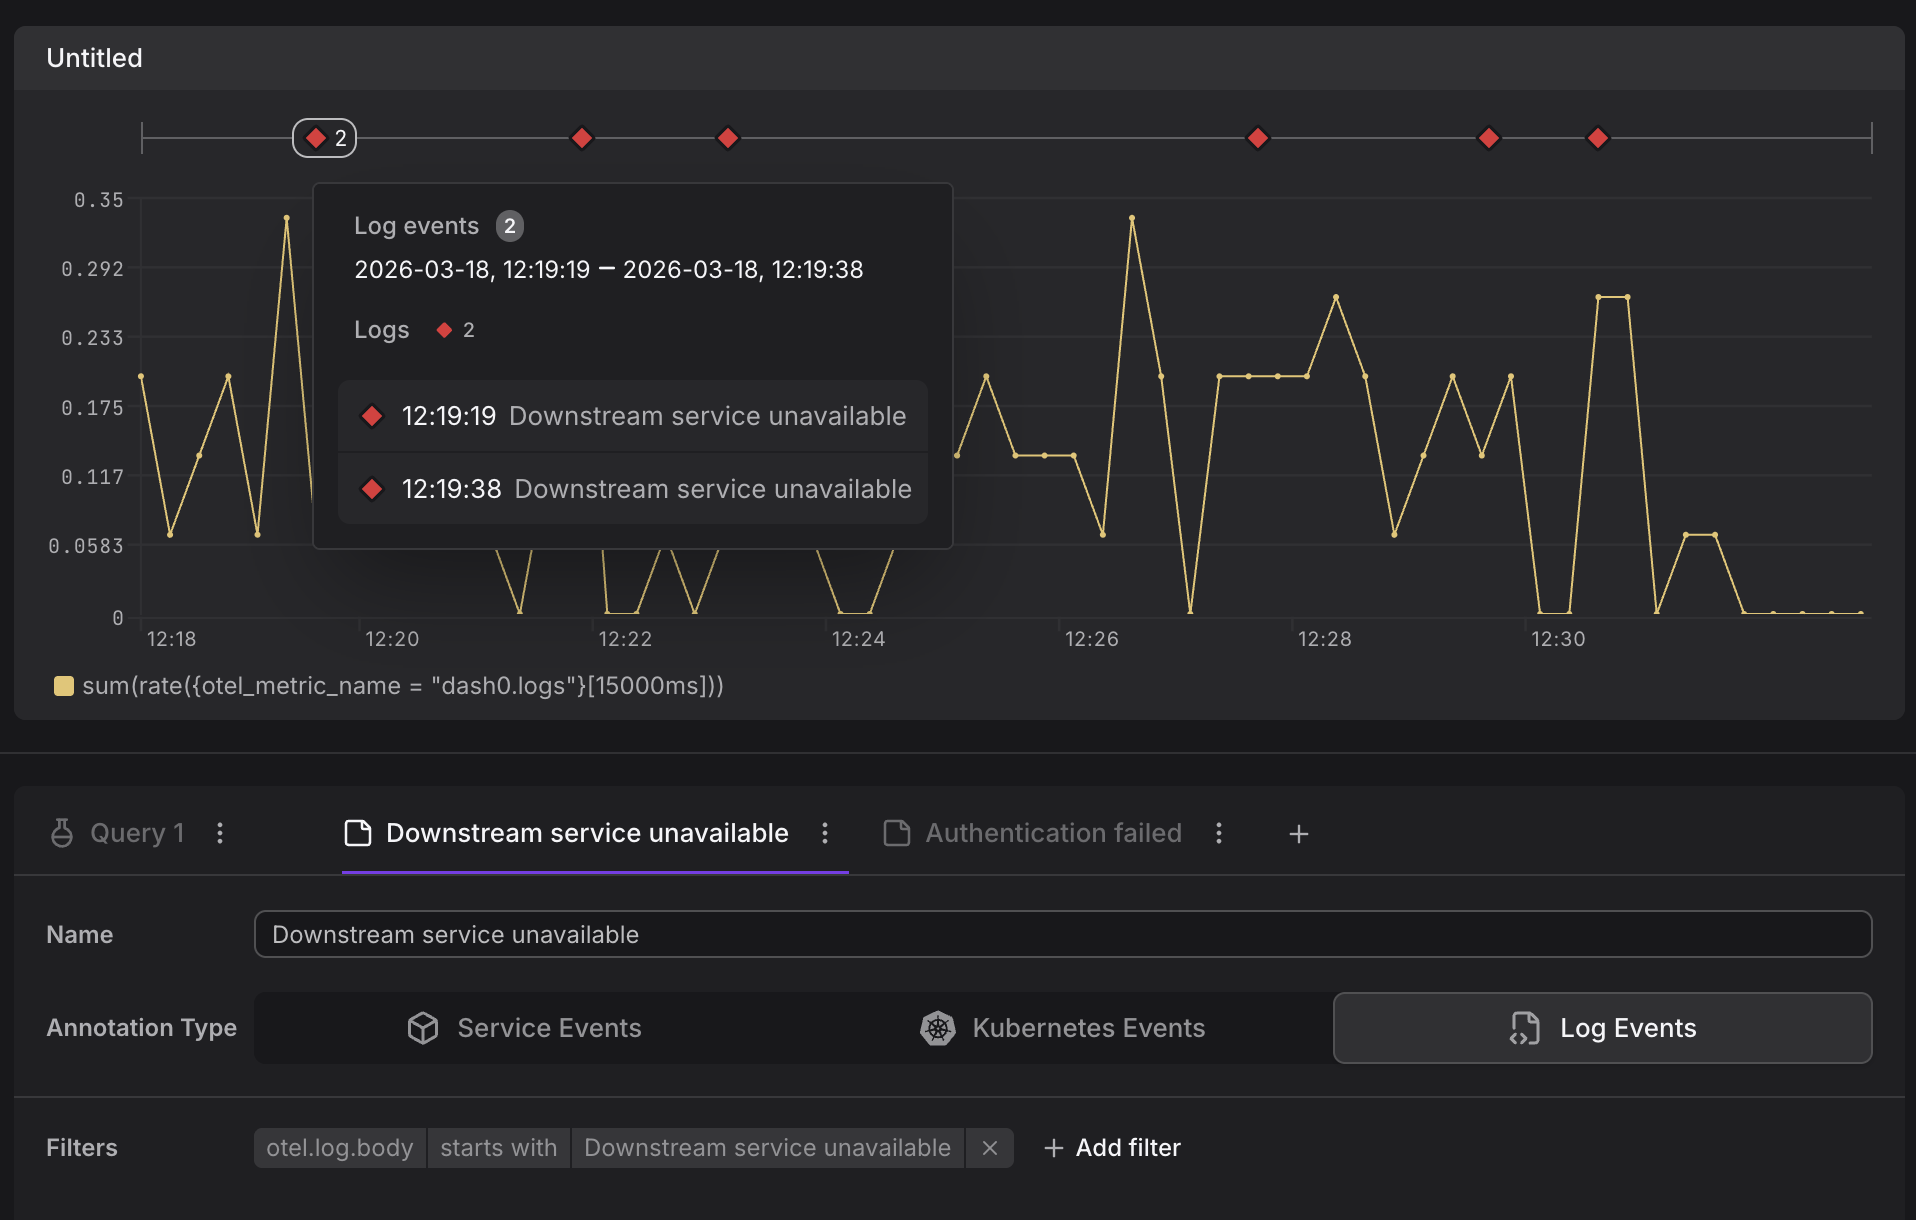
See the Add Annotations documentation for more information on how to use log events as annotations.