Last updated: July 27, 2026
Identify Patterns in Logs
Patterns mode automatically clusters log records with similar message bodies into groups, replacing variable parts such as IDs, IP addresses, and timestamps with placeholders.
This reduces thousands of individual log lines into a small number of meaningful templates, making it much faster to understand what your system is doing.
- Use Groups when you already know the attribute you want to aggregate by, such as service name or HTTP status code. More here...
- Use Patterns when you want to discover what kinds of messages are being logged, without knowing in advance which attributes are relevant.
Understand the Patterns Table
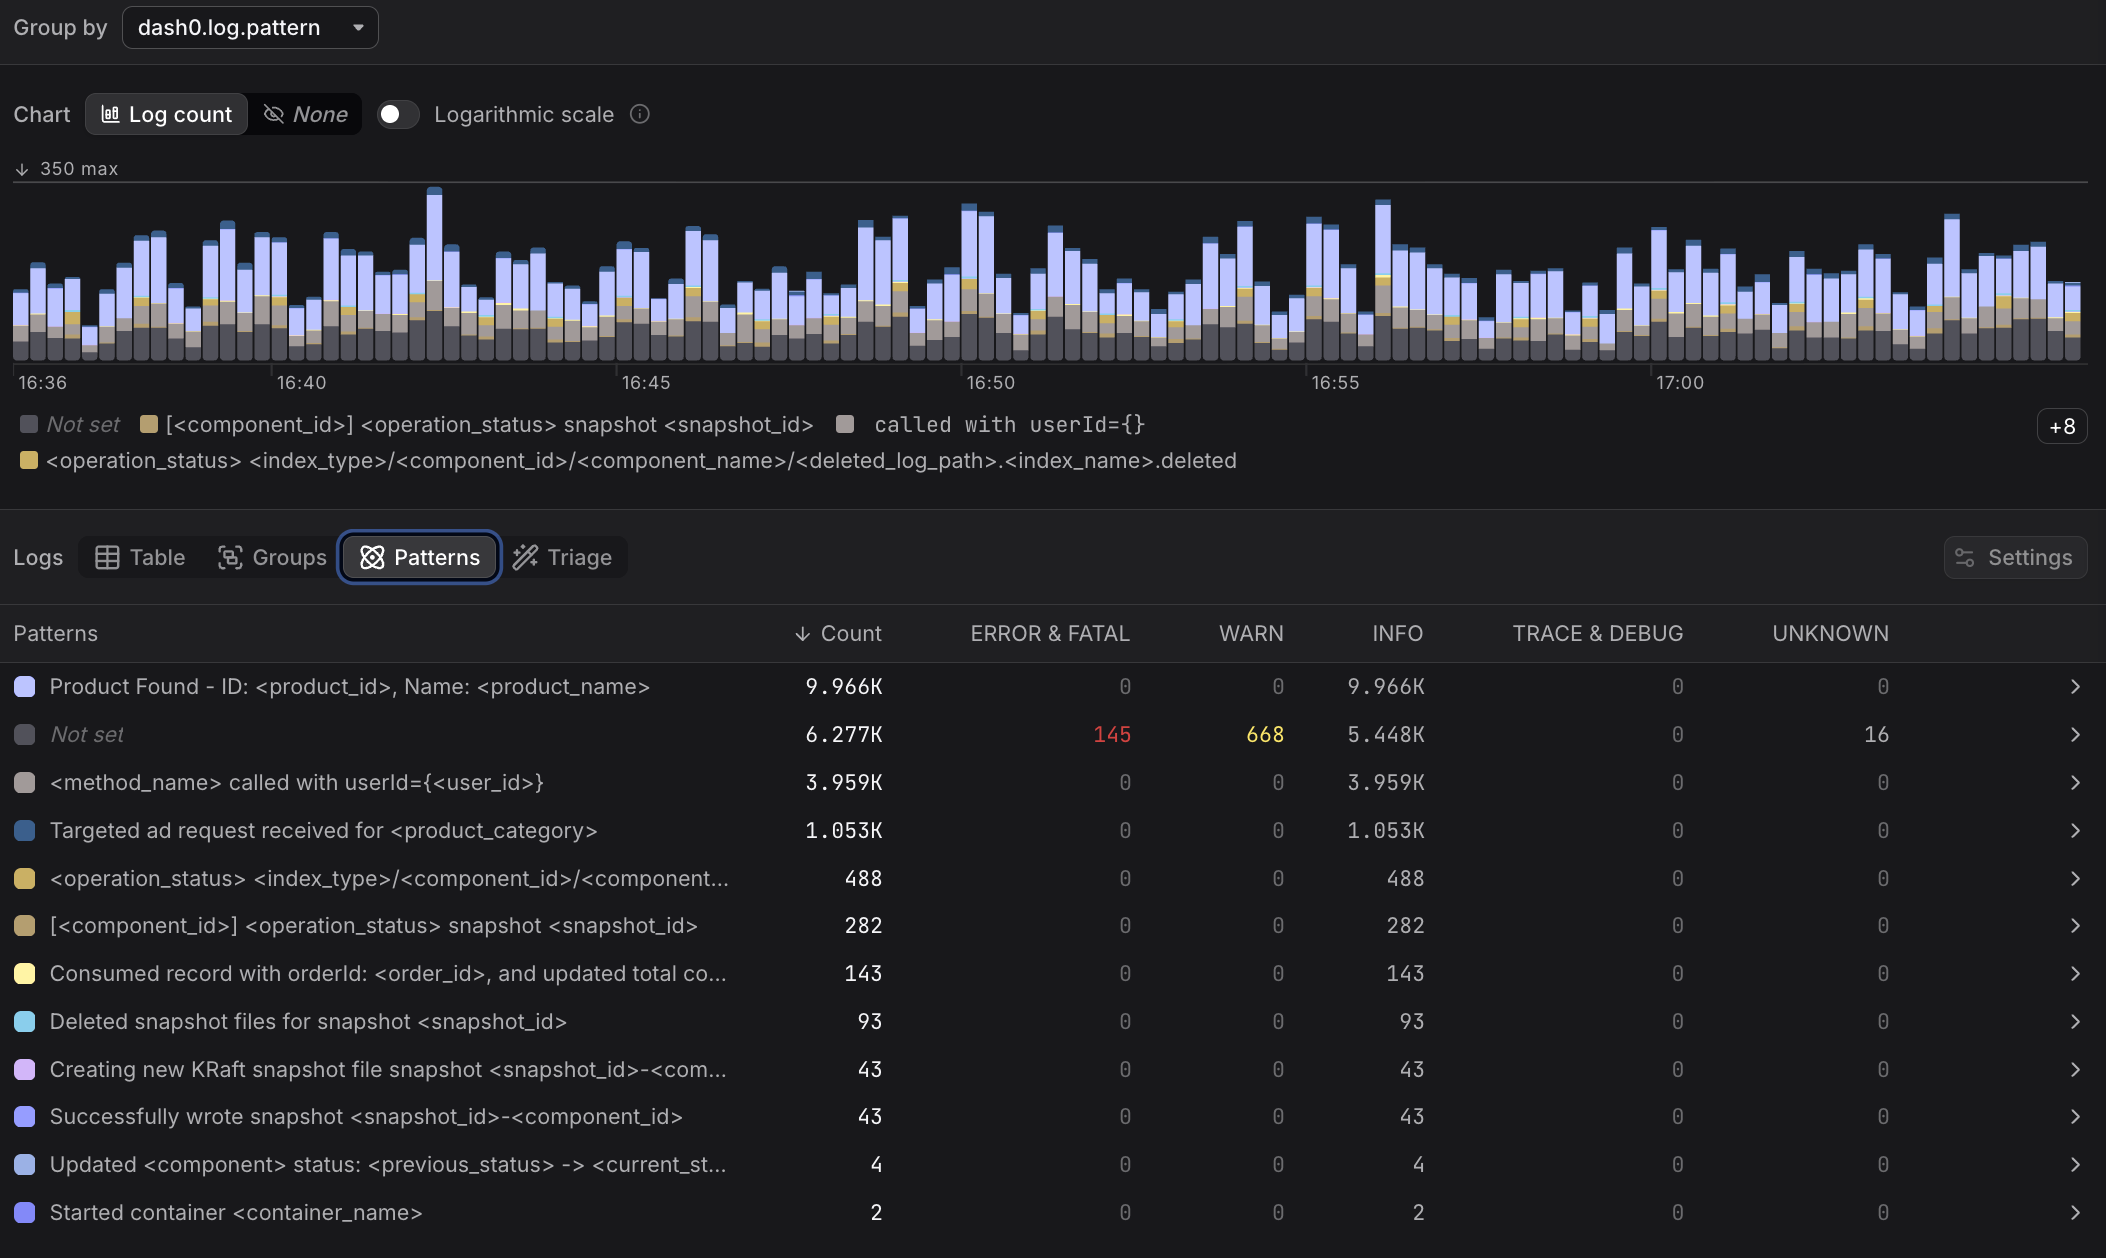
Each row represents a distinct pattern, which is a cluster of log records with similar message bodies.
Variable parts of the message body are replaced with a placeholder, while the fixed parts are preserved.
For each pattern, the table shows the total record count, the severity distribution within the pattern, and the timestamp of the most recent matching record.
Patterns with a high proportion of ERROR & FATAL records are a good starting point for investigation.
Click any row to filter the Table view to records matching that pattern. From there you can inspect individual records, examine attributes, and follow trace links.