Last updated: July 27, 2026
Analyze Logs in Groups
Aggregate log records by attributes to view distribution across services, hosts, and dimensions.
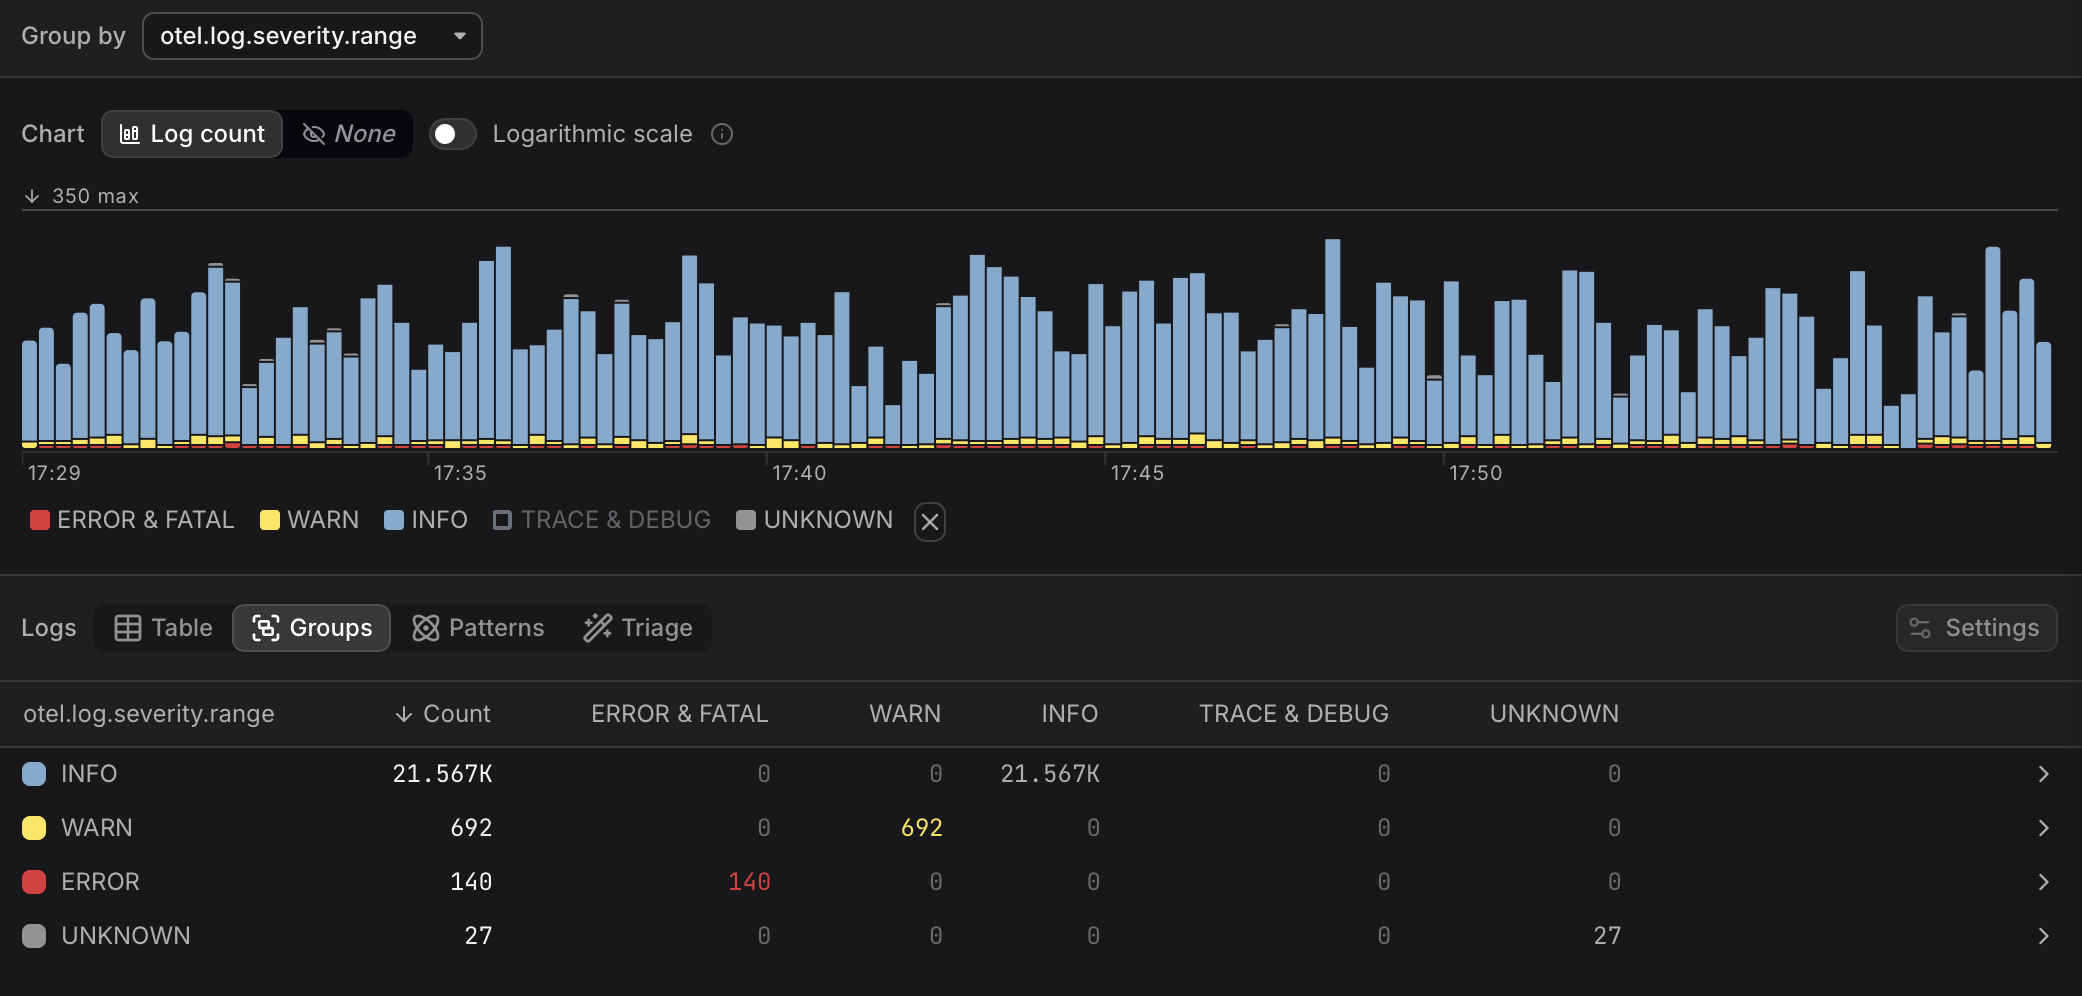
Groups mode aggregates log records by a chosen attribute and shows the distribution across services, hosts, status codes, or any other dimension.
Tip
- The Groups table is useful for quickly identifying which resource or component is responsible for the highest error volume or the most log activity.
- Each row in the Groups table represents a unique value of the Group by attribute. Rows are sorted by log count descending by default.
- Click any row in the Groups table to filter to records from that group only.
Choose a Group By Attribute
Click the Group by dropdown above the chart to select the attribute to aggregate by. The Severity Chart and the Groups table both update immediately.
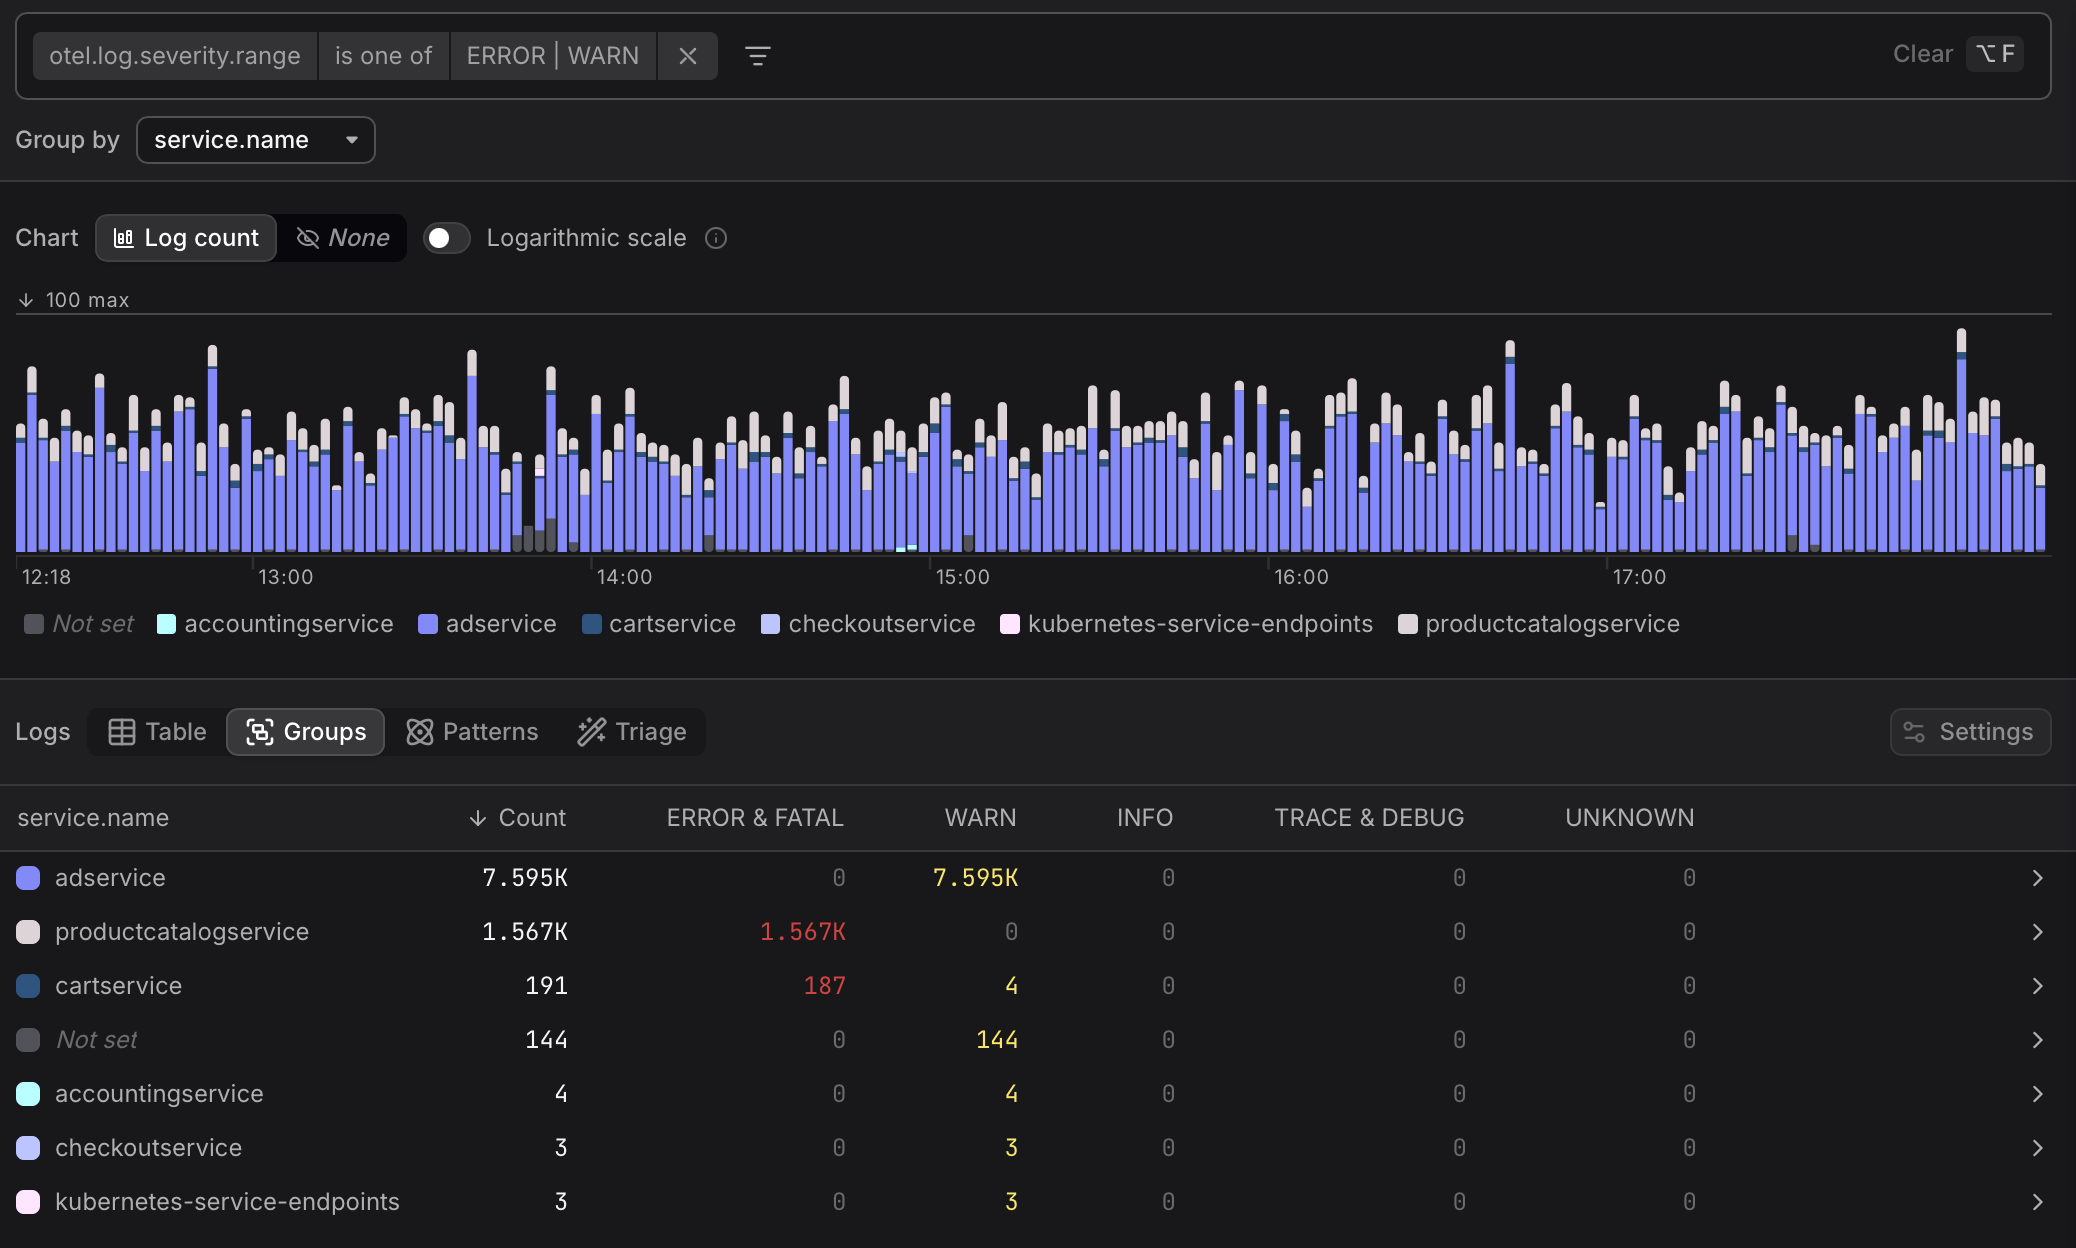
The Groups table respects all active filters in the filter bar. For example, as can be seen above, you can filter to otel.log.severity.range is one of ERROR | WARN first, then group by service.name to see which services are producing the most errors in the current time window.
Tip
- Use Groups when you already know the attribute you want to aggregate by, such as service name or HTTP status code.
- Use Patterns when you want to discover what kinds of messages are being logged, without knowing in advance which attributes are relevant. More here...