Last updated: June 19, 2026
Explore Related Logs
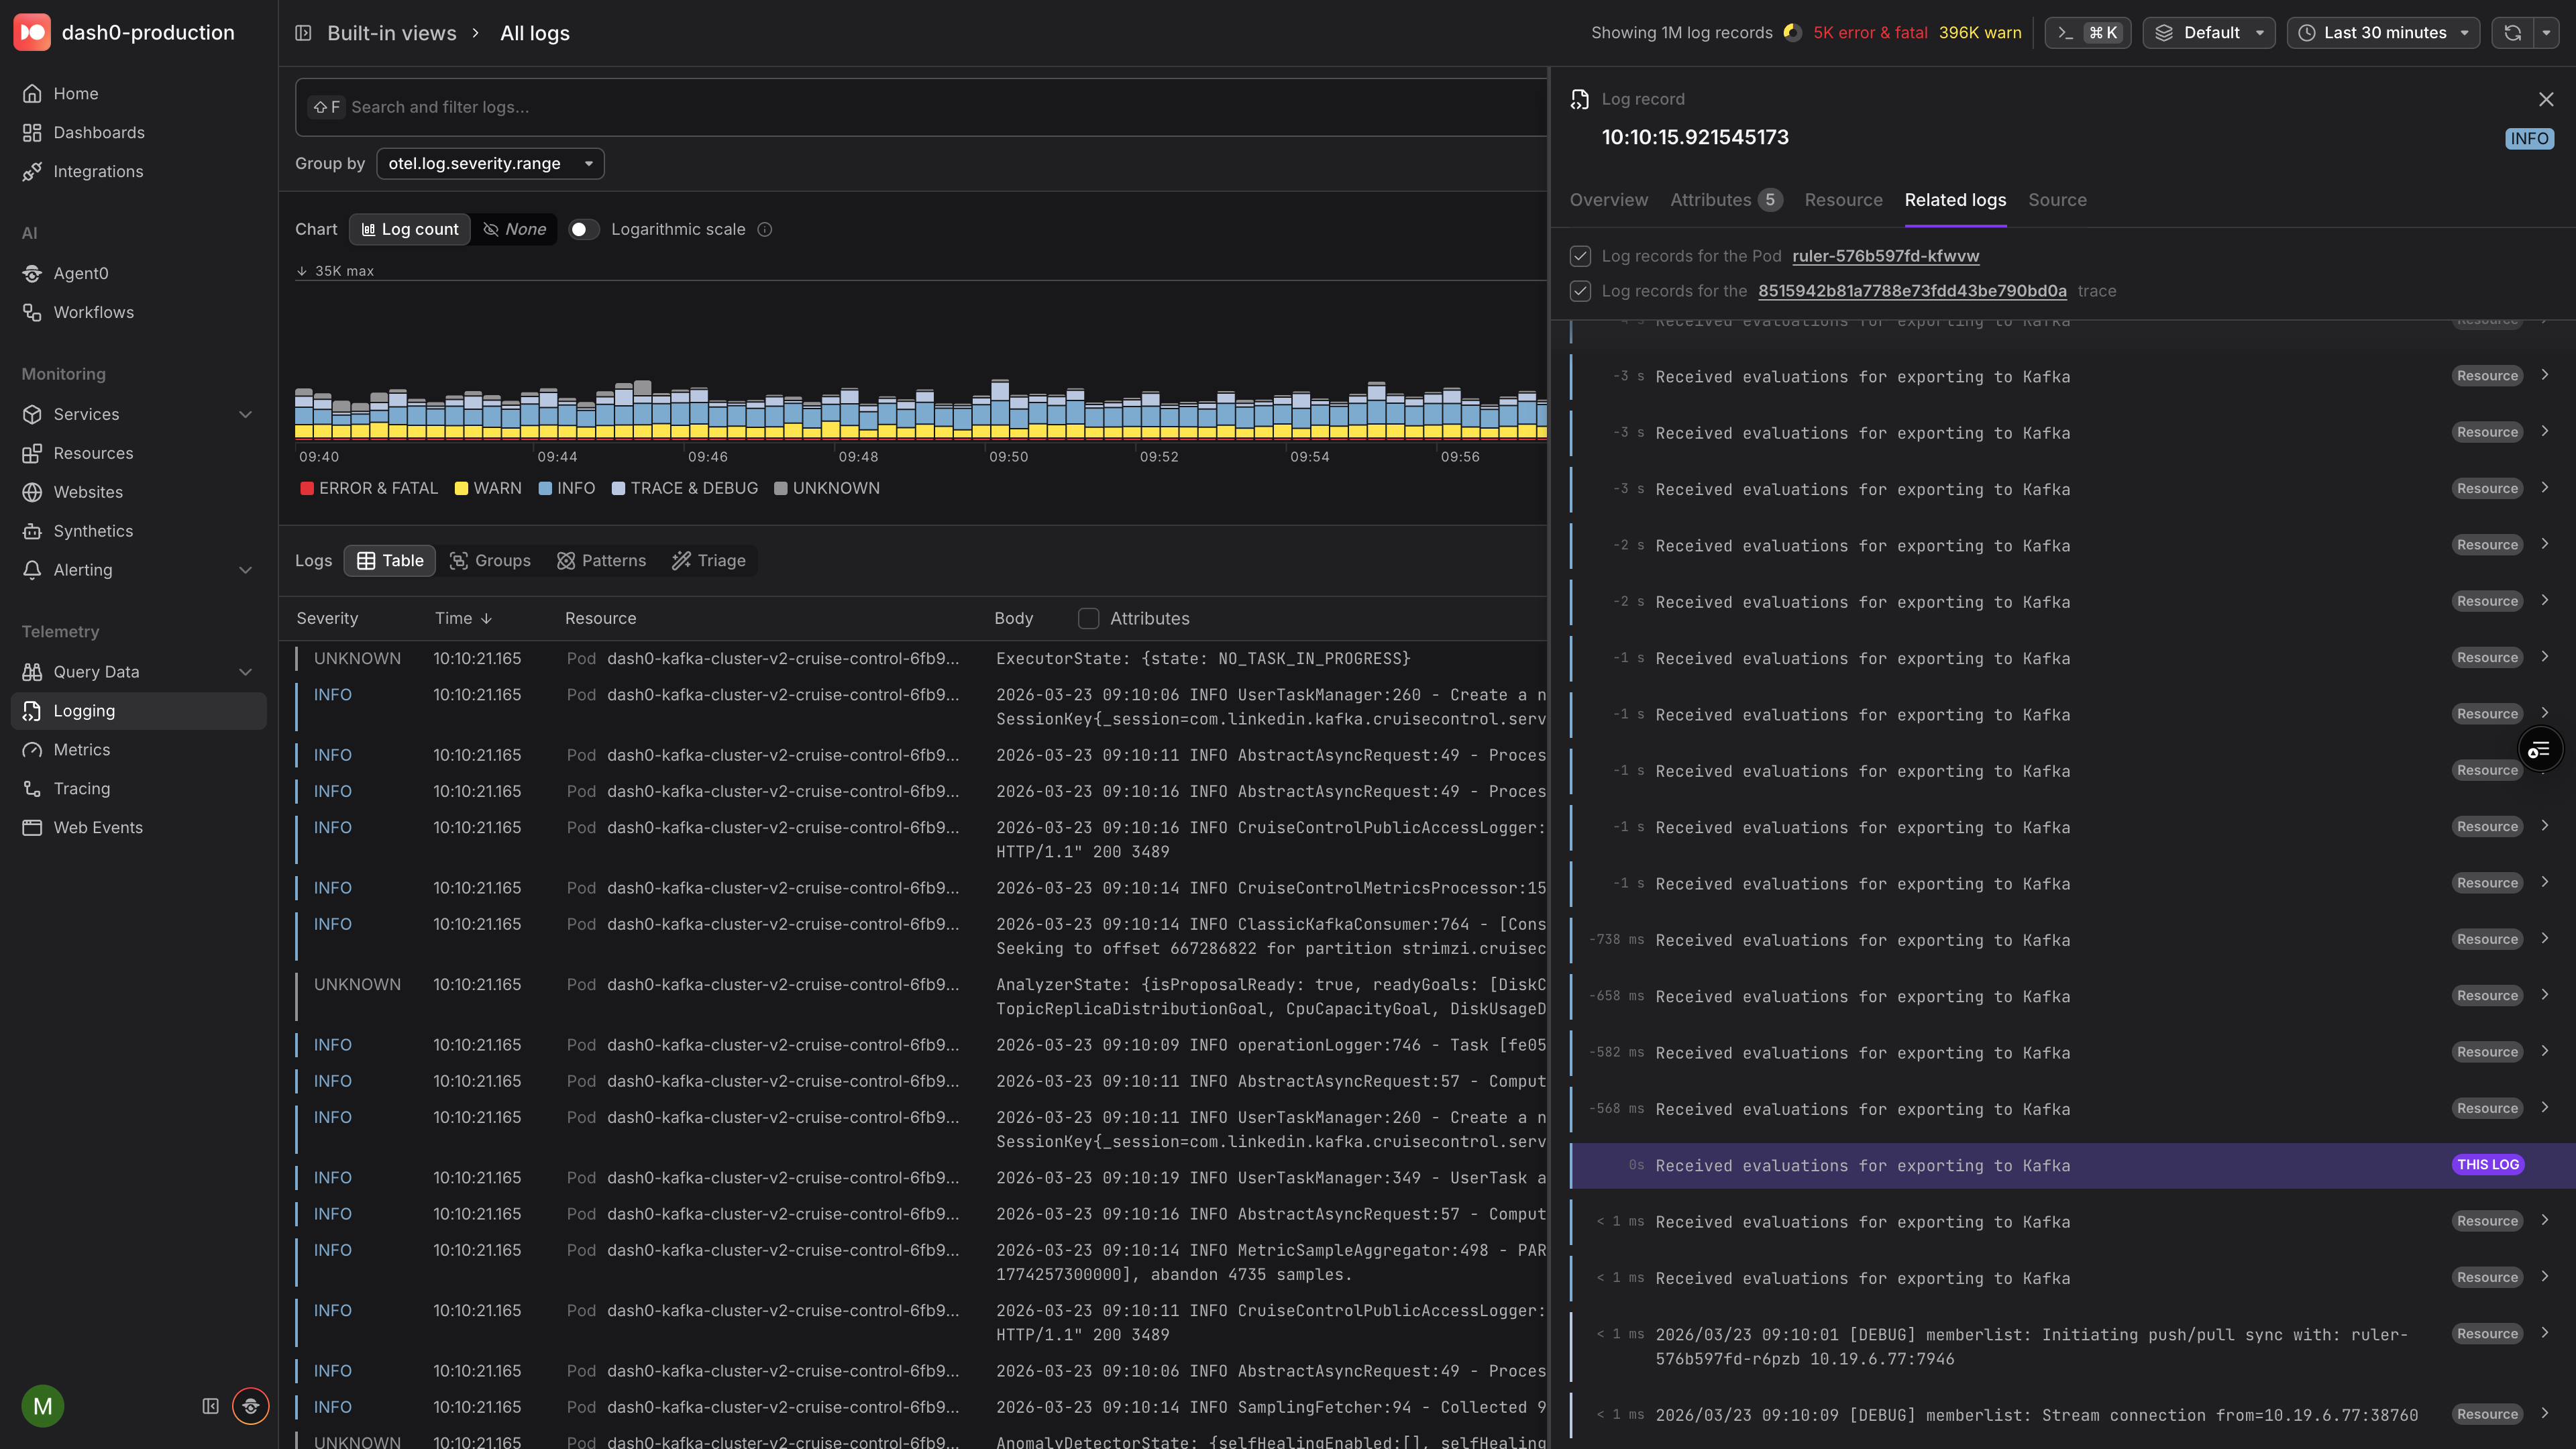
The Related Logs tab in the Log Sidebar displays log records from the same resource and trace, organized chronologically around the record you are inspecting. This lets you reconstruct the sequence of events surrounding a log without manually adjusting time ranges or filters.
Open the Related Logs Tab
- Select a log record in the Log Table to open the Log Sidebar.
- Switch to the Related Logs tab.
Dash0 automatically queries a ±30‑minute window centered on the selected log and displays the results in a scrollable timeline.
- The active log is pinned in the center, highlighted and marked with a THIS LOG badge.
- Older logs appear above and newer logs below, each annotated with a relative time offset (for example,
−2m 15sor+50s). - Infinite scroll loads additional records in both directions as you explore.
Correlation Modes
Related Logs supports two independent correlation modes. When both are available, toggle each on or off with a checkbox to narrow or widen the results.
| Mode | What it shows |
|---|---|
| Resource | All logs emitted by the same service or infrastructure component. Gives you a local timeline of everything that resource was doing around the time of the selected log. |
| Trace | All logs sharing the same trace ID. Lets you follow a single request across service boundaries, seeing every log record produced during that distributed transaction. |
When both modes are enabled, the view shows the union of both result sets. Correlation badges on each log entry indicate whether it was included because of a resource match, a trace match, or both.
At least one correlation mode must always be selected. If only one mode is available for the selected log — for example, because the log has no trace context — that mode is enabled automatically and cannot be toggled off.
Navigate Between Related Logs
Click any related log in the timeline to make it the new active record. The sidebar updates, the timeline re‑centers, and you can continue exploring from there.
Each entry in the timeline also provides quick links:
- Resource link — navigate to the resource that emitted the log.
- Trace link — open the full trace view for the associated distributed trace.
- Drill-down chevron — jump to the selected log in the Log Table.
Related Logs works independently of the page-level time range. Even if the page is set to a narrow window, the Related Logs tab always searches ±30 minutes around the active log to provide sufficient context.