Last updated: July 14, 2026
About Dashboards
A Dash0 dashboard is a unified view that consolidates observability signals—logs, metrics, traces, resources, and web events—into a single, customizable canvas.
Dashboards allow teams to monitor system health, investigate incidents, and share operational context across the organization.
Dash0 dashboards are built on the Perses open standard. Perses is a vendor-neutral dashboard specification designed to prevent lock-in, making it straightforward to import, export, and migrate dashboards between compatible systems.
Understand Key Concepts
- Dashboard: A canvas containing one or more panels, each displaying a specific query result or visualization.
- Panel: An individual visualization widget (chart, stat, table, or Markdown) placed on the dashboard canvas. Panels are analogous to sticky notes that can be freely positioned and resized.
- Query: A data retrieval expression (e.g., PromQL) that feeds data into a panel. Each panel supports one or more independent queries.
- Variable: A dynamic parameter (e.g., service name) that filters data across panels using PromQL label substitution.
- Group: A collapsible container used to organize related panels within a dashboard.
- Annotation: A log-event overlay displayed on a chart's timeline, enabling visual correlation between data spikes and specific events.
AI-Assisted Dashboard Creation
Agent0 can generate complete dashboards from natural language descriptions, automatically creating panels, queries, and visualizations based on your telemetry.
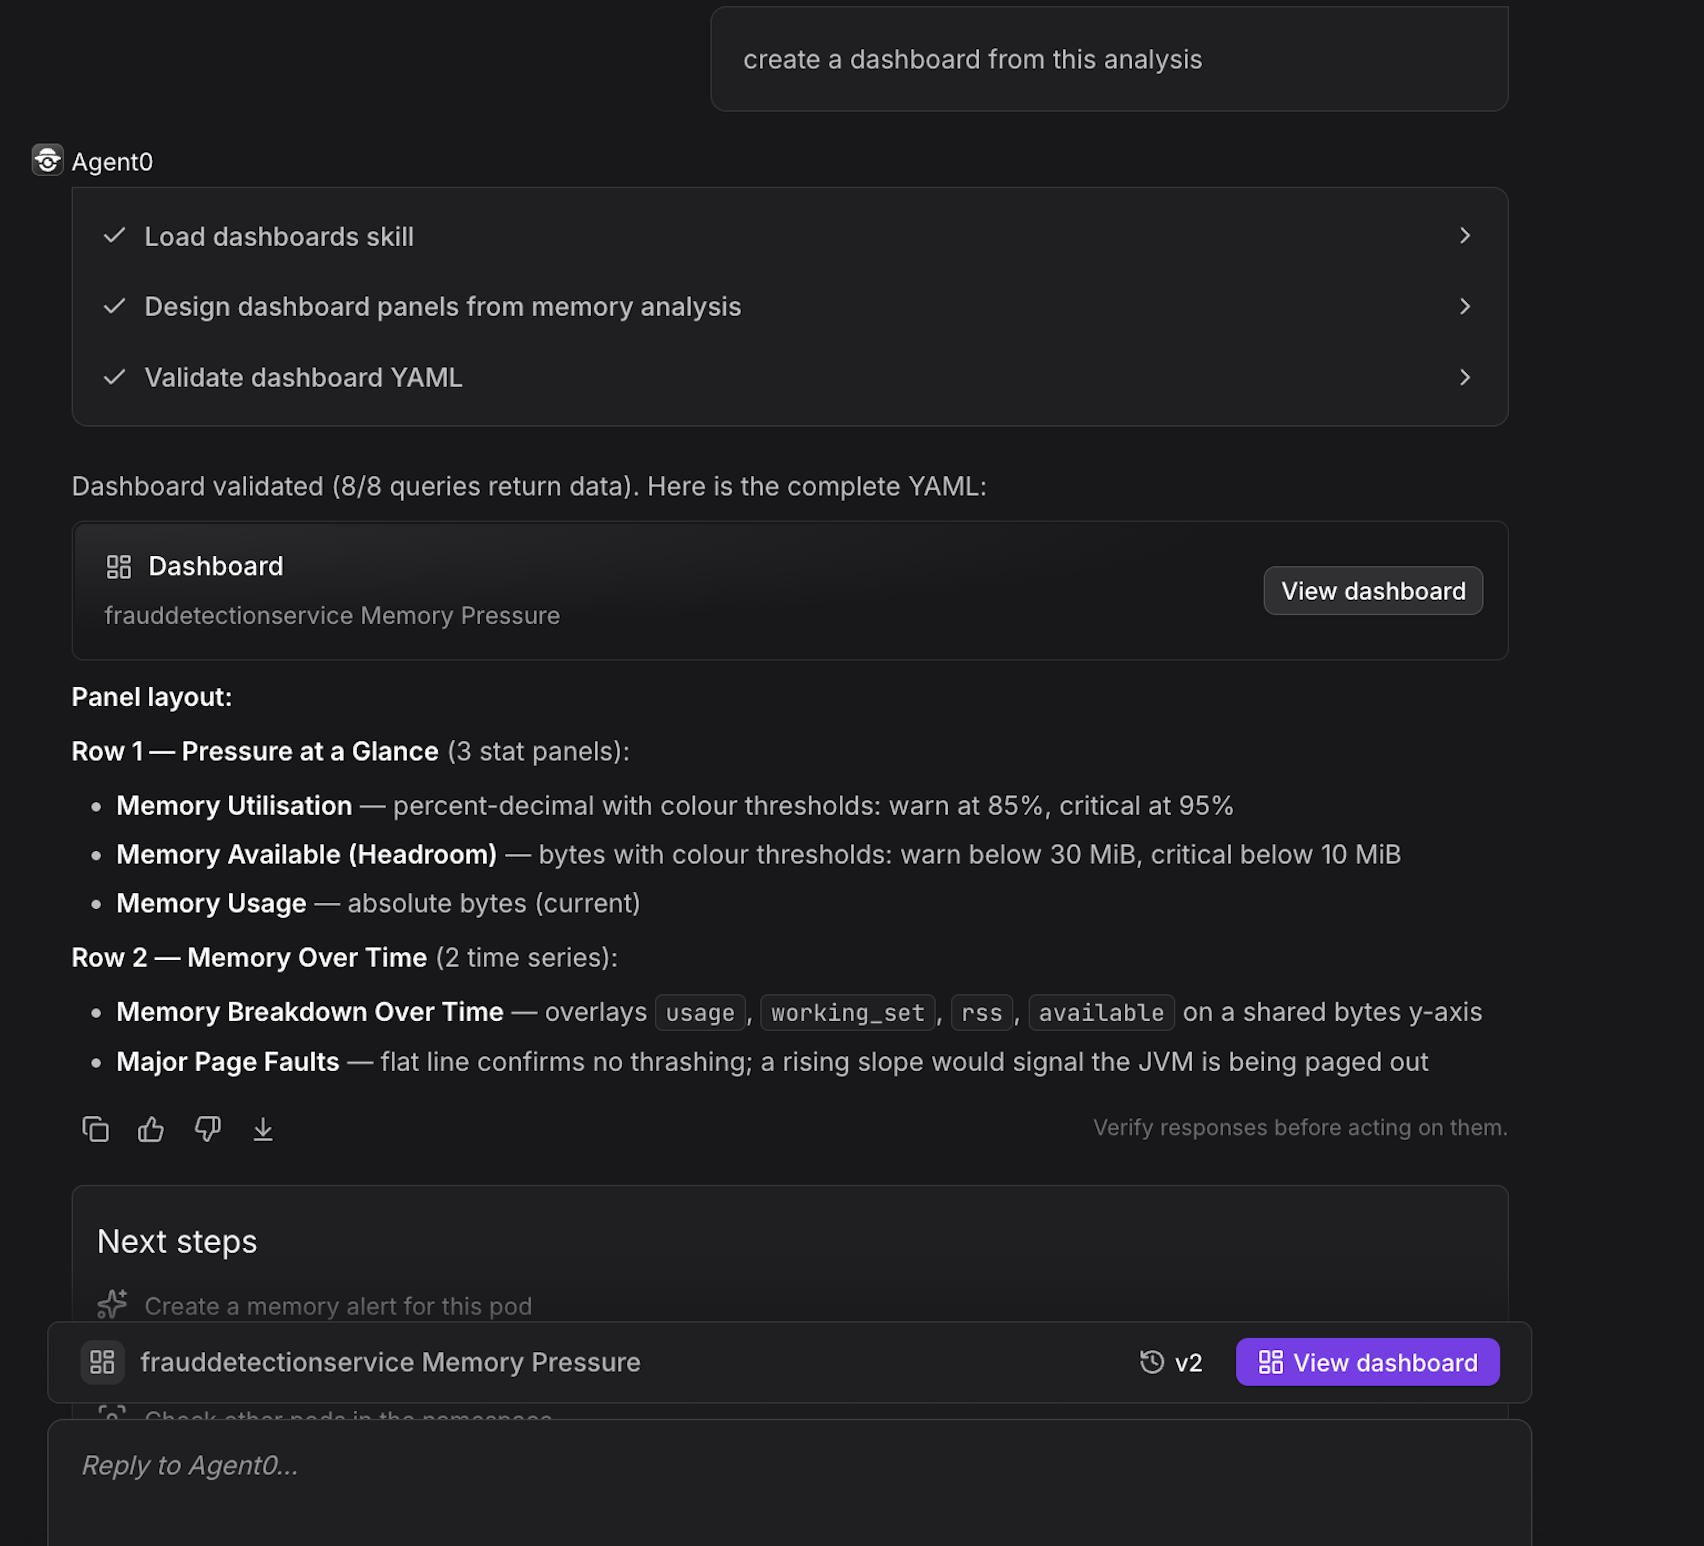
Describe what you want to visualize ("create a dashboard showing RED metrics for the frontend service"), and Agent0 generates the dashboard configuration with appropriate queries and chart types. See Generate Dashboards with Agent0 for details.