Last updated: July 27, 2026
Browse and Filter Logs
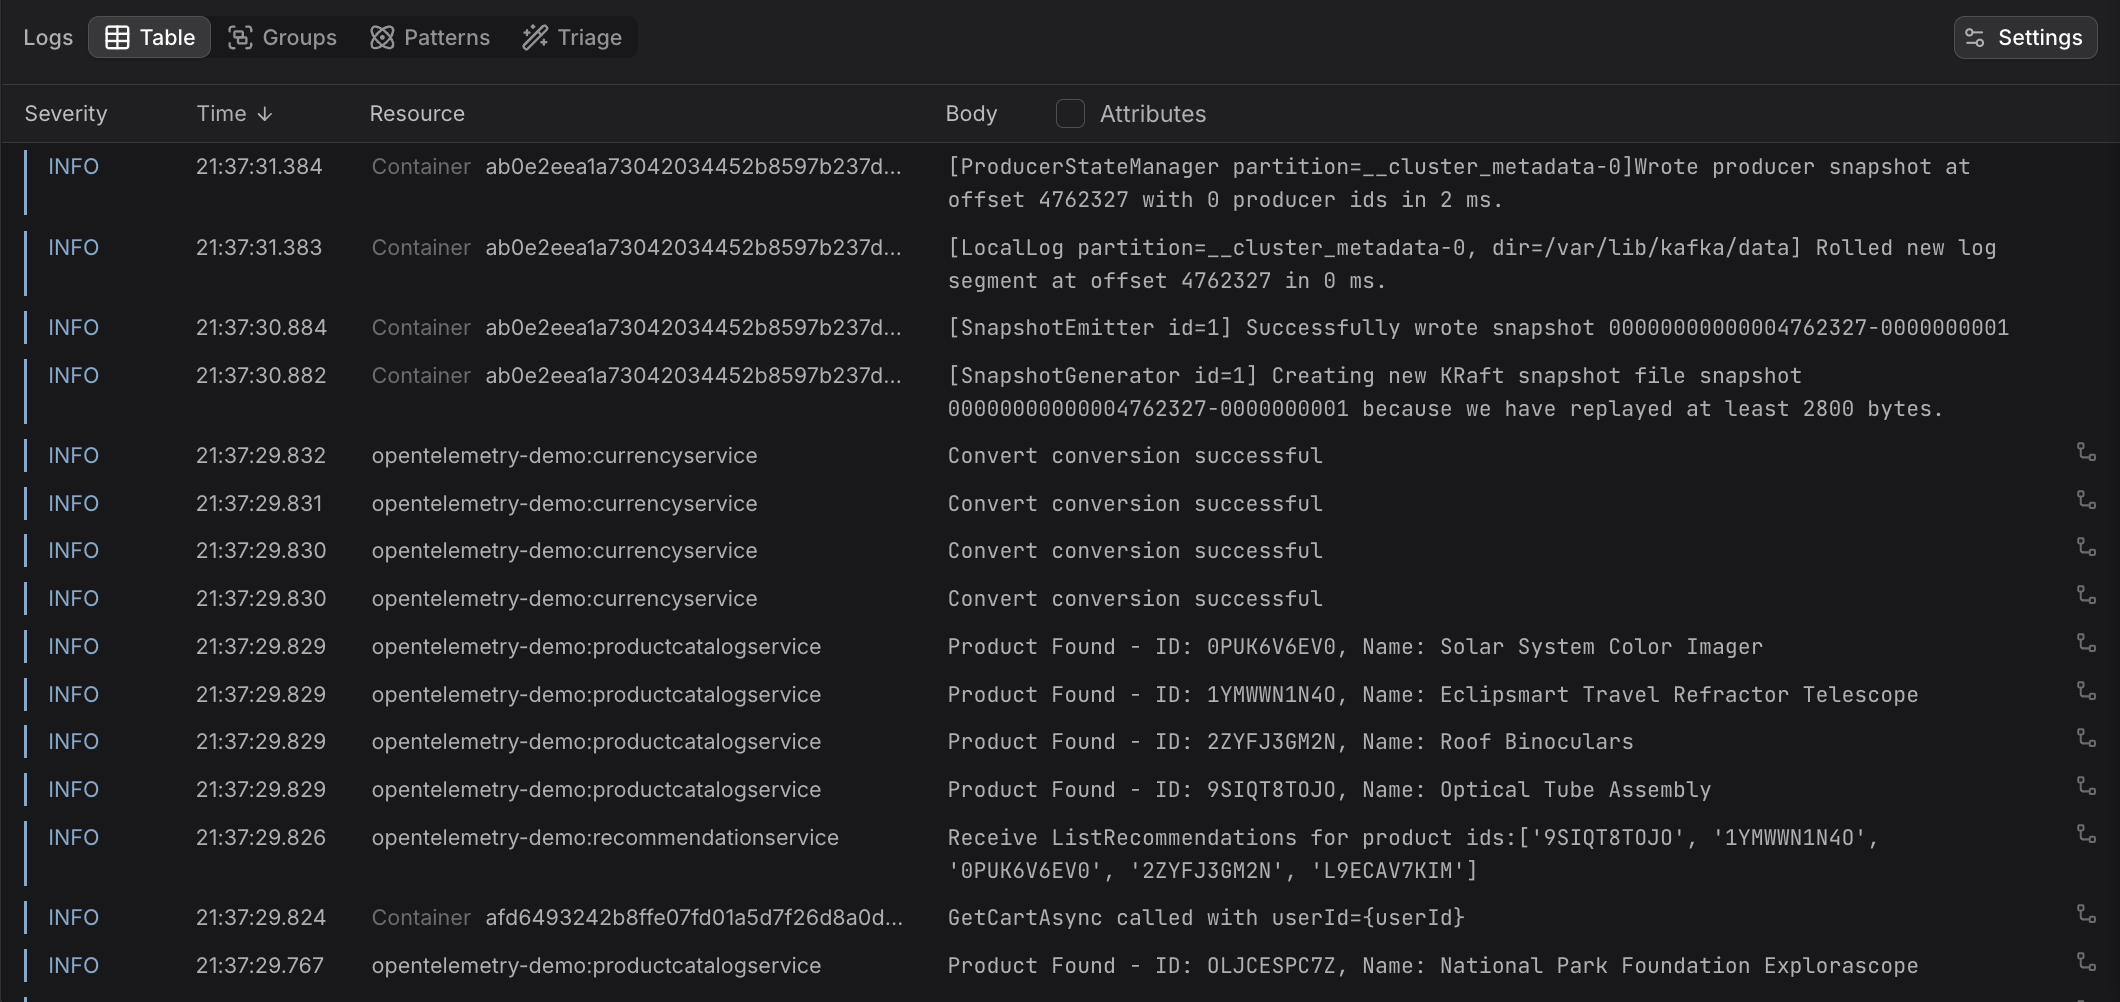
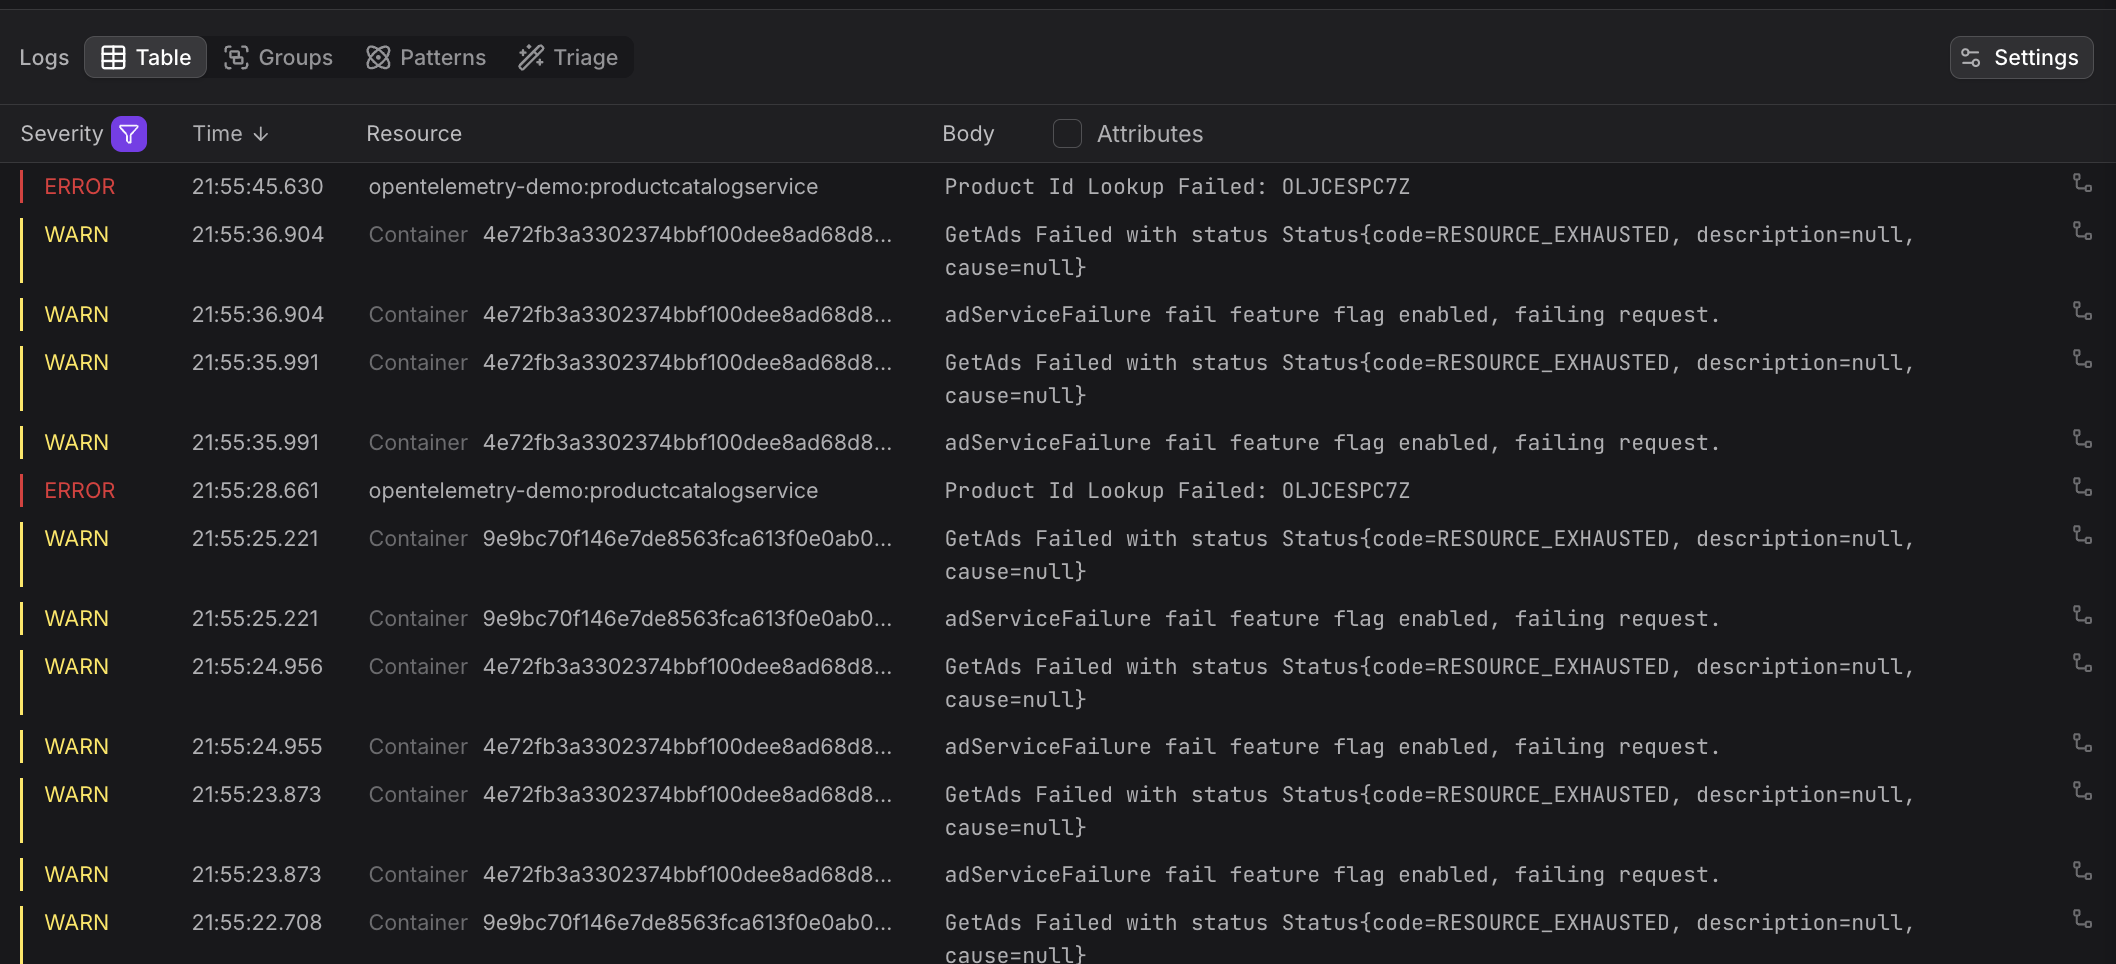
The Logs table lists all log records matching the current filters, sorted by time, so that logs being created later appear first. The Logs table is the primary way to browse individual records and the starting point for drilling into specific issues.
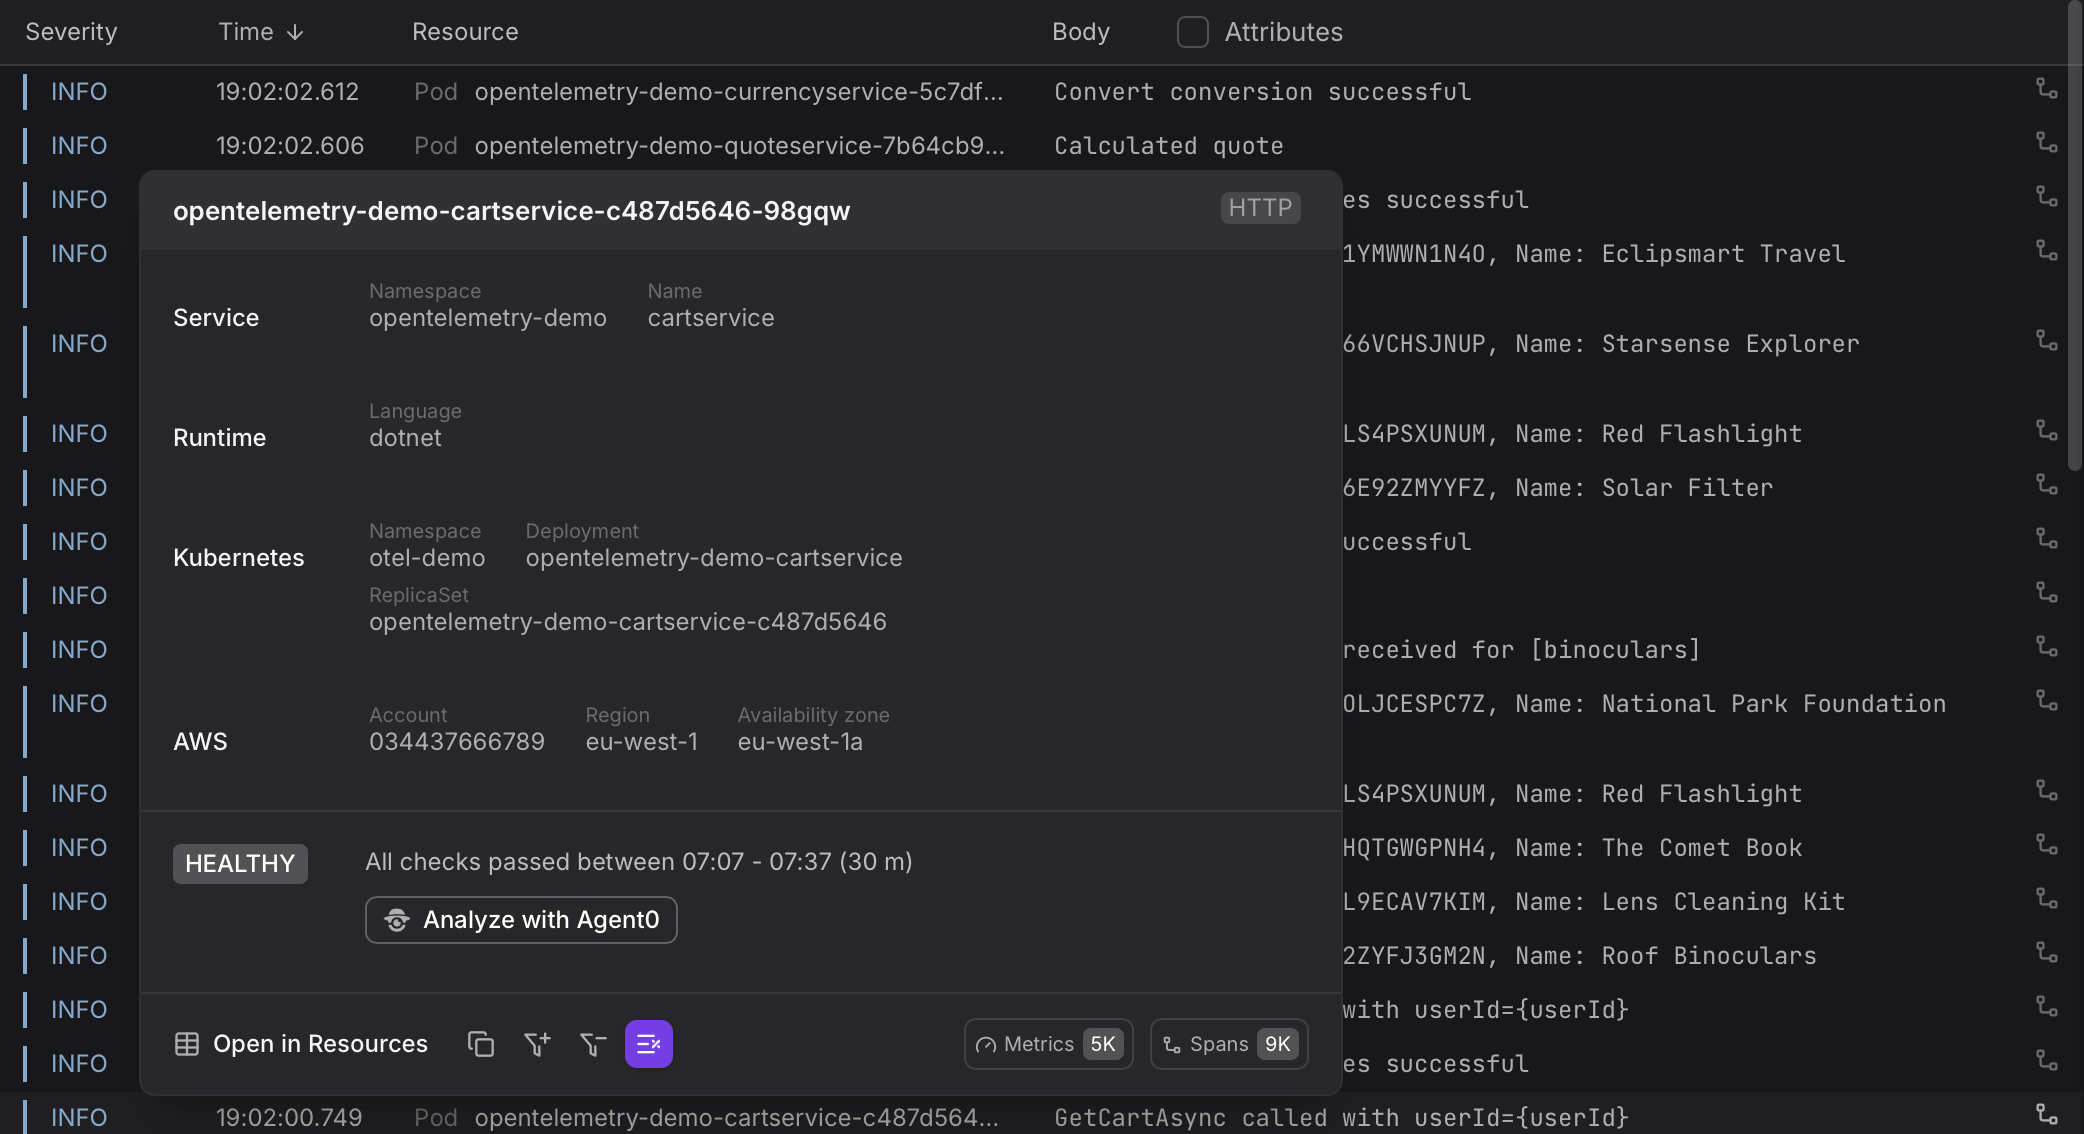
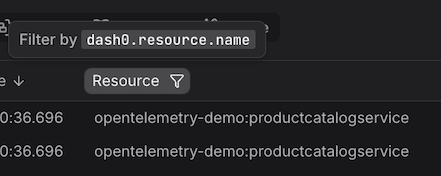
Hover over a value in the Resource column to access its details.
Understand the Table Columns
| Column | Description |
|---|---|
| Severity | The severity level of the log record, color-coded to match the severity chart. See Identify Log Severities for an overview of severity ranges and how they are assigned to logs. |
| Time | When the log record was created. Click the column header to change sort order. |
| Resource | Where the log record came from — for example which Kubernetes pod and what service is associated with it. Helps distinguish logs from different services or deployments at a glance. |
| Body | The main content of the log record. For structured logs or logs containing stringified JSON in their body, the body is displayed as a structured JSON document; for unstructured logs the body is shown as raw message text. |
| Trace Context | Whether the log record is associated with a trace. If a trace context is present on the log, you can click through to the corresponding trace from the Log Sidebar and see that log in the context of the full request. |
Use the Settings button in the top right of the table to choose which columns are displayed.
Show Inline Attributes
By default, the Body column shows only the log message text. When you select the Attributes checkbox (the checkbox within the Body column header), key attribute values are added directly within each row, so that you can scan important context — such as user IDs, status codes, or service names — without needing to open the Log Sidebar.
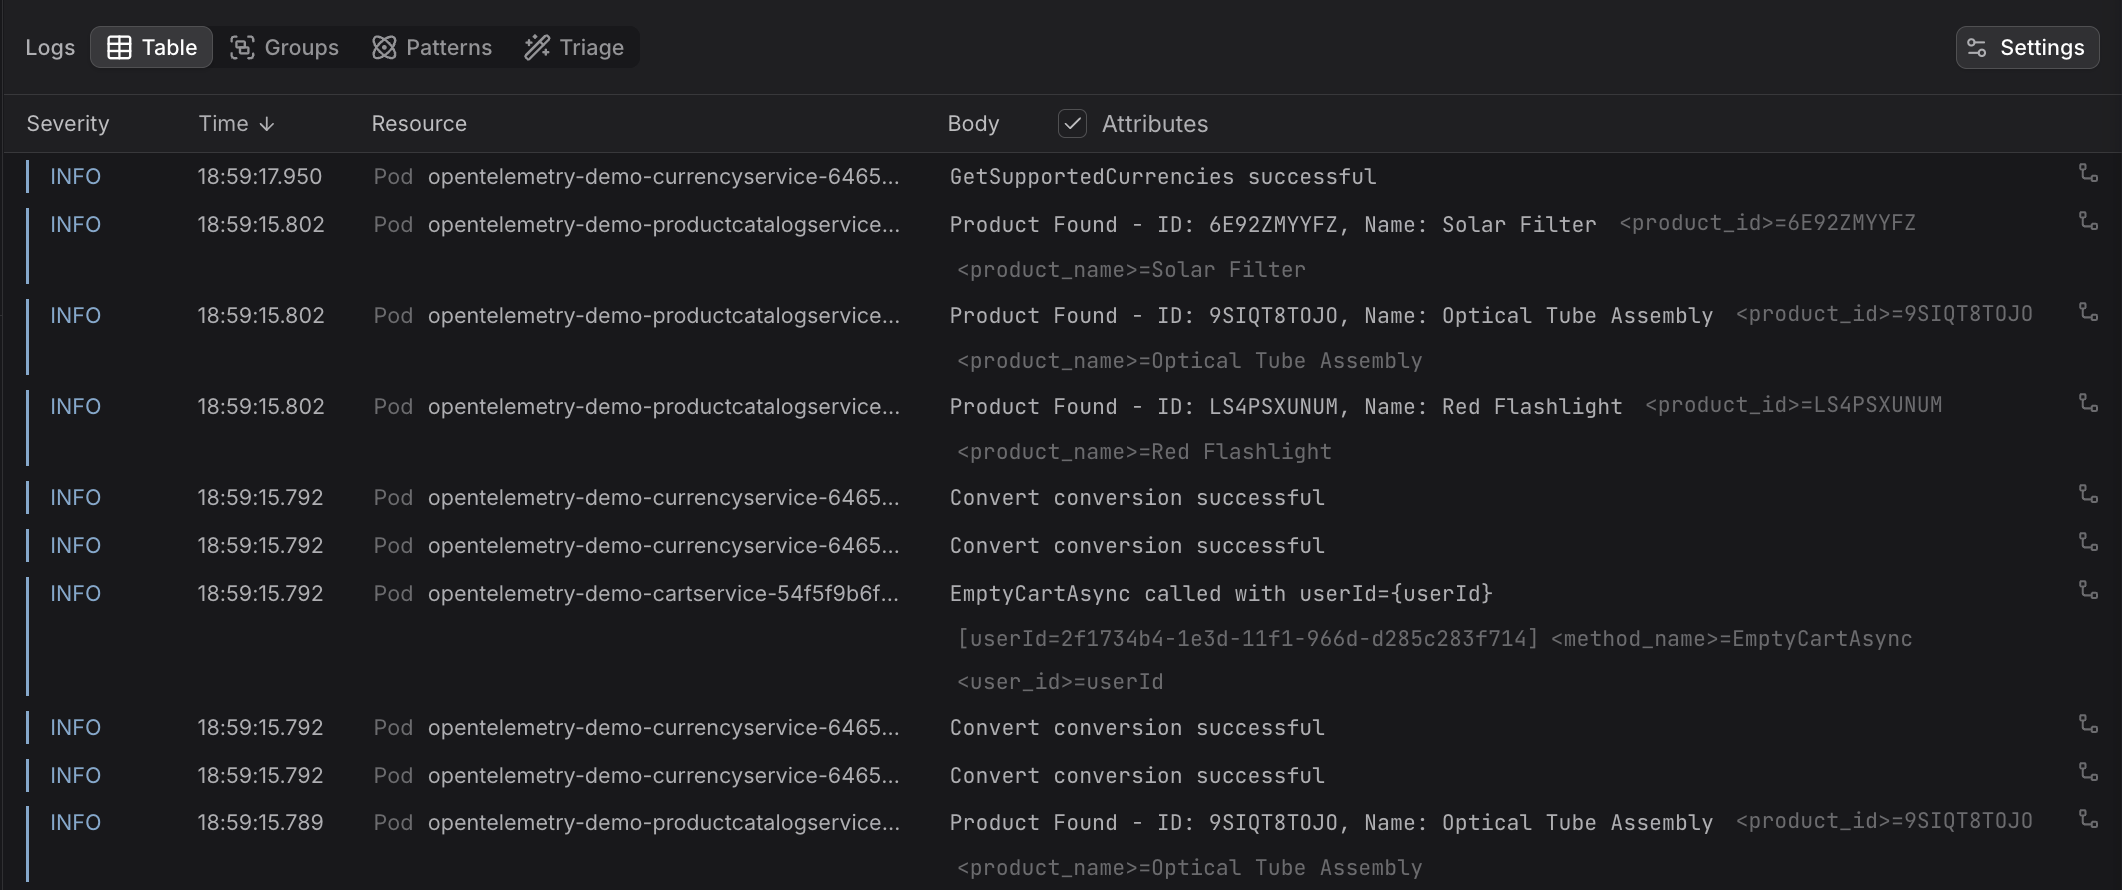
When inline attributes are visible, hovering over any attribute value reveals + and − icons, which allow you to set filters including or excluding from the query logs that have that attribute and value.
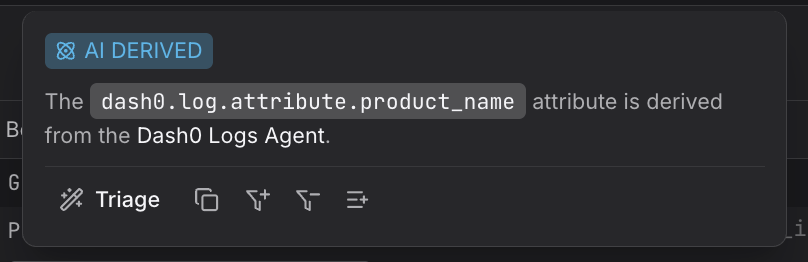
When you hover on an attribute, you can see whether it is AI derived.
Clicking Triage on an attribute value does several things simultaneously:
- Adds a filter scoping the table to records with that exact value.
- Lets you open Triage mode pre-scoped to that filtered set, immediately showing how that attribute value is distributed across other dimensions — useful for understanding whether the value is concentrated in a particular service, host, or log pattern.
This is the fastest path from noticing an interesting value in a log row to a comparative analysis of what else correlates with it.
Set Filters
Logs can be filtered by severity, by the value of any column, or directly from a cell in the table. Active filters are shown above the table and can be removed individually or all at once.
By Severity
Click the Severity column header to open the severity filter. Select the severity levels of interest — the count of matching records per level is shown alongside each option.
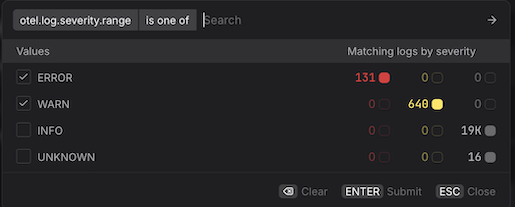
For example, hide info and debug records to focus only on errors and warnings.
By Column Value
To filter on a specific column value, hover over the column header to reveal the quick filter icon. The attribute key that will be used for the filter is shown in the tooltip.
- Click the icon to open the quick filter dialog. The column is pre-selected as the filter key.
- Select an operator, then select one or more values to apply the filter.
From a Table Cell
Hovering over a value in the Body column reveals a + or − filter icon directly on the cell. Click + to add a filter that includes records with that value, or − to add a filter that excludes them.
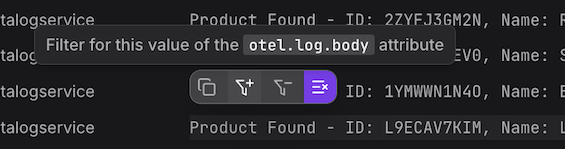
This is the fastest way to narrow the table based on a specific value you can already see.