Last updated: July 14, 2026
Monitor Cloud SQL
Dash0 automatically collects metrics for Cloud SQL instances in your connected GCP projects, providing visibility into resource utilization, connection activity, and engine-specific performance for PostgreSQL, MySQL, and SQL Server.
Cloud SQL metrics help you understand how your databases consume CPU, memory, and disk, track connection pressure, and surface engine-specific signals such as cache hit ratios, slow queries, and deadlocks before they affect your applications.
Viewing Cloud SQL Metrics
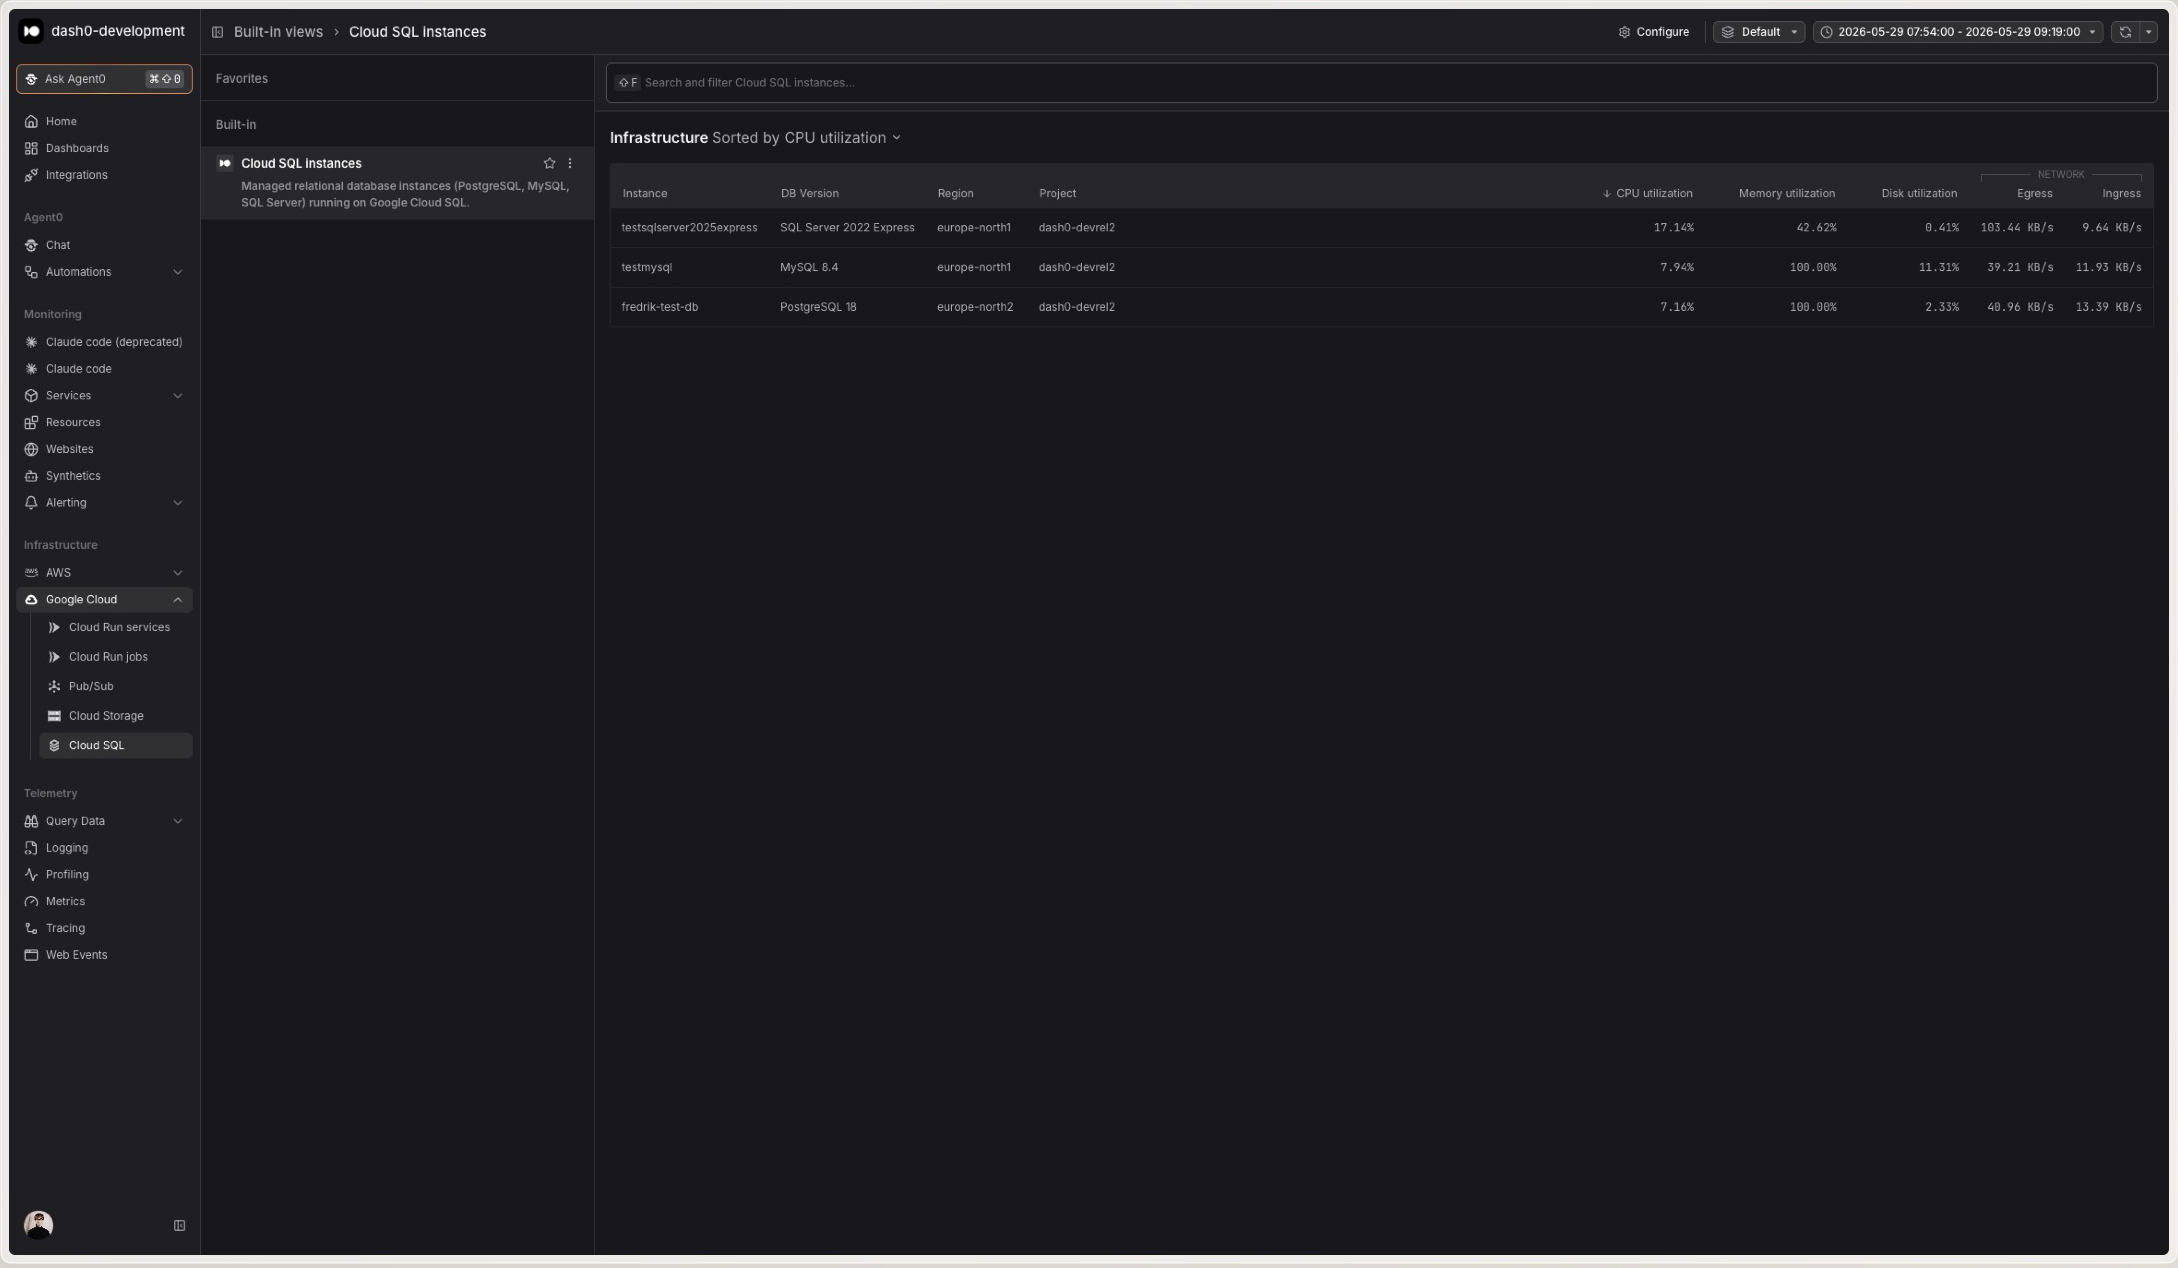
Navigate to Infrastructure > Google Cloud > Cloud SQL to see all Cloud SQL instances across your connected projects. The view displays:
- Instance names with their database engine and version
- Region and project for each instance
- CPU, memory, and disk utilization as a fraction of the instance's reserved capacity
- Network throughput showing ingress and egress rates
- Open issues raised by failed check rules
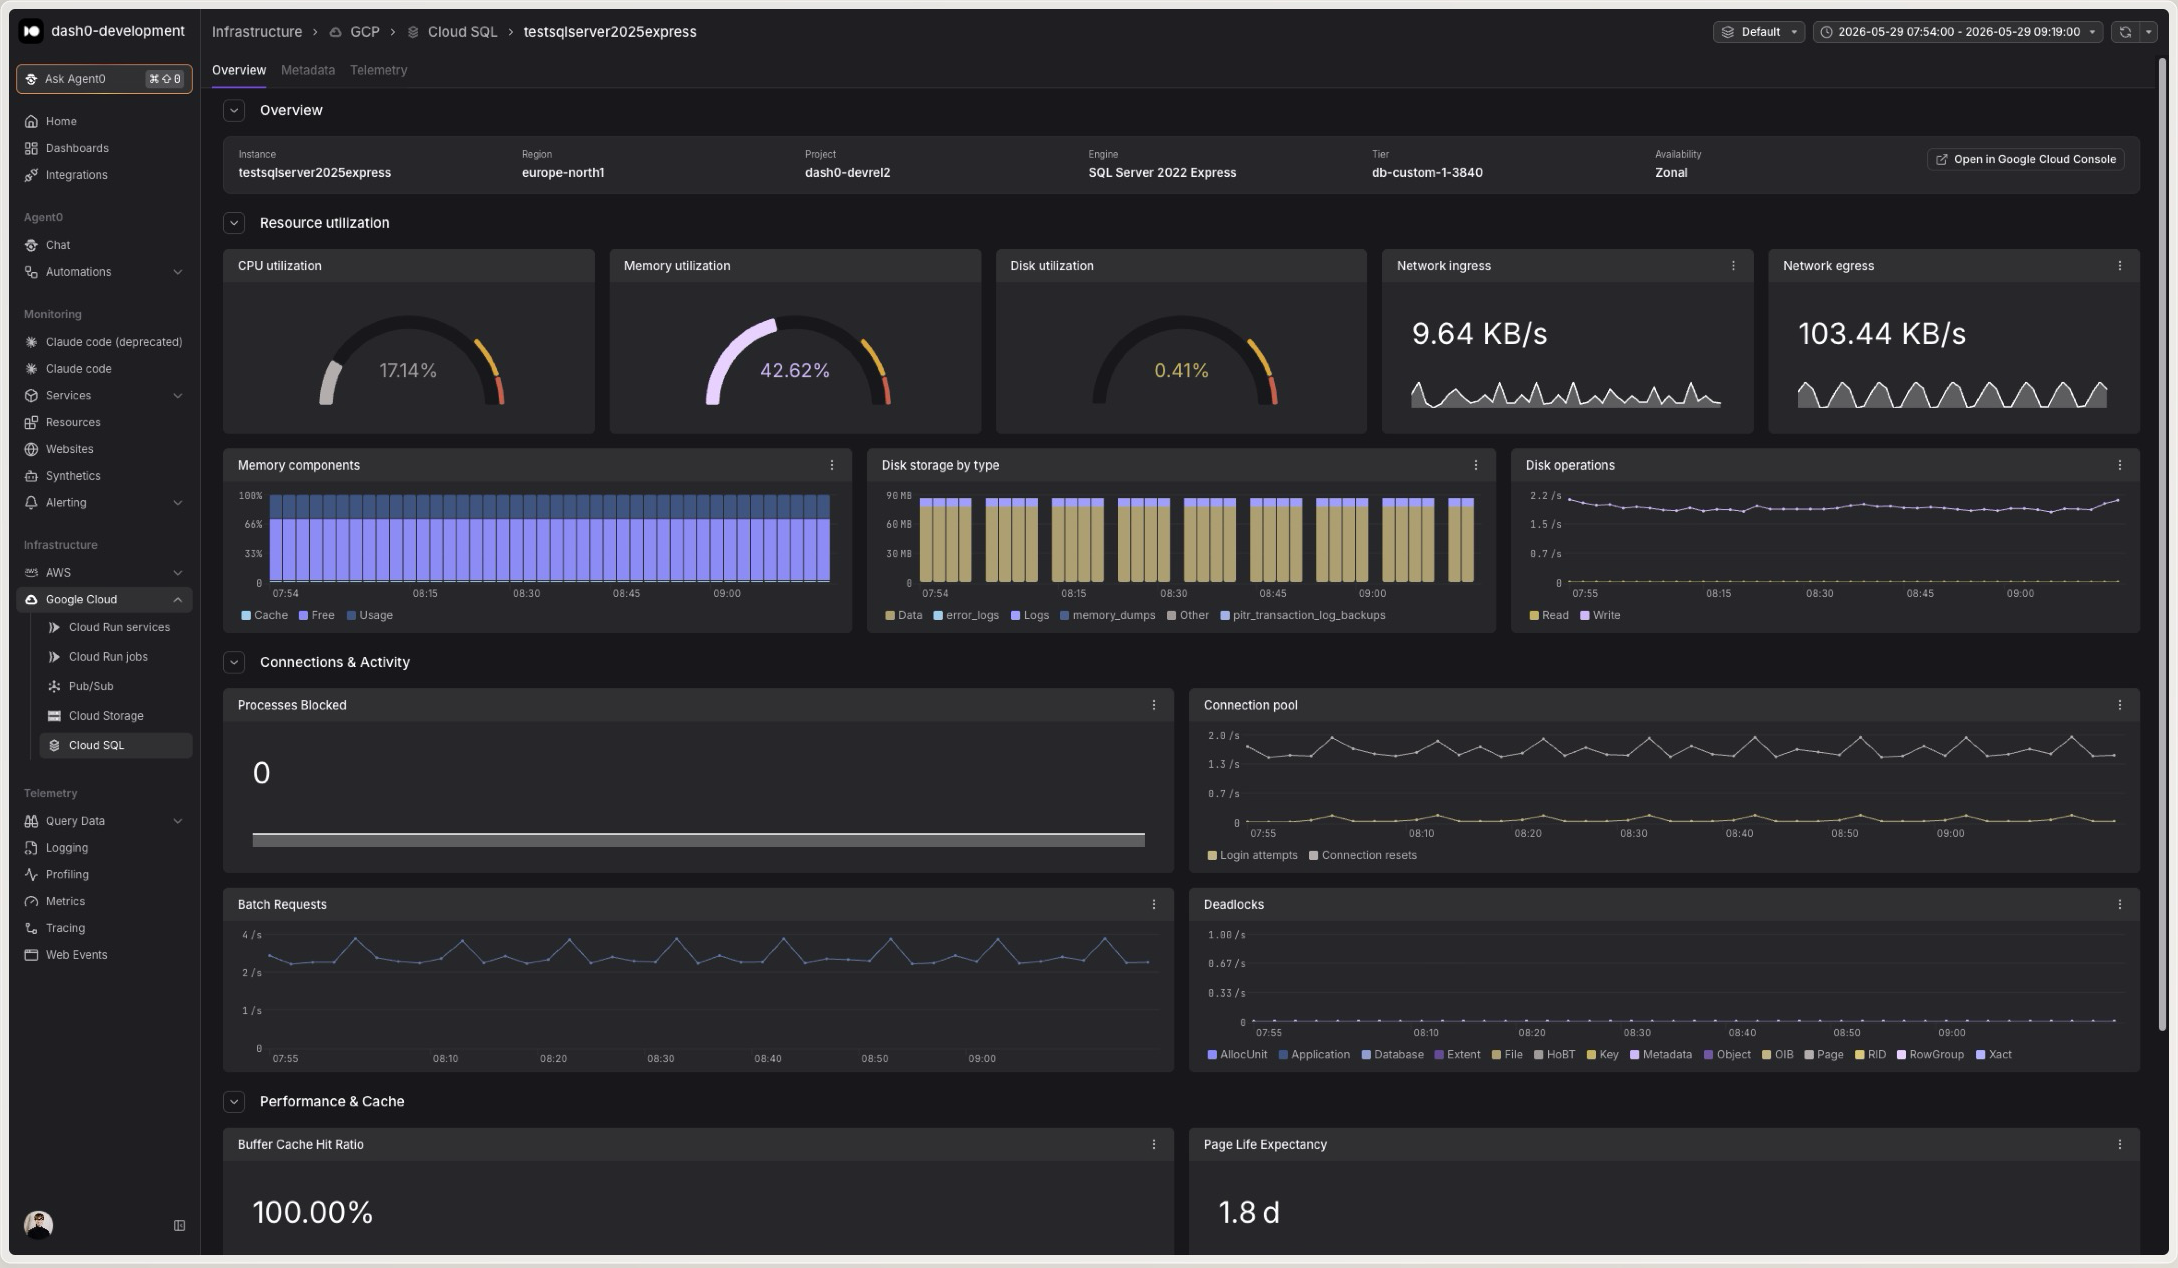
Click any instance to drill into detailed metrics and time-series charts. The detail view is organized into three sections:
- Resource utilization: CPU, memory, and disk utilization gauges, network ingress and egress, disk read and write operations, memory components, and disk storage by data type.
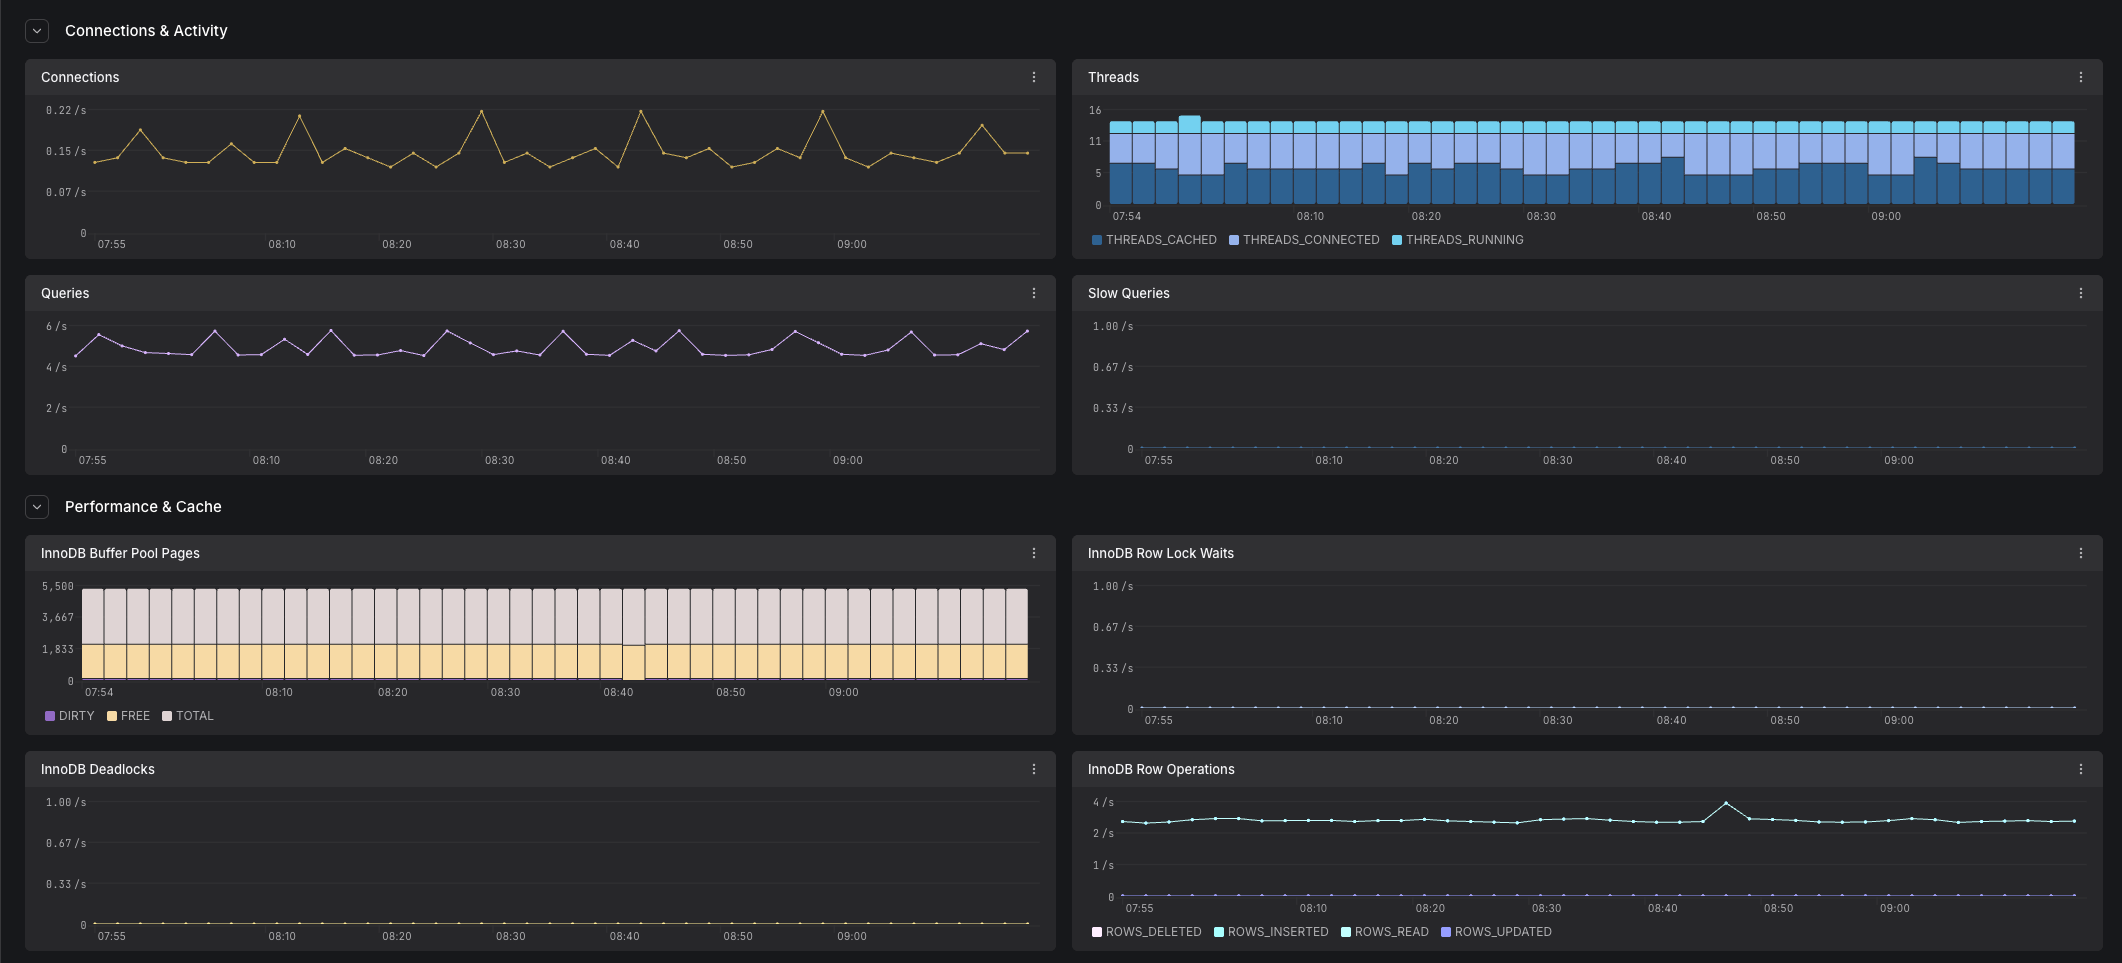
- Connections & activity: Connection counts and query throughput, adapted to the instance's database engine.
- Performance & cache: Cache hit ratios, transaction throughput, and engine-specific health indicators.
Engine-Specific Metrics
Dash0 detects the database engine from each instance's databaseVersion and maps it to the OpenTelemetry db.system.name attribute (postgresql, mysql, or microsoft.sql_server). The Connections & activity and Performance & cache sections then present metrics tailored to that engine.
PostgreSQL
- Connections:
cloudsql.googleapis.com/database/postgresql/num_backendsandnum_backends_by_state(grouped bystate) - New connections:
cloudsql.googleapis.com/database/postgresql/new_connection_count - Statements executed:
cloudsql.googleapis.com/database/postgresql/statements_executed_count(grouped byoperation_type) - Cache hit ratio:
cloudsql.googleapis.com/database/postgresql/data_cache/hit_ratio - Blocks read:
cloudsql.googleapis.com/database/postgresql/blocks_read_count(grouped bysource) - Transactions:
cloudsql.googleapis.com/database/postgresql/transaction_count(grouped bytransaction_type) - Transaction ID utilization:
cloudsql.googleapis.com/database/postgresql/transaction_id_utilization
MySQL
- Connections:
cloudsql.googleapis.com/database/mysql/connections_count - Threads:
cloudsql.googleapis.com/database/mysql/threads(grouped bythread_kind) - Queries:
cloudsql.googleapis.com/database/mysql/queries - Slow queries:
cloudsql.googleapis.com/database/mysql/slow_queries_count - InnoDB buffer pool pages:
cloudsql.googleapis.com/database/mysql/innodb/buffer_pool_pages(grouped byinnodb_page_type) - InnoDB row lock waits:
cloudsql.googleapis.com/database/mysql/innodb/row_lock_waits_count - InnoDB deadlocks:
cloudsql.googleapis.com/database/mysql/innodb/deadlocks_count - InnoDB row operations:
cloudsql.googleapis.com/database/mysql/innodb/row_operations_count(grouped byoperation_type)
SQL Server
- Login attempts and connection resets:
cloudsql.googleapis.com/database/sqlserver/connections/login_attempt_countandconnection_reset_count - Processes blocked:
cloudsql.googleapis.com/database/sqlserver/connections/processes_blocked - Batch requests:
cloudsql.googleapis.com/database/sqlserver/transactions/batch_request_count - Deadlocks and lock waits:
cloudsql.googleapis.com/database/sqlserver/transactions/deadlock_countandlock_wait_count(grouped bylocked_resource) - Buffer cache hit ratio:
cloudsql.googleapis.com/database/sqlserver/memory/buffer_cache_hit_ratio - Page life expectancy:
cloudsql.googleapis.com/database/sqlserver/memory/page_life_expectancy - Full scans:
cloudsql.googleapis.com/database/sqlserver/transactions/full_scan_count
Common Use Cases
Cloud SQL metrics support several operational scenarios, from capacity planning to query tuning. The following examples demonstrate practical ways to use these metrics in your workflows.
Monitoring Resource Saturation
Utilization metrics are gauges reported as a fraction between 0.0 and 1.0:
12345678# CPU utilization as a percentage, by instance{otel_metric_name="cloudsql.googleapis.com/database/cpu/utilization"} * 100# Instances above 90% memory utilization{otel_metric_name="cloudsql.googleapis.com/database/memory/utilization"} > 0.9# Disk utilization approaching the configured quota{otel_metric_name="cloudsql.googleapis.com/database/disk/utilization"} > 0.85
Sustained high utilization may indicate:
- Under-provisioned instance tiers
- Inefficient queries consuming excessive CPU or memory
- Disk filling up due to data growth or long-running transactions
- A need to enable storage auto-resize or scale up the instance
Tracking Connection Usage
Watch connection counts to catch pools that are exhausting available backends:
1234567891011# PostgreSQL active connections by instancesum by (database_id) ({otel_metric_name="cloudsql.googleapis.com/database/postgresql/num_backends"})# PostgreSQL connections grouped by statesum by (state) ({otel_metric_name="cloudsql.googleapis.com/database/postgresql/num_backends_by_state"})# MySQL connection attempts per secondsum by (database_id) (rate({otel_metric_name="cloudsql.googleapis.com/database/mysql/connections_count"}[5m]))# SQL Server blocked processes (a sign of contention){otel_metric_name="cloudsql.googleapis.com/database/sqlserver/connections/processes_blocked"} > 0
Watching Disk I/O and Throughput
Disk operations and network counters are delta counters, so wrap them in rate():
123456# Disk read and write operations per secondsum by (database_id) (rate({otel_metric_name="cloudsql.googleapis.com/database/disk/read_ops_count"}[5m]))sum by (database_id) (rate({otel_metric_name="cloudsql.googleapis.com/database/disk/write_ops_count"}[5m]))# Network egress rate by instancesum by (database_id) (rate({otel_metric_name="cloudsql.googleapis.com/database/network/sent_bytes_count"}[5m]))
Use these to spot I/O-bound workloads, noisy neighbors, and instances that would benefit from higher provisioned IOPS.
Diagnosing Engine-Specific Health
Engine-specific metrics help you tune queries and catch contention:
123456789# PostgreSQL cache hit ratio (closer to 1.0 is better){otel_metric_name="cloudsql.googleapis.com/database/postgresql/data_cache/hit_ratio"}# MySQL slow queries per secondsum by (database_id) (rate({otel_metric_name="cloudsql.googleapis.com/database/mysql/slow_queries_count"}[5m]))# Deadlocks per second (MySQL InnoDB and SQL Server)sum by (database_id) (rate({otel_metric_name="cloudsql.googleapis.com/database/mysql/innodb/deadlocks_count"}[5m]))sum by (database_id) (rate({otel_metric_name="cloudsql.googleapis.com/database/sqlserver/transactions/deadlock_count"}[5m]))
A falling cache hit ratio, a rising slow-query rate, or a sudden spike in deadlocks often points to a query regression or a schema change worth investigating.
Correlating with Application Telemetry
Cloud SQL metrics are more actionable when combined with application-level telemetry:
- Traces showing database queries from your applications
- Logs containing slow-query logs and connection errors
- Custom metrics tracking application-specific query latency and pool saturation
When investigating a latency spike, pivot from instance utilization to traces to understand:
- Which services are issuing queries against the instance
- How long queries take end-to-end
- Whether connection pool exhaustion is delaying requests
- How database pressure correlates with user-facing latency
Instrument your database clients with OpenTelemetry so spans carry db.system.name and db.namespace. Dash0 correlates these with Cloud SQL infrastructure metrics. See GCP Resources for attribute conventions.
Querying Cloud SQL Metrics
Metrics are stored using their GCP Cloud Monitoring metric type names and can be queried using otel_metric_name in PromQL.
Use PromQL in the Query Builder to create custom Cloud SQL dashboards:
12345678# Highest-CPU instances across all projectstopk(10, {otel_metric_name="cloudsql.googleapis.com/database/cpu/utilization"})# Memory utilization by instancesum by (database_id) ({otel_metric_name="cloudsql.googleapis.com/database/memory/utilization"})# Total disk write operations per second across all instancessum(rate({otel_metric_name="cloudsql.googleapis.com/database/disk/write_ops_count"}[5m]))
Cloud SQL metrics carry the following labels:
database_id: The composite instance identifier in the form<project>:<instance>cloud.region: The GCP region the instance runs incloud.account.id: The GCP project IDdb.system.name: The database engine (postgresql,mysql, ormicrosoft.sql_server)
Several metrics add their own breakdown labels, such as state and transaction_type (PostgreSQL), thread_kind and innodb_page_type (MySQL), locked_resource (SQL Server), and data_type and component for disk and memory composition.
Alerting on Cloud SQL Metrics
Create check rules to detect database issues:
- High CPU or memory utilization: Alert when an instance runs hot for a sustained period
- Disk approaching quota: Warn when disk utilization nears the configured limit so you can resize before writes fail
- Connection saturation: Notify when active connections approach the instance's maximum
- Slow queries or deadlocks: Detect rising slow-query rates or deadlock spikes that indicate a query regression
- Low cache hit ratio: Alert when the buffer or data cache hit ratio drops below your baseline
See Alerting for details on creating check rules with infrastructure metrics.
Best Practices
Follow these recommendations to optimize Cloud SQL monitoring and operations.
- Enable storage auto-resize: Combine it with a disk utilization alert so you are notified before automatic growth incurs cost
- Right-size instance tiers: Use CPU and memory utilization trends to choose a tier that matches real demand rather than peak guesses
- Watch cache hit ratios: A consistently high ratio keeps reads off disk, so investigate sustained drops promptly
- Tune slow queries: Correlate slow-query metrics with application traces to find and fix the queries driving load
- Monitor connection pressure: Track connection counts against your pool configuration to avoid exhausting available backends
- Plan for high availability: Compare metrics across primary and replica instances to validate that replicas keep up
Further Reading
- Monitor Cloud Run Services: Monitor Cloud Run services that connect to Cloud SQL
- GCP Resources: Resource naming and equality rules
- Set Up Google Cloud Integration: Configure the GCP integration
- Google Cloud Monitoring Metrics: Full list of available Cloud SQL metrics
- Cloud SQL Documentation: Learn more about Cloud SQL for PostgreSQL, MySQL, and SQL Server