
Last updated:
Write PromQL Queries
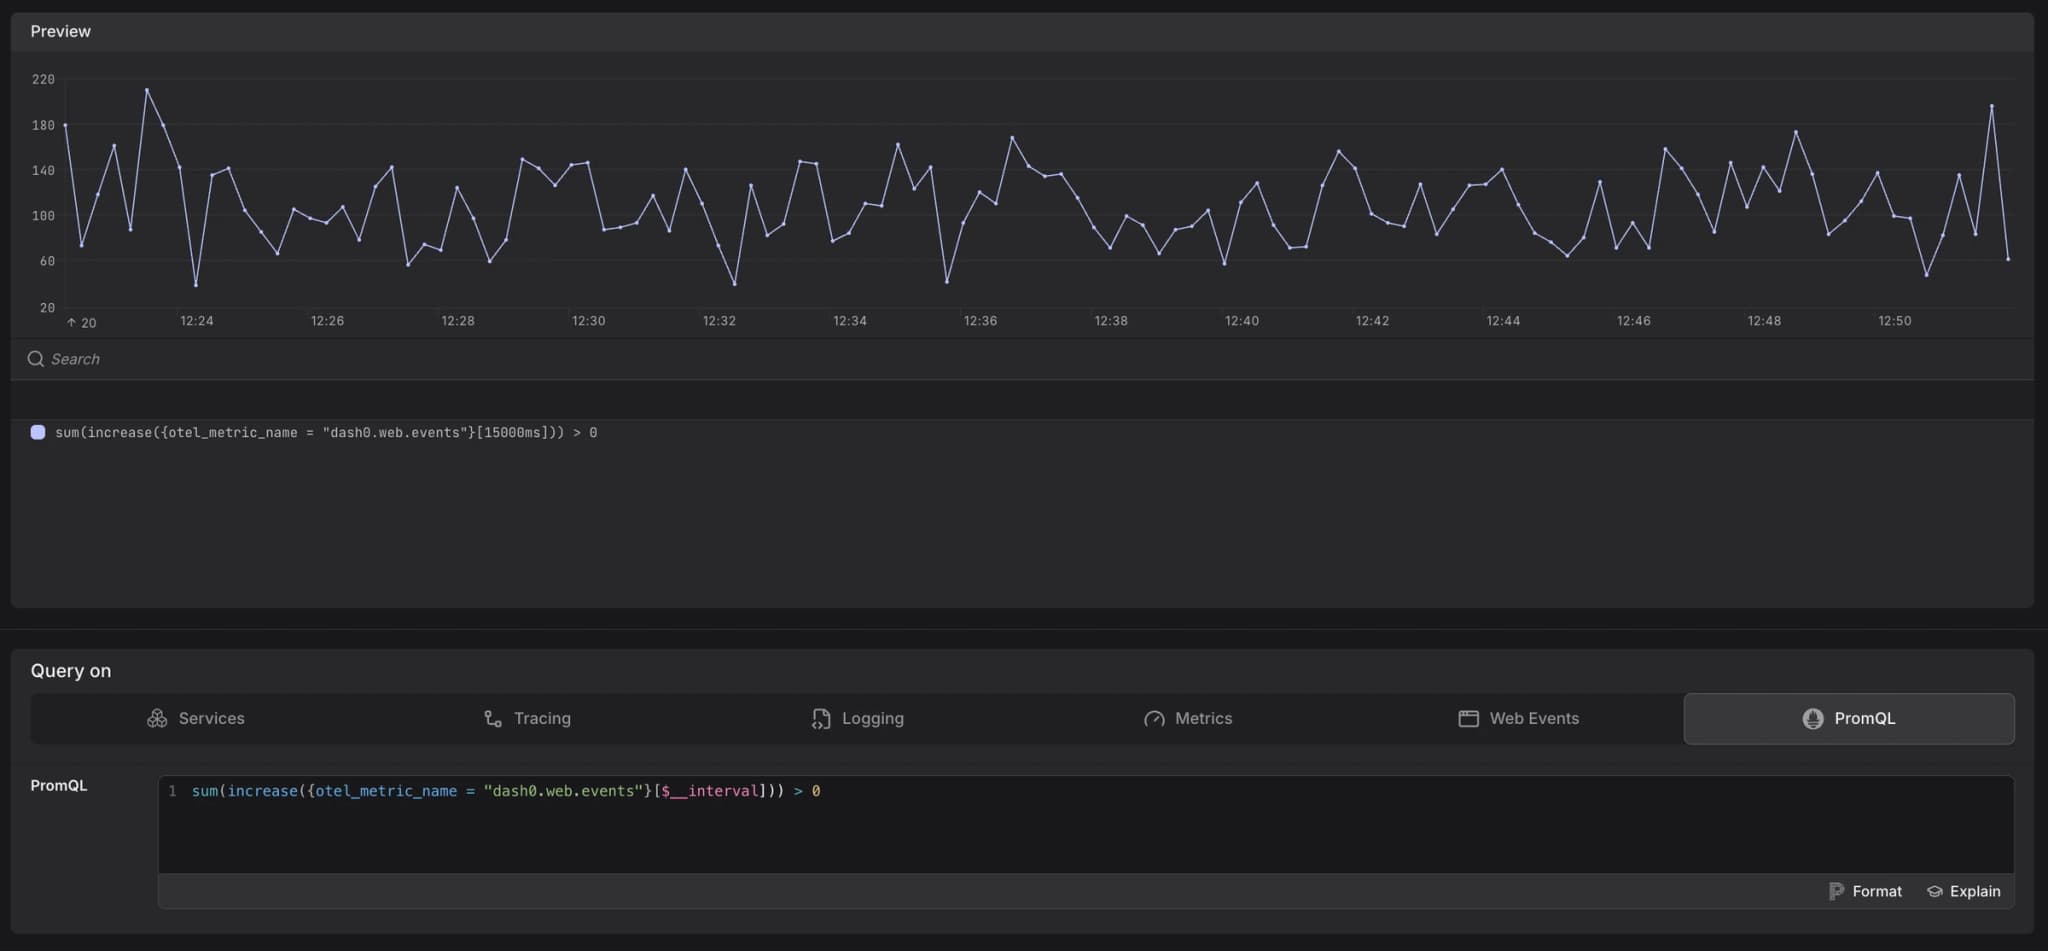
The PromQL tab in the Query Builder gives you a full-featured PromQL editor for cases that go beyond what the visual tabs support.
Use it when you need arithmetic across metrics, multi-label grouping, custom functions, or any other operation that requires direct query authorship.
Need help writing a PromQL query? Agent0 can generate queries from natural language descriptions. Describe what you want to measure, and Agent0 creates the PromQL expression with appropriate filters and aggregations.
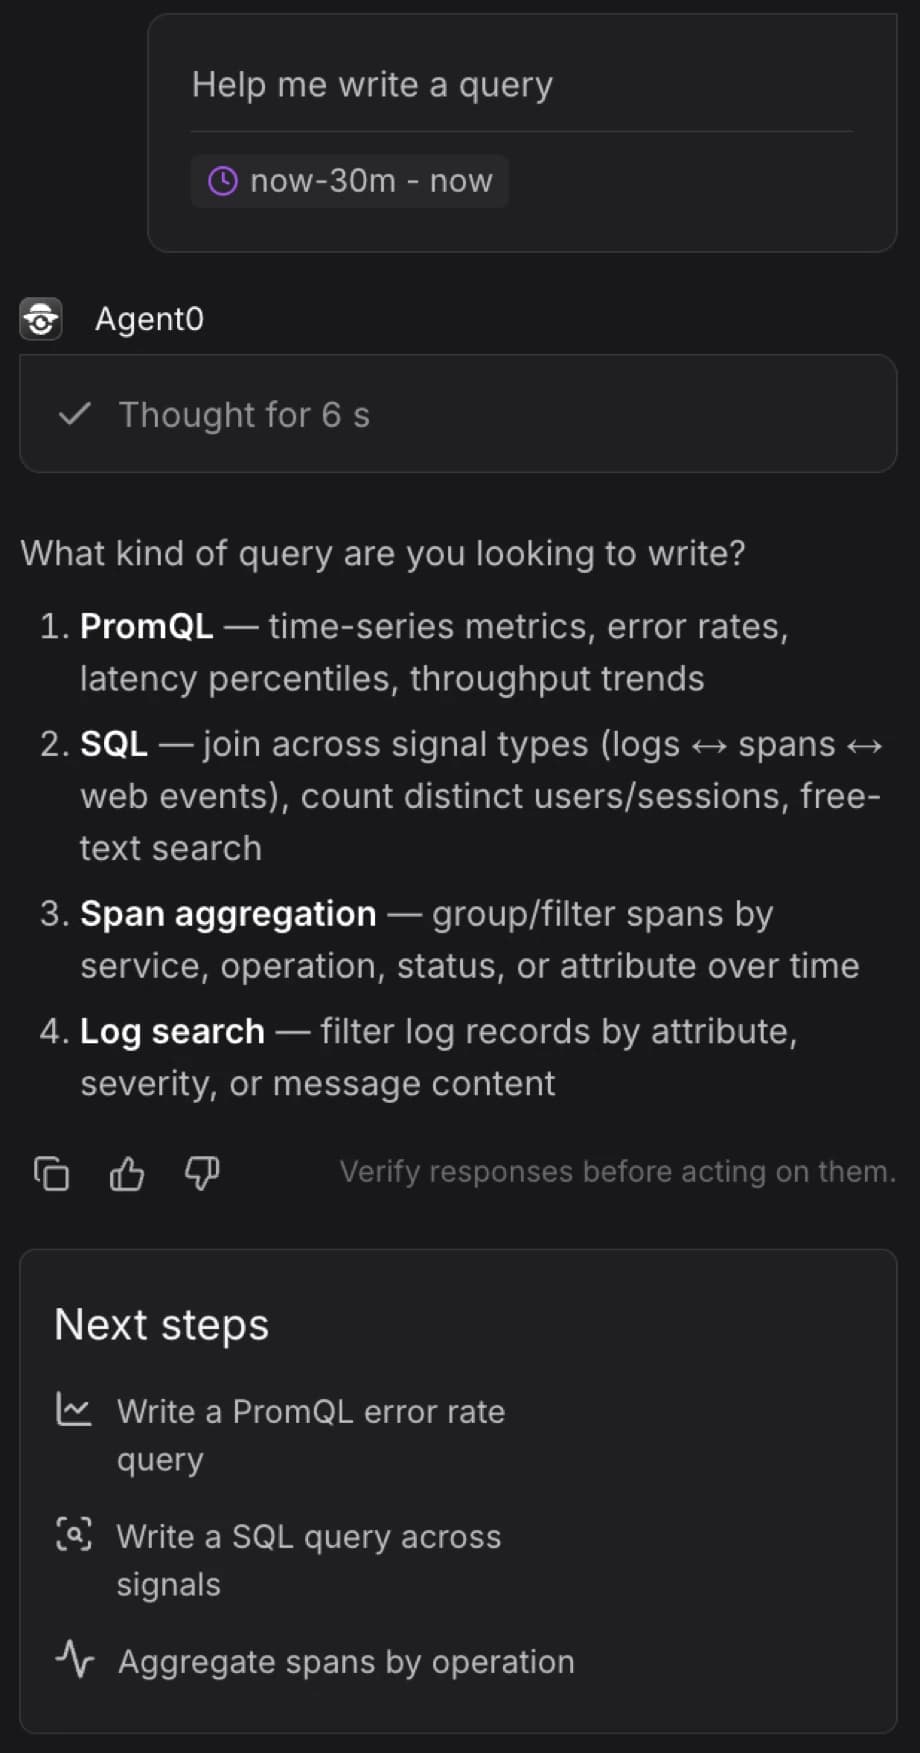
See Asset Creation for details on how Agent0 generates and validates queries.
Type a PromQL expression directly in the editor. The editor provides syntax highlighting. The preview chart above updates as you type.
Common starting points:
- Start from any PromQL Preview shown in one of the other tabs in the Query Builder — it is a valid, copy-paste-ready expression.
- Use
increase({otel_metric_name = "dash0.spans.duration"}[$__interval])to query span duration data. - Use
sum(increase({otel_metric_name = "dash0.logs"}[$__interval])) > 0to count logs over time.
The $__interval placeholder is automatically replaced by Dash0 based on the selected time range, keeping step sizes appropriate.
Duration Expressions in Range Selectors
Range selectors can calculate their window from the query step. For example:
rate(http_requests_total[max_of(5m, step() * 4)])step() is the step width of a range query. max_of() keeps this window at least five minutes, even when the step is short. You can also use arithmetic such as [5m * 2] for a fixed window of ten minutes.
Regex Label Matchers
Dash0 evaluates regexes in =~ and !~ label matchers without implicit anchors. A regex can match anywhere in the label value.
This differs from Prometheus, which implicitly anchors regex label matchers to the full value. In Prometheus, environment=~"prod" behaves like environment=~"^prod$".
In Dash0:
environment=~"prod"matchesprod,production, andpreprod.environment=~"^prod$"matches onlyprod.environment=~"^(staging|production)$"matches exactlystagingorproduction.
Add explicit ^ and $ anchors when you need a full-value match, especially when moving queries from Prometheus. You do not need to surround a regex with .* to perform a substring match in Dash0.
This behavior applies wherever Dash0 evaluates PromQL, including the Query Builder, dashboard panels, check rules, and the Prometheus-compatible query API.
Format and Explain
Two actions are available below the editor:
- Format — reformats the query to standard PromQL indentation and style without changing its semantics.
- Explain — parses the query and shows a human-readable breakdown of what each part does, which is useful when learning PromQL or debugging an unfamiliar expression.
Extend a Visual Query
A common workflow is to start with a visual tab to get the basic shape of a query, then switch to PromQL to add complexity:
- Build the base query in the Services, Tracing, Logging, Metrics, or Web Events tab.
- Click the PromQL tab — the generated query appears in the editor.
- Extend it — for example, add a
by (service_name, http_method)clause to group by two dimensions at once, or divide one metric by another to compute a ratio.
Once you switch to the PromQL tab and edit the query manually, switching back to a visual tab will not reconstruct the visual controls from your PromQL. Treat the switch as a one-way escalation for the current session.
Use PromQL Queries in the Dash0 API
Any expression you write or generate in the Query Builder can be used in the Dash0 API directly.
Copy the expression from the PromQL editor or from the PromQL Preview in any visual tab and use it in your API calls to query time series data programmatically.
Create Dashboards and Check Rules from the Query
Once you have the view you want, use the buttons at the top of the Query Builder, above the preview chart.

- Click Add to dashboard to add the current query as a panel to a new or existing dashboard.
- Click Create check rule to open the check rule editor with this query pre-filled as the rule expression.